- Area Ecosystem Population

Содержание
- 2. You are a scientist in the field of ecology and you were given the task to
- 3. Data collection and analysis Methods of mathematical statistics The application of these methods makes it possible
- 4. Types of statistical test T-test (Student’s T-test) Use to test the equality of the average values
- 5. T-test 2 test groups Determining the differences between the two groups One or more samples per
- 6. Example of research question Which species of pine (Scotch or Kulunda) are more common in Kazakhstan?
- 7. Examples of Hypotheses Research Hypotheses In Kazakhstan the Kulunda pine is more common Statistical hypotheses Null
- 8. Methods of ecological research Laboratory method Experimental and experimental method Field method The objects of field
- 9. Objectives of field researches Determine (определить) the distribution (распространение), abundance (численность) and quality of the species,
- 10. Methods of field research Lay out and describe a sample area (закладка и описание пробных площадей
- 12. Example Question: Which part of the school garden has more dandelions? Research hypothesis: Null hypothesis: Alternate
- 13. Method of research (squares method or key sites) метод квадратов или ключевых участков Select the sample
- 14. Data collection Number of dandelions on the school garden
- 15. Step 1 Calculate the mean value
- 17. Step 2 Calculate the deviation from mean by subtracting the mean from the value of X
- 19. Step 3 Square the deviation from the mean for both the samples
- 21. Step 4 Calculate the sum of the squares
- 23. Step 5 Calculate the variance for both the samples
- 25. Step 6 calculate the value of T using the formula provided in the Table
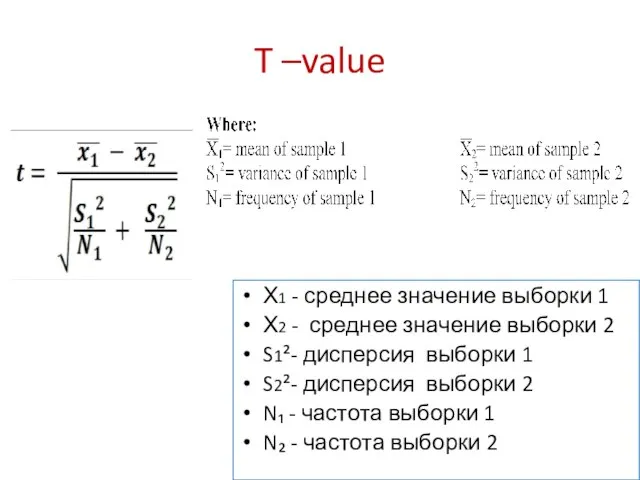
- 26. T –value Х1 - среднее значение выборки 1 Х2 - среднее значение выборки 2 S1²- дисперсия
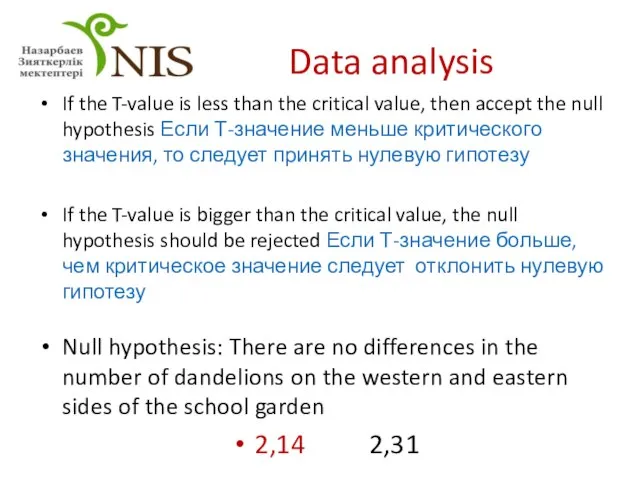
- 27. Answer 2,14
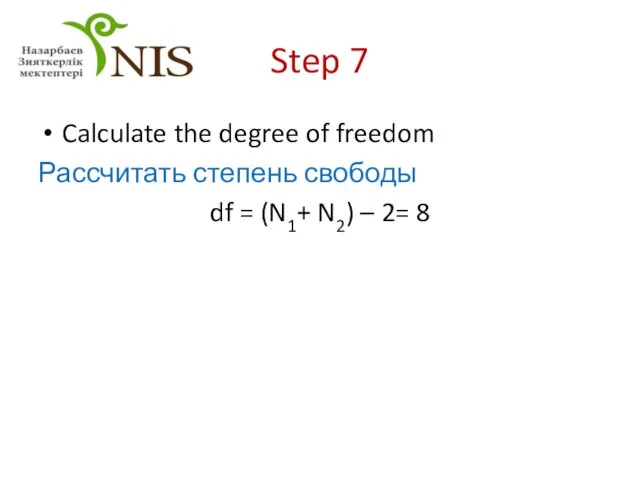
- 28. Step 7 Calculate the degree of freedom Рассчитать степень свободы df = (N1+ N2) – 2=
- 29. Step 8 Find the critical value using the t- table
- 30. Degree of freedom 2,31
- 31. Data analysis If the T-value is less than the critical value, then accept the null hypothesis
- 32. Analysis of results If the null hypothesis is accepted, then there was NO significant difference in
- 34. Скачать презентацию
You are a scientist in the field of ecology and you
You are a scientist in the field of ecology and you
Data collection and analysis
Methods of mathematical statistics
The application of these methods
Data collection and analysis
Methods of mathematical statistics
The application of these methods
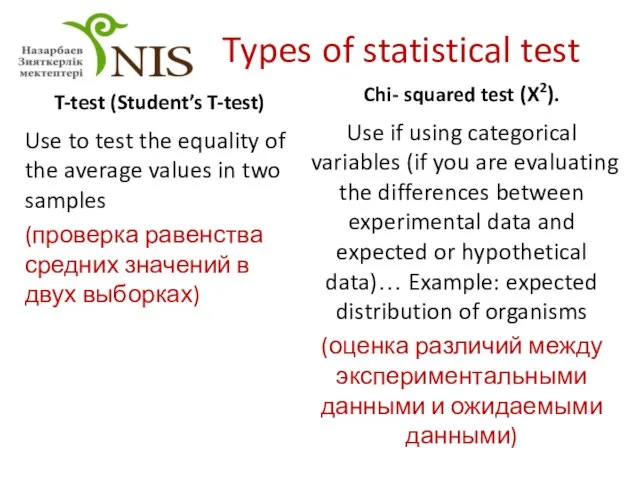
Types of statistical test
T-test (Student’s T-test)
Use to test the equality of
Types of statistical test
T-test (Student’s T-test)
Use to test the equality of
T-test
2 test groups
Determining the differences between the two groups
One or more
T-test
2 test groups
Determining the differences between the two groups
One or more

Example of research question
Which species of pine (Scotch or Kulunda) are more
Example of research question
Which species of pine (Scotch or Kulunda) are more
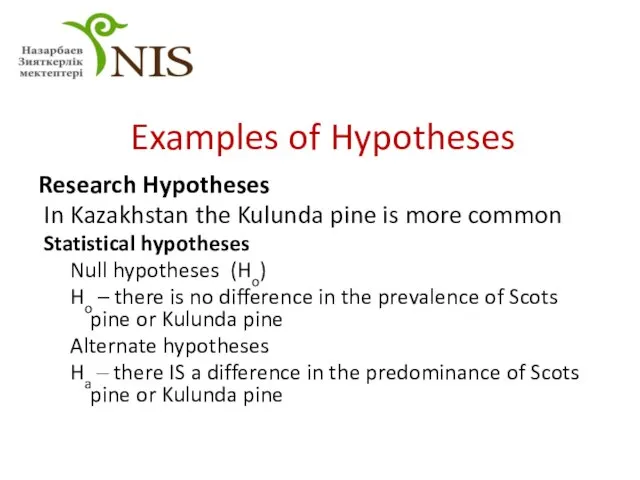
Examples of Hypotheses
Research Hypotheses
In Kazakhstan the Kulunda pine is
Examples of Hypotheses
Research Hypotheses
In Kazakhstan the Kulunda pine is
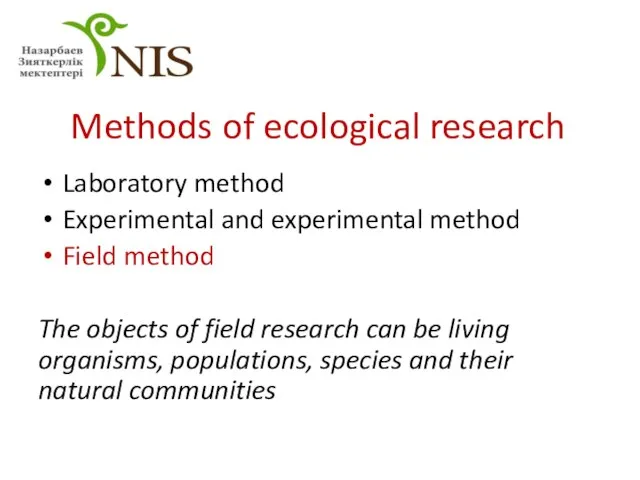
Methods of ecological research
Laboratory method
Experimental and experimental method
Field method
The objects of
Methods of ecological research
Laboratory method
Experimental and experimental method
Field method
The objects of
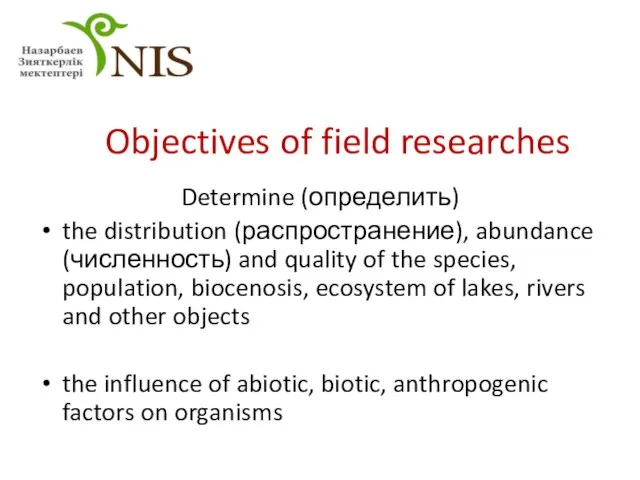
Objectives of field researches
Determine (определить)
the distribution (распространение), abundance (численность) and quality
Objectives of field researches
Determine (определить)
the distribution (распространение), abundance (численность) and quality
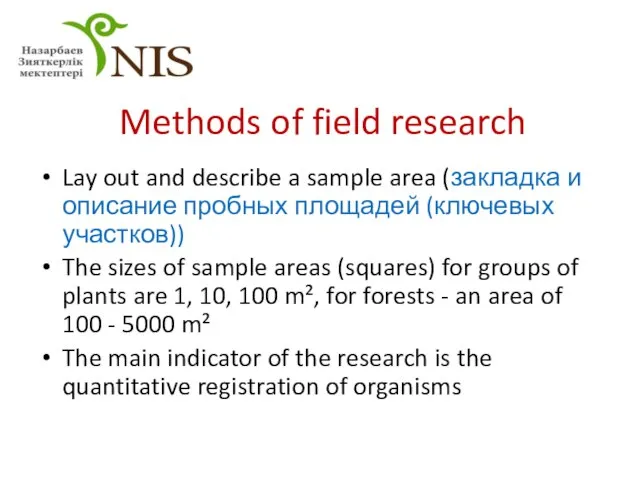
Methods of field research
Lay out and describe a sample area (закладка
Methods of field research
Lay out and describe a sample area (закладка

Example
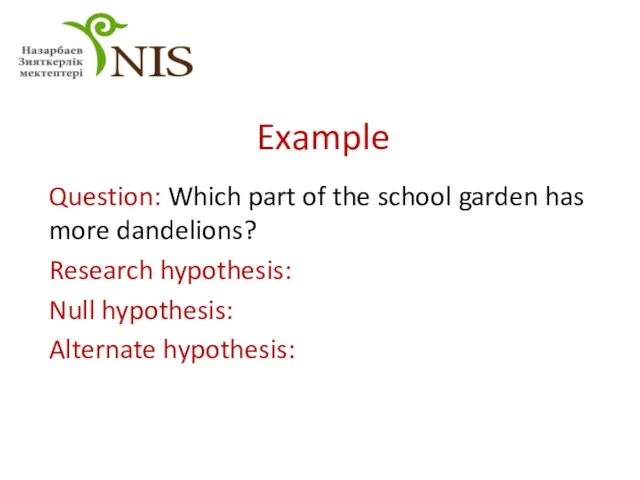
Question: Which part of the school garden has more dandelions?
Research hypothesis:
Null
Example
Question: Which part of the school garden has more dandelions?
Research hypothesis:
Null
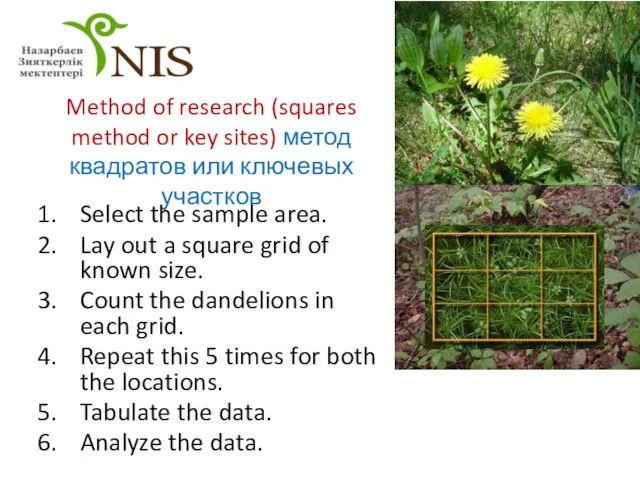
Method of research (squares method or key sites) метод квадратов или
Method of research (squares method or key sites) метод квадратов или

Data collection
Number of dandelions on the school garden
Data collection
Number of dandelions on the school garden

Step 1
Calculate the mean value
Step 1
Calculate the mean value

Step 2
Calculate the deviation from mean by subtracting the mean from
Step 2
Calculate the deviation from mean by subtracting the mean from

Step 3
Square the deviation from the mean for both the samples
Step 3
Square the deviation from the mean for both the samples

Step 4
Calculate the sum of the squares
Step 4
Calculate the sum of the squares


Step 5
Calculate the variance for both the samples
Step 5
Calculate the variance for both the samples


Step 6
calculate the value of T using the formula provided in
Step 6
calculate the value of T using the formula provided in
T –value
Х1 - среднее значение выборки 1
Х2 - среднее значение
T –value
Х1 - среднее значение выборки 1
Х2 - среднее значение
Answer
2,14
Answer
2,14
Step 7
Calculate the degree of freedom
Рассчитать степень свободы
df = (N1+ N2)
Step 7
Calculate the degree of freedom
Рассчитать степень свободы
df = (N1+ N2)

Step 8
Find the critical value using the t- table
Step 8
Find the critical value using the t- table
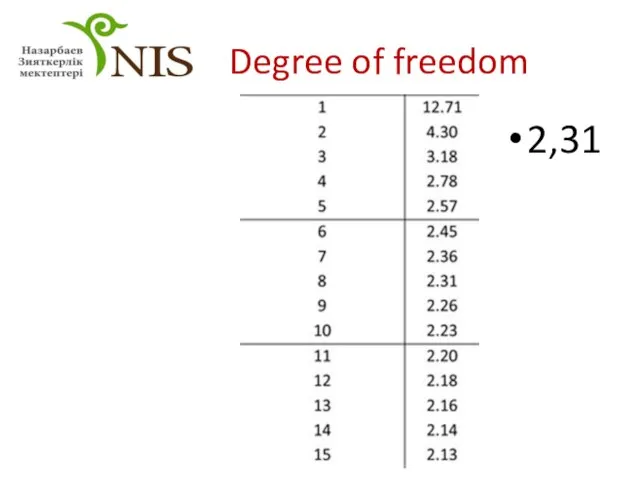
Degree of freedom
2,31
Degree of freedom
2,31
Data analysis
If the T-value is less than the critical value, then
Data analysis
If the T-value is less than the critical value, then

Analysis of results
If the null hypothesis is accepted, then there was
Analysis of results
If the null hypothesis is accepted, then there was
 Связь между сложением и вычитанием. Выше, ниже
 Свойства параллельных прямых
 Урок 6. Перколяционные процессы
 Сложение и вычитание положительных и отрицательных чисел. 6 класс
 Подготовка к ЕГЭ. Решение задач
 Основные геометрические приложения определенного интеграла
 Теорема Пифагора. Теорема в стихах
 Метод анализа иерархий. Методика метода МАИ
 Сфера и шар
 Построение графиков функции y = sinx и y = cosx
 Делитель. Делимое
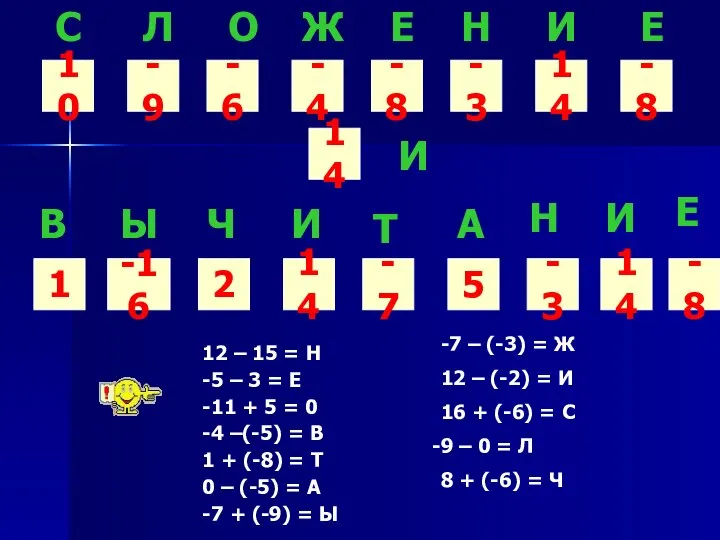 Сложение и вычитание
 Математический закон красоты мира Выполнила ученица 10 класса Сметанина Юлия
 Складання та виконання алгоритмів із розгалуженням
 Деревья. Построение дерева двоичного поиска
 Презентация по математике Вычитание натуральных чисел
  Элементы комбинаторики
 Удивительный мир Симметрии
 Шатровская Светлана Николаевна Г.Казань РТ МБОУ «СОШ№99»
  Тангенс и котангенс
 Построение и анализ частотных характеристик СУ
 РЕШЕНИЕ ТРИГОНОМЕТРИЧЕСКИХ УРАВНЕНИЙ НА ИНТЕРВАЛЕ. Урок № 18
  Прямые
 Игра для учащихся «Математический активизатор»
 Логика и алгебра высказываний
 Презентация к открытому уроку математики в 1 классе Тема: «Сложение и вычитание. Прибавить и вычесть 1».
  Сечение тетраэдра
 Площади геометрических фигур