- Basics of functions and their graphs

Содержание
- 2. Find the domain and range of a relation. Determine whether a relation is a function. Determine
- 3. Definition of a Relation A relation is any set of ordered pairs. The set of all
- 4. Example: Finding the Domain and Range of a Relation Find the domain and range of the
- 5. Definition of a Function A function is a correspondence from a first set, called the domain,
- 6. Example: Determining Whether a Relation is a Function Determine whether the relation is a function: {(1,
- 7. Functions as Equations If an equation is solved for y and more than one value of
- 8. Example: Determining Whether an Equation Represents a Function Determine whether the equation defines y as a
- 9. Function Notation The special notation f(x), read “f of x” or “f at x”, represents the
- 10. Example: Evaluating a Function If evaluate Thus,
- 11. Graphs of Functions The graph of a function is the graph of its ordered pairs.
- 12. Example: Graphing Functions Graph the functions f(x) = 2x and g(x) = 2x – 3 in
- 13. Example: Graphing Functions (continued) We set up a partial table of coordinates for each function. We
- 14. The Vertical Line Test for Functions If any vertical line intersects a graph in more than
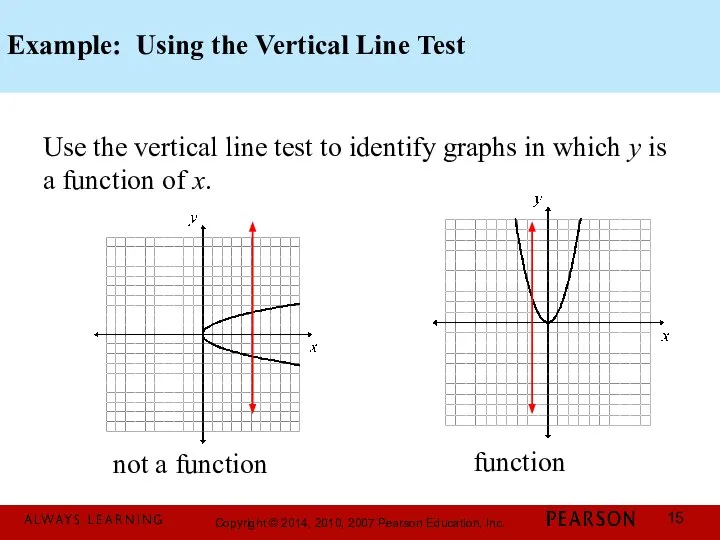
- 15. Example: Using the Vertical Line Test Use the vertical line test to identify graphs in which
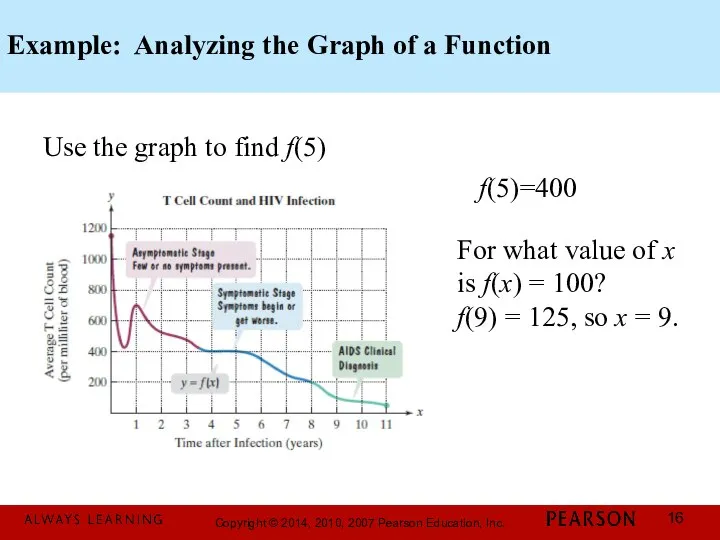
- 16. Example: Analyzing the Graph of a Function Use the graph to find f(5) For what value
- 17. Identifying Domain and Range from a Function’s Graph To find the domain of a function from
- 18. Example: Identifying the Domain and Range of a Function from Its Graph Use the graph of
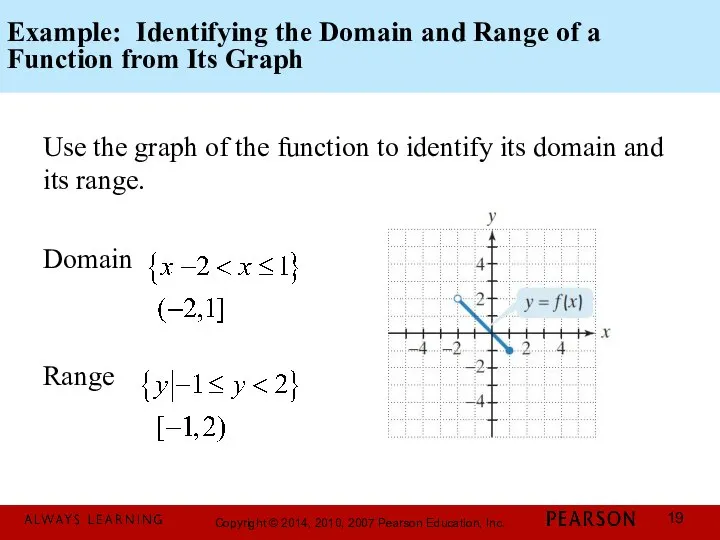
- 19. Example: Identifying the Domain and Range of a Function from Its Graph Use the graph of
- 20. Identifying Intercepts from a Function’s Graph To find the x-intercepts, look for the points at which
- 22. Скачать презентацию
Find the domain and range of a relation.
Determine whether a relation
Find the domain and range of a relation.
Determine whether a relation
Definition of a Relation
A relation is any set of ordered pairs.
Definition of a Relation
A relation is any set of ordered pairs.
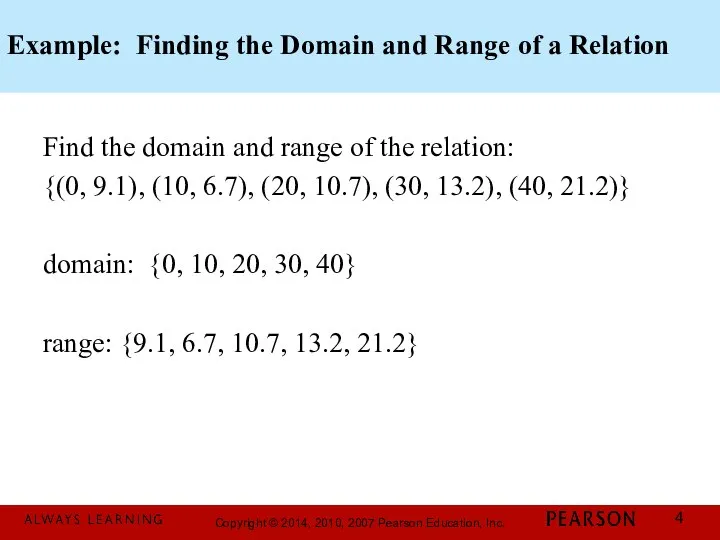
Example: Finding the Domain and Range of a Relation
Find the domain
Example: Finding the Domain and Range of a Relation
Find the domain
Definition of a Function
A function is a correspondence from a first
Definition of a Function
A function is a correspondence from a first
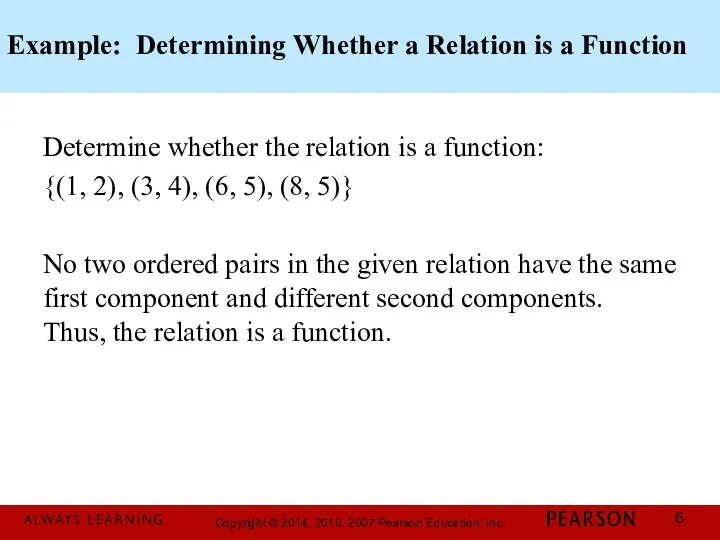
Example: Determining Whether a Relation is a Function
Determine whether the relation
Example: Determining Whether a Relation is a Function
Determine whether the relation
Functions as Equations
If an equation is solved for y and more
Functions as Equations
If an equation is solved for y and more
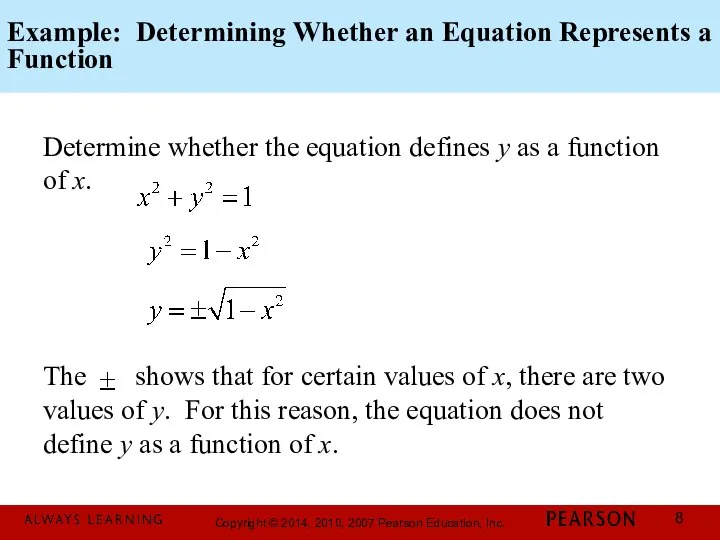
Example: Determining Whether an Equation Represents a Function
Determine whether the equation
Example: Determining Whether an Equation Represents a Function
Determine whether the equation
Function Notation
The special notation f(x), read “f of x” or “f
Function Notation
The special notation f(x), read “f of x” or “f
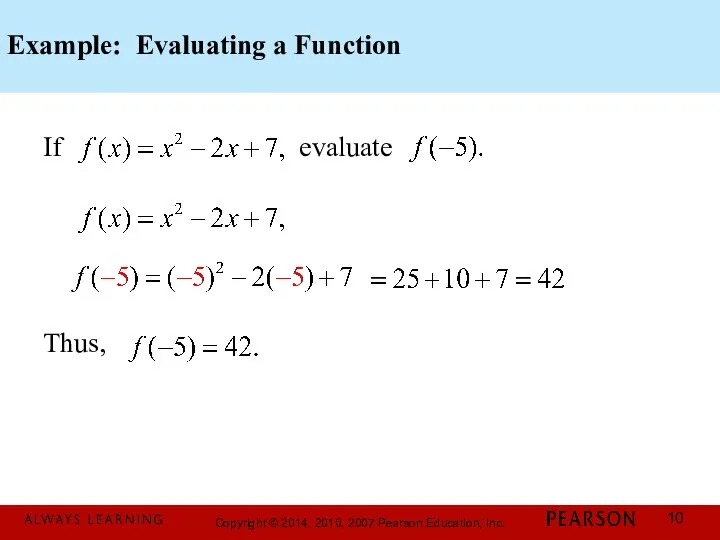
Example: Evaluating a Function
If evaluate
Thus,
Example: Evaluating a Function
If evaluate
Thus,
Graphs of Functions
The graph of a function is the graph of
Graphs of Functions
The graph of a function is the graph of
Example: Graphing Functions
Graph the functions f(x) = 2x and g(x) =
Example: Graphing Functions
Graph the functions f(x) = 2x and g(x) =
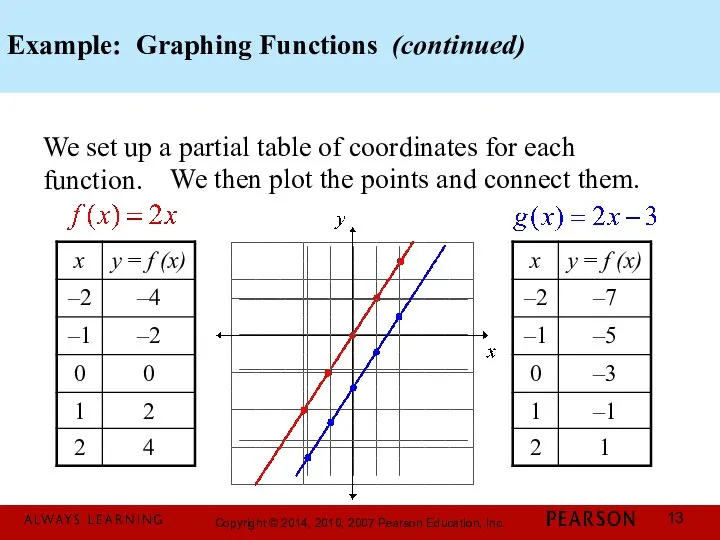
Example: Graphing Functions (continued)
We set up a partial table of coordinates
Example: Graphing Functions (continued)
We set up a partial table of coordinates
The Vertical Line Test for Functions
If any vertical line intersects a
The Vertical Line Test for Functions
If any vertical line intersects a
Example: Using the Vertical Line Test
Use the vertical line test to
Example: Using the Vertical Line Test
Use the vertical line test to
Example: Analyzing the Graph of a Function
Use the graph to
Example: Analyzing the Graph of a Function
Use the graph to
Identifying Domain and Range from a Function’s Graph
To find the domain
Identifying Domain and Range from a Function’s Graph
To find the domain
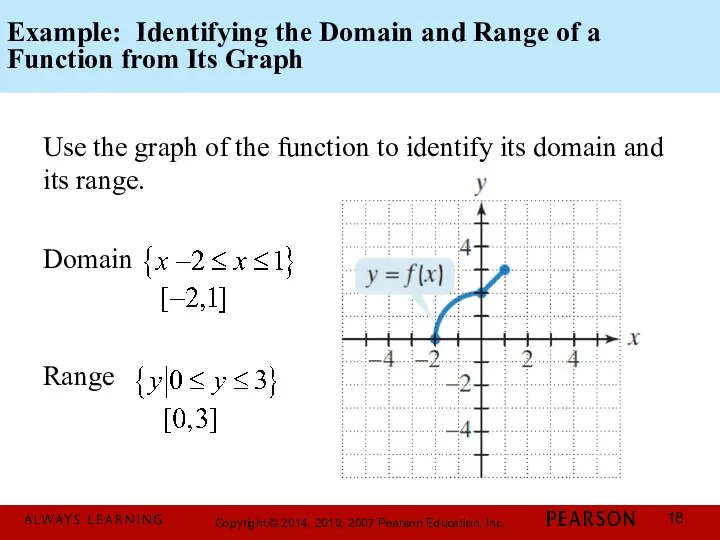
Example: Identifying the Domain and Range of a Function from Its
Example: Identifying the Domain and Range of a Function from Its
Example: Identifying the Domain and Range of a Function from Its
Example: Identifying the Domain and Range of a Function from Its
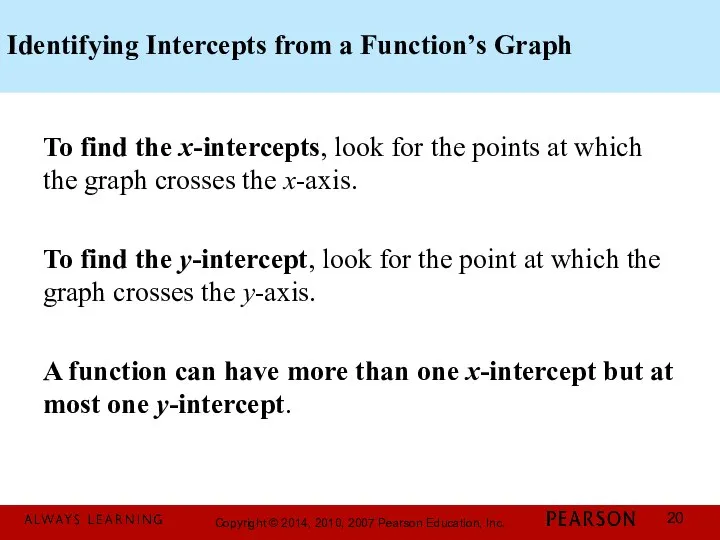
Identifying Intercepts from a Function’s Graph
To find the x-intercepts, look for
Identifying Intercepts from a Function’s Graph
To find the x-intercepts, look for
 Тела вращения
 Прямоугольный параллелепипед
 Цели урока: показать, как работать с памятью калькулятора
 Частотная таблица
 Параллельные прямые в пространстве
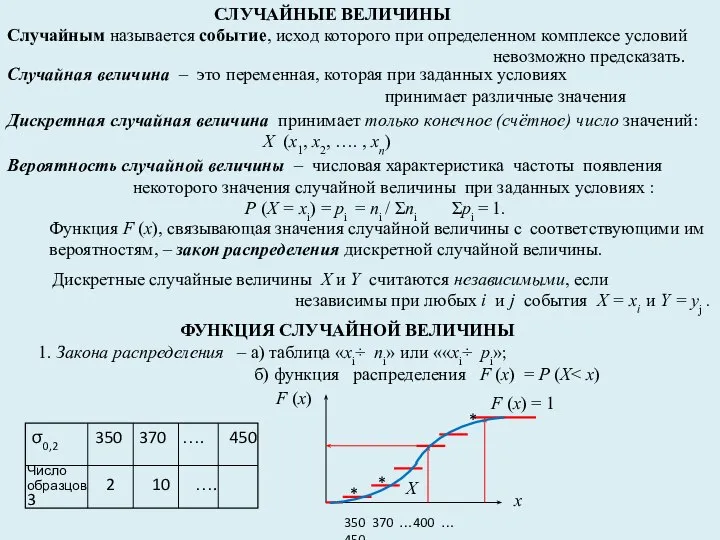 Случайные величины
 Координатная плоскость
 Математика - 6. Домашнее задание
 Математические модели числа
 Презентация по математике "Литр" - скачать бесплатно
 Окружность. Формулы окружности
 Способы решения уравнений высших степеней
 Биссектриса угла
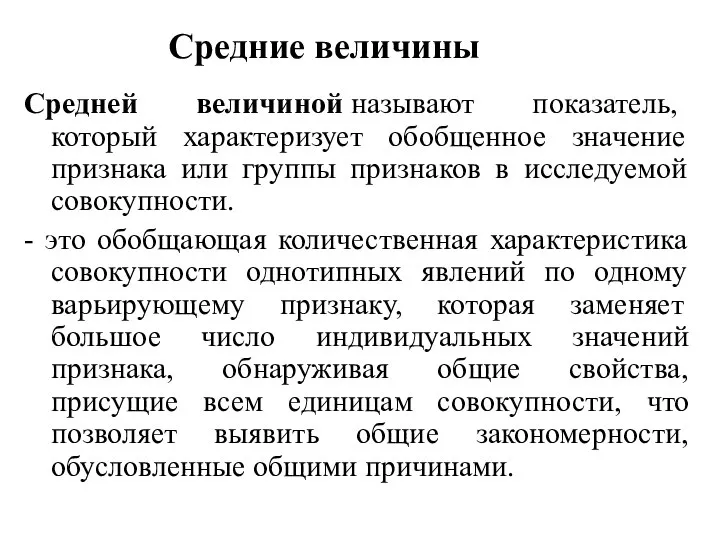 Средние величины
 Жүрек . Жүрек қан тамырлары
 Конечные автоматы. Абстрактные и структурные автоматы. Синтез конечных автоматов и МПА
 Дифференциальное исчисление функций одной переменной
 Понятие процента
 Логарифмические уравнения и приложен видеоурок
 Матрицы. Виды и действия над матрицами
 Процент. Знать и уметь находить
 Вейвлет-преобразование и его использование в рамках процедур обработки данных
 Признаки делимости на 3 и 9 (записываем № вопроса и выбранное число или слово)
 Оптимизация последовательности обработки деталей на двух станках
 Длина окружности и площадь круга
 Деление дробей
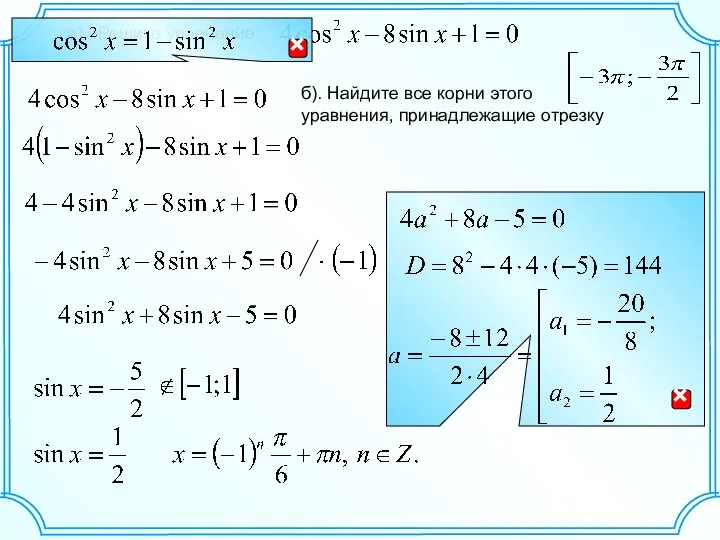 C1 20. Решить уравнение
 Умножение десятичных дробей. Устный счёт