- Confidence interval and Hypothesis testing for population mean (µ) when is known and n (large)

Содержание
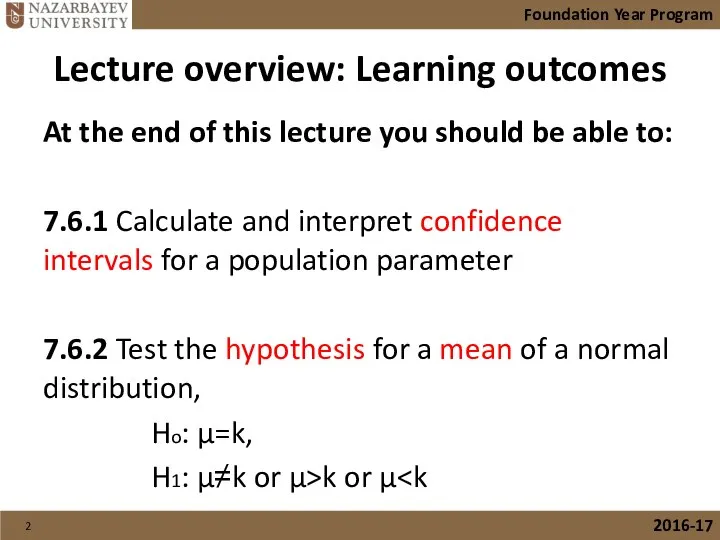
- 2. Lecture overview: Learning outcomes At the end of this lecture you should be able to: 7.6.1
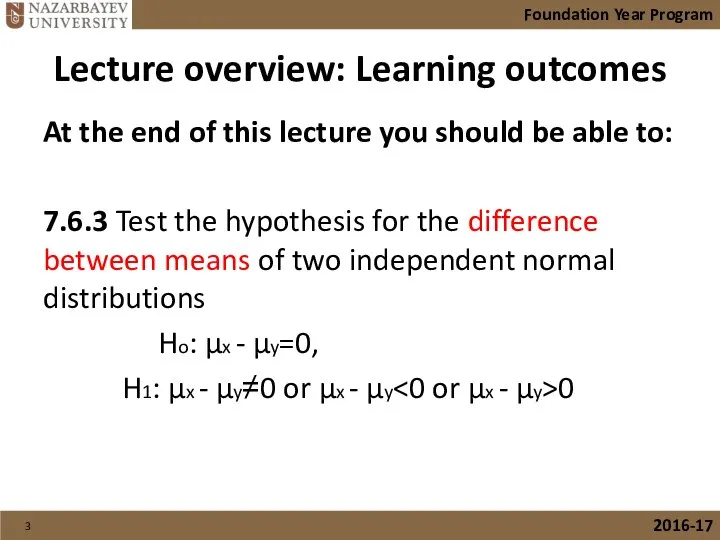
- 3. Lecture overview: Learning outcomes At the end of this lecture you should be able to: 7.6.3
- 4. Textbook Reference The content of this lecture is from the following textbook: Chapter 3 Statistics 3
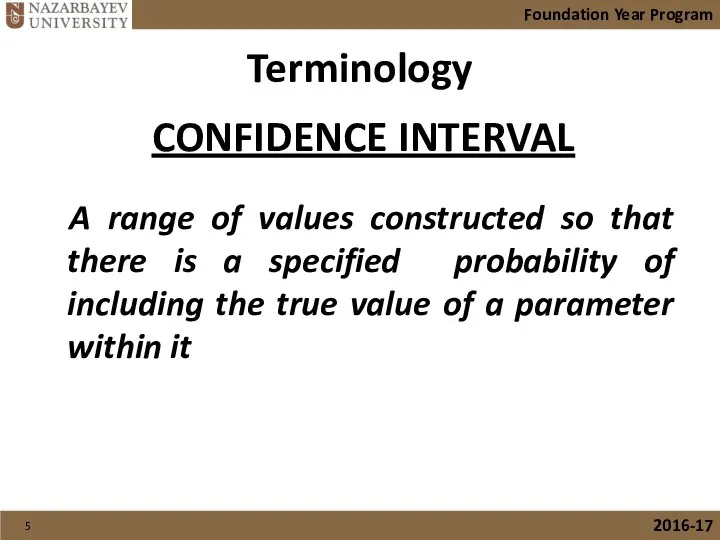
- 5. Terminology A range of values constructed so that there is a specified probability of including the
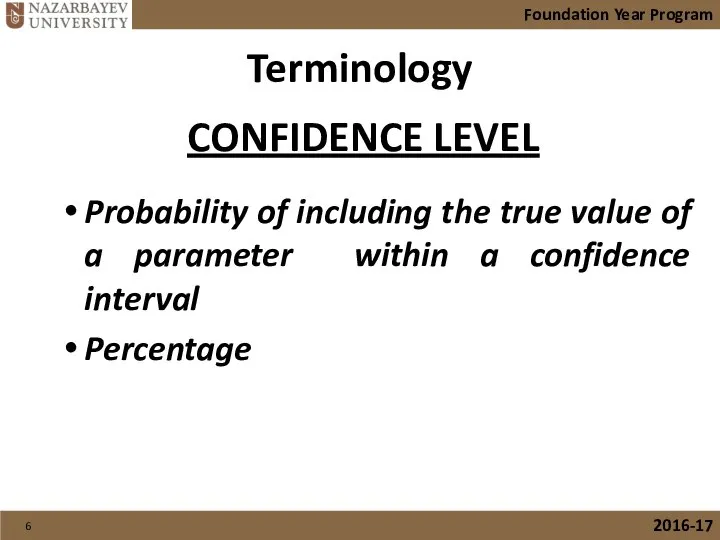
- 6. Terminology Probability of including the true value of a parameter within a confidence interval Percentage CONFIDENCE
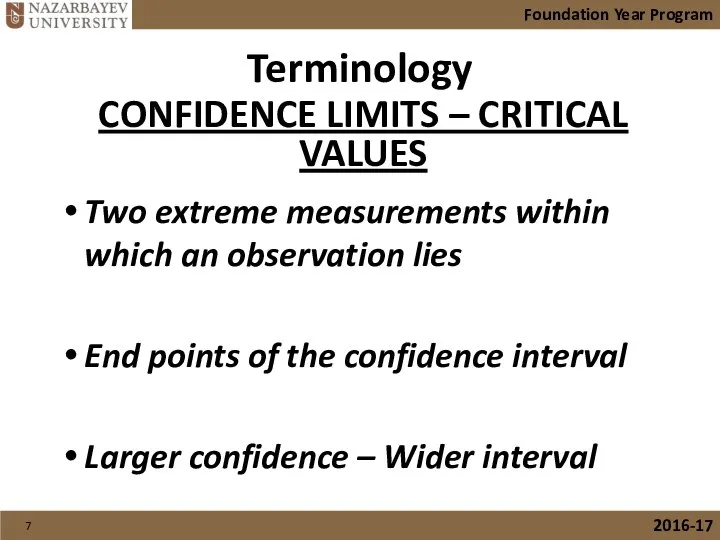
- 7. Terminology Two extreme measurements within which an observation lies End points of the confidence interval Larger
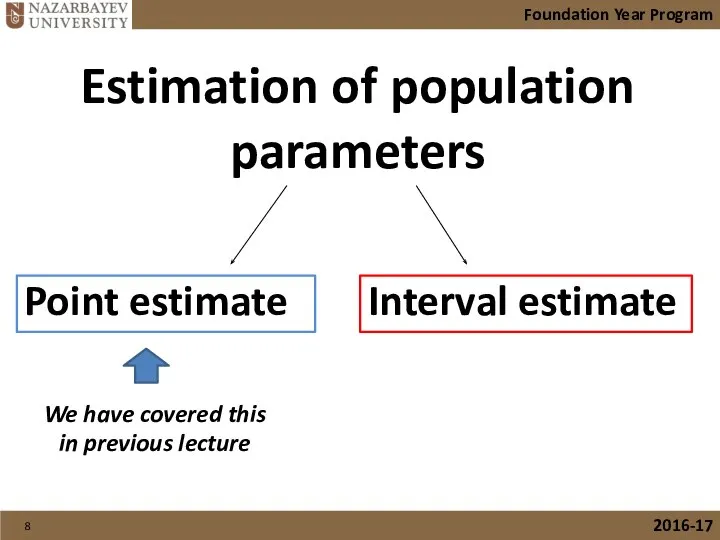
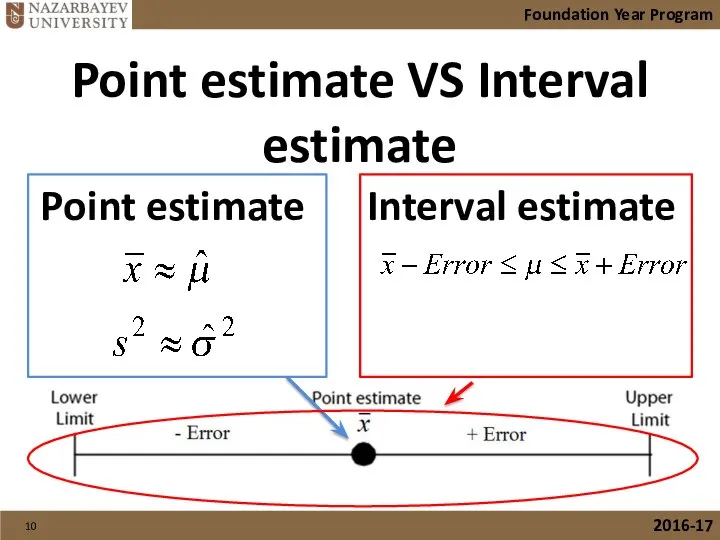
- 8. Estimation of population parameters Point estimate Interval estimate Foundation Year Program 2016-17 We have covered this
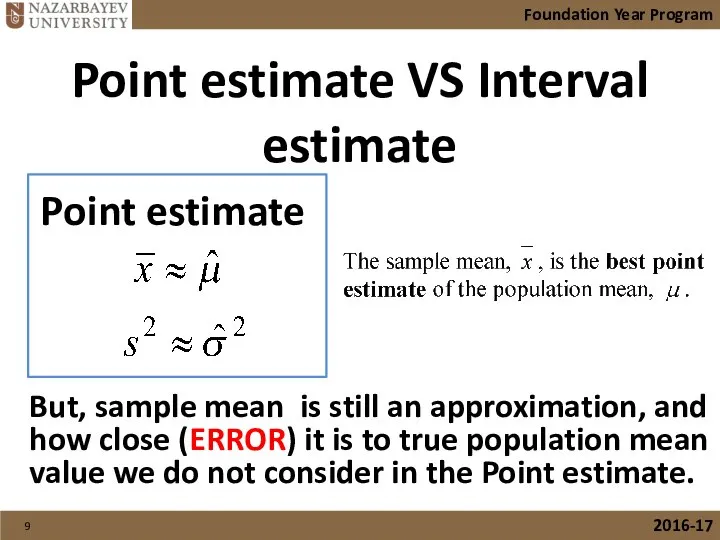
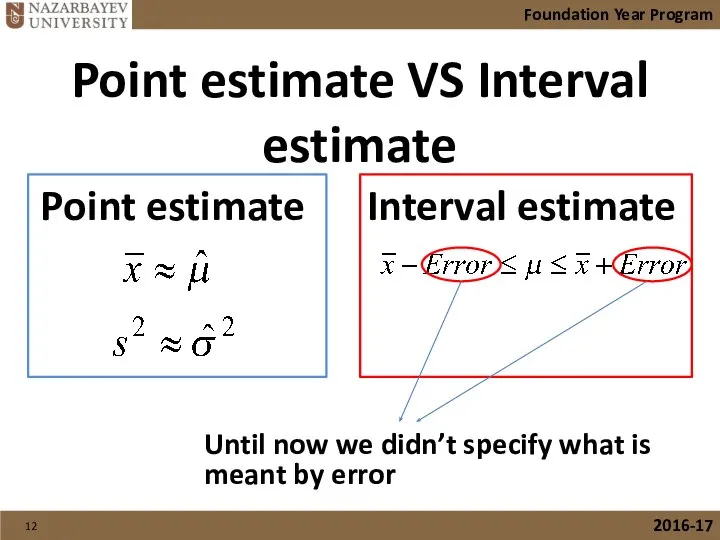
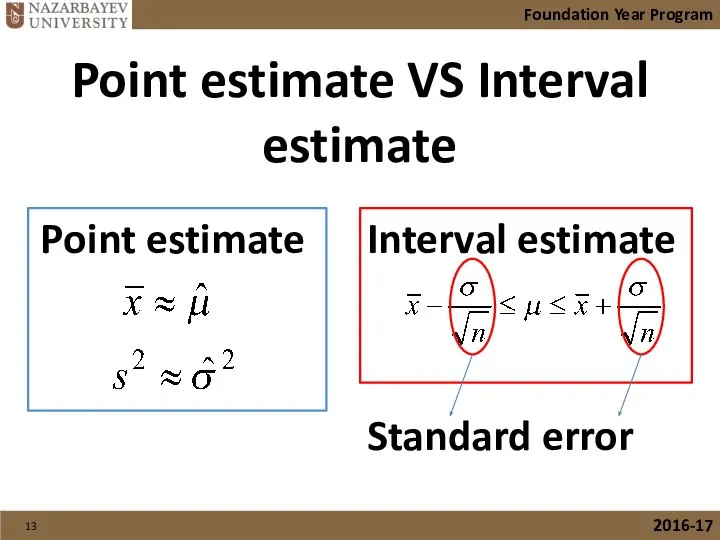
- 9. Point estimate VS Interval estimate Point estimate Foundation Year Program 2016-17 But, sample mean is still
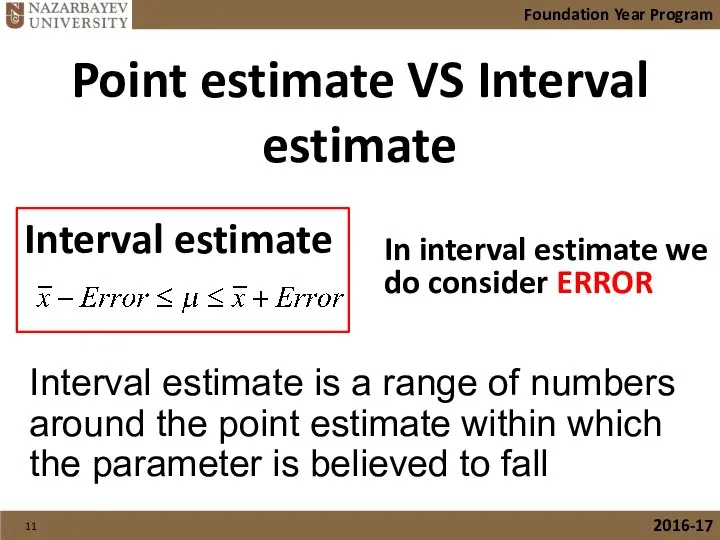
- 10. Point estimate VS Interval estimate Point estimate Foundation Year Program 2016-17 Interval estimate
- 11. Point estimate VS Interval estimate Foundation Year Program 2016-17 Interval estimate In interval estimate we do
- 12. Point estimate VS Interval estimate Point estimate Foundation Year Program 2016-17 Interval estimate Until now we
- 13. Point estimate VS Interval estimate Point estimate Foundation Year Program 2016-17 Interval estimate Standard error
- 14. 7.5.1 Calculate and interpret confidence intervals for a population parameter Interval estimate provides us interval within
- 15. The general formula for all confidence intervals are: Point Estimate ± (Critical Value) (Standard Error) 7.5.1
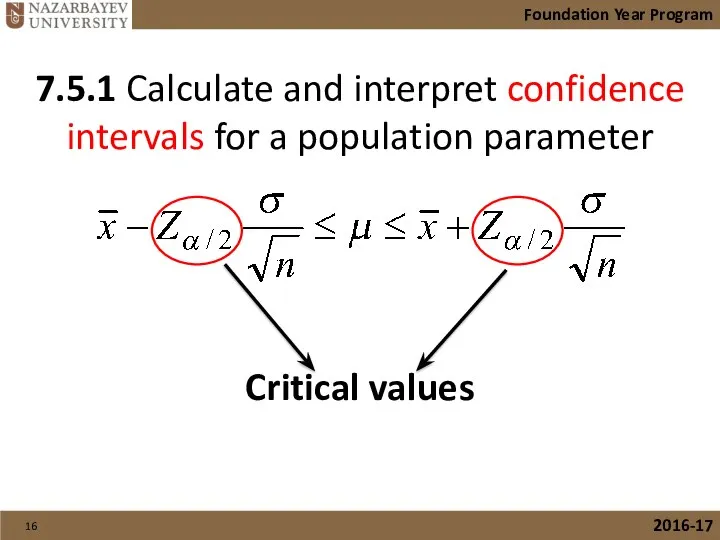
- 16. 7.5.1 Calculate and interpret confidence intervals for a population parameter Foundation Year Program 2016-17 Critical values
- 17. Empirical rule Foundation Year Program 2016-17
- 18. Empirical rule Foundation Year Program 2016-17
- 19. 95% Confidence Interval of the Mean Bluman, Chapter 7 Foundation Year Program 2016-17 ? ?
- 20. Common Levels of Confidence Bluman, Chapter 7 Foundation Year Program 2016-17
- 21. Formula for the Confidence Interval of the Mean for a Specific α Bluman, Chapter 7 Foundation
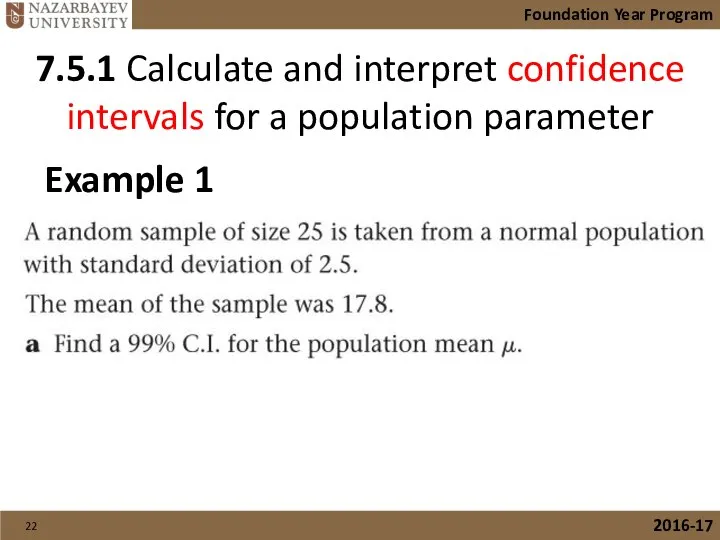
- 22. 7.5.1 Calculate and interpret confidence intervals for a population parameter Foundation Year Program 2016-17 Example 1
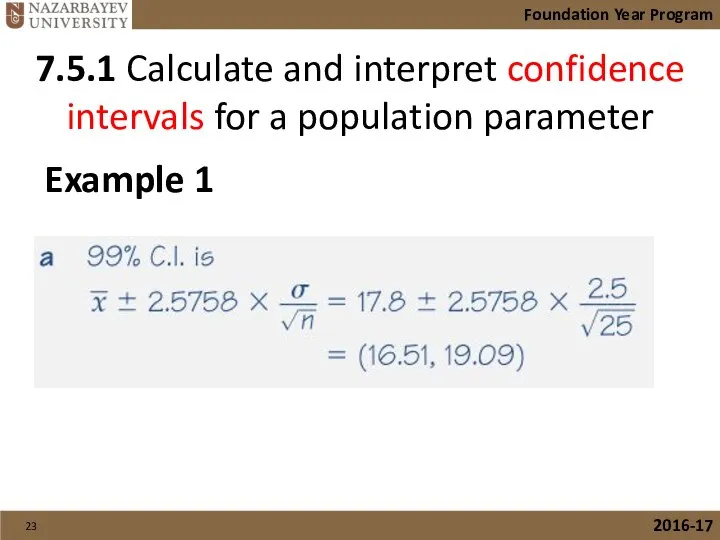
- 23. 7.5.1 Calculate and interpret confidence intervals for a population parameter Foundation Year Program 2016-17 Example 1
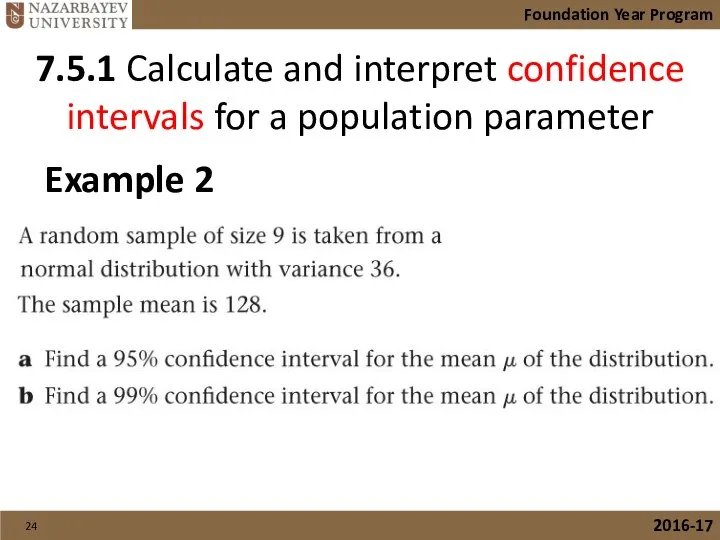
- 24. 7.5.1 Calculate and interpret confidence intervals for a population parameter Foundation Year Program 2016-17 Example 2
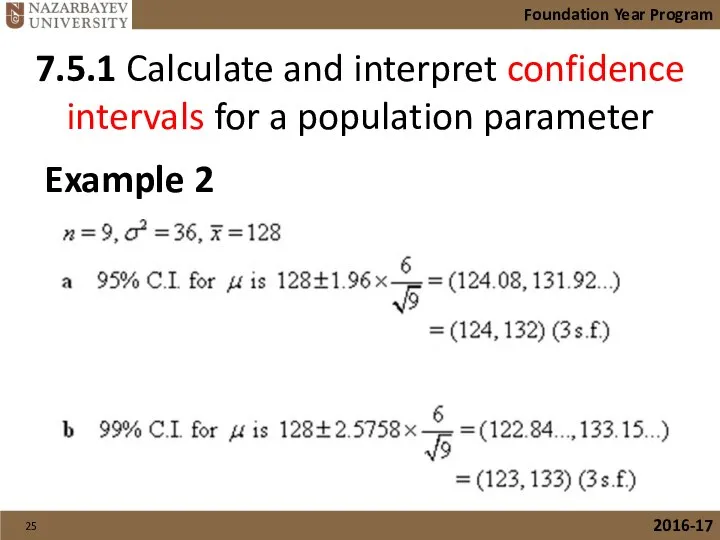
- 25. 7.5.1 Calculate and interpret confidence intervals for a population parameter Foundation Year Program 2016-17 Example 2
- 26. Hypothesis testing as well as estimation is a method used to reach a conclusion on population
- 27. In Hypothesis testing beside sample statistics level of significance (α) is used to make a meaningful
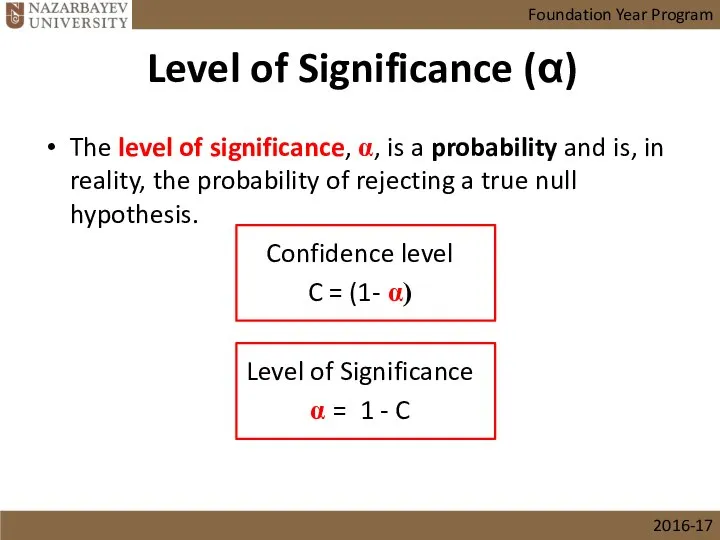
- 28. The level of significance, α, is a probability and is, in reality, the probability of rejecting
- 29. In Hypothesis testing we compare a sample statistic to a population parameter to see if there
- 30. 1. Hypothesis testing can be used to determine whether a statement about the value of a
- 31. 3. The alternative hypothesis, denoted by Ha, is the opposite of what is stated in the
- 32. Types of Hypothesis testing Null Hypothesis (H0) Alternative Hypothesis (Ha or H1) Each of the following
- 33. Step 1. Develop the null and alternative hypotheses. Step 2. Specify the level of significance α.
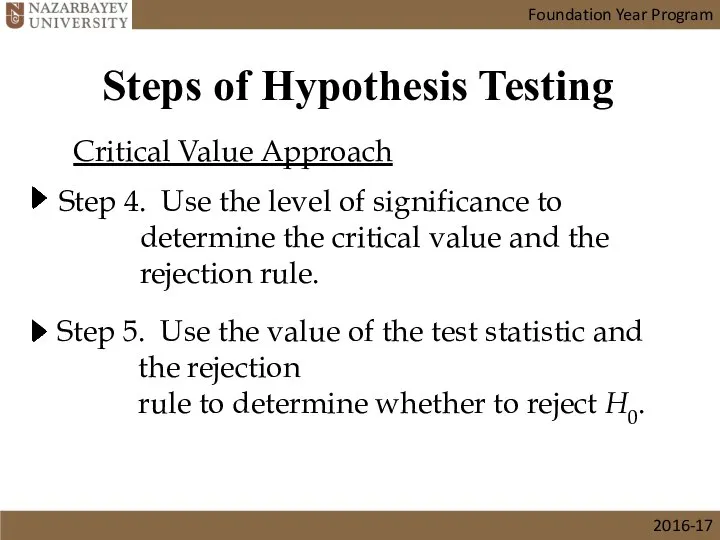
- 34. Foundation Year Program 2016-17 Steps of Hypothesis Testing Critical Value Approach Step 4. Use the level
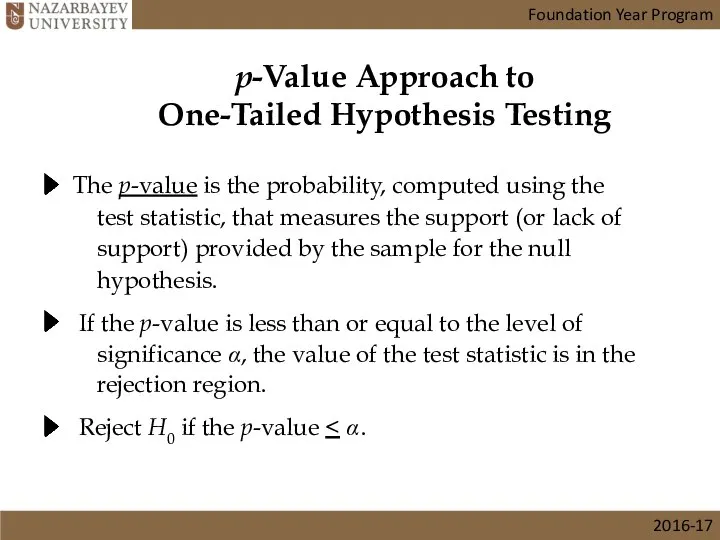
- 35. p-Value Approach to One-Tailed Hypothesis Testing Reject H0 if the p-value The p-value is the probability,
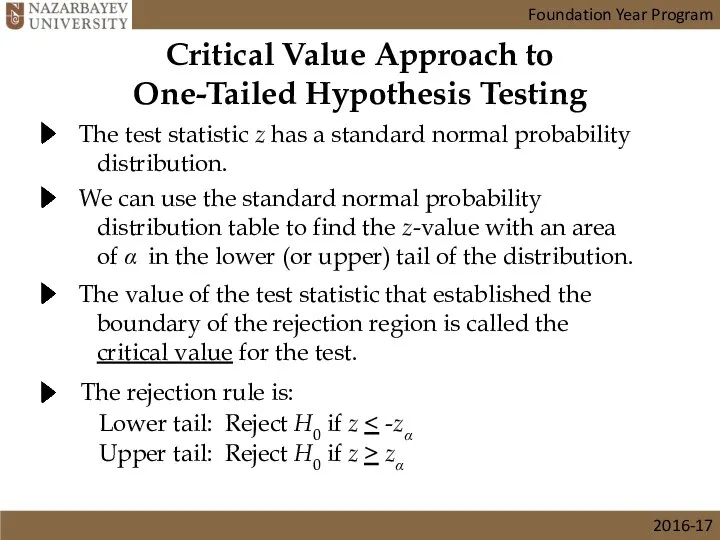
- 36. Critical Value Approach to One-Tailed Hypothesis Testing The test statistic z has a standard normal probability
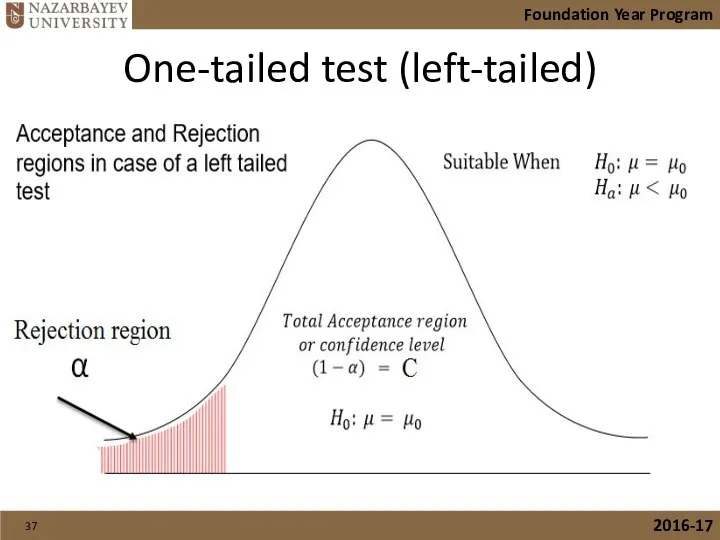
- 37. One-tailed test (left-tailed) Foundation Year Program 2016-17
- 38. One-tailed test (right-tailed) Foundation Year Program 2016-17
- 39. Two-tailed test Foundation Year Program 2016-17
- 40. 7.5.2 Test the hypothesis for a mean of a normal distribution, Ho: µ=k, H1: µ≠k or
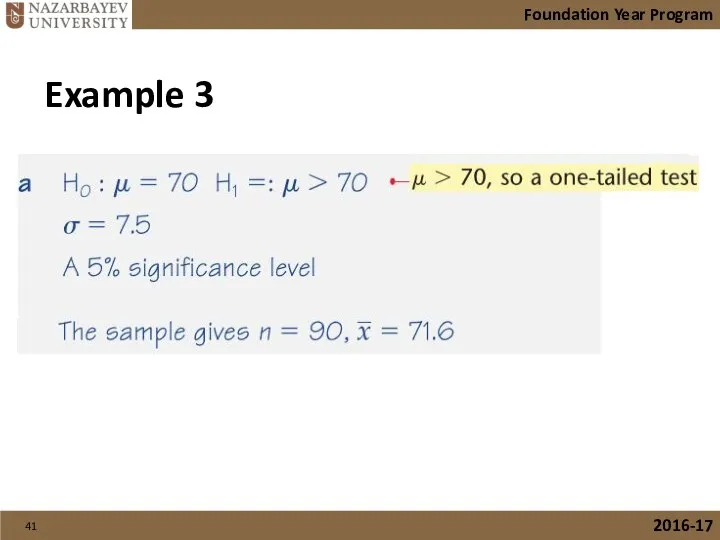
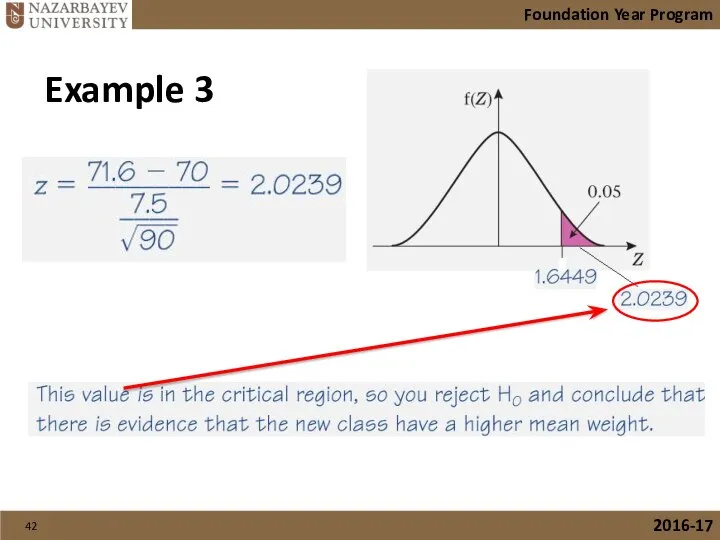
- 41. Foundation Year Program 2016-17 Example 3
- 42. Foundation Year Program 2016-17 Example 3
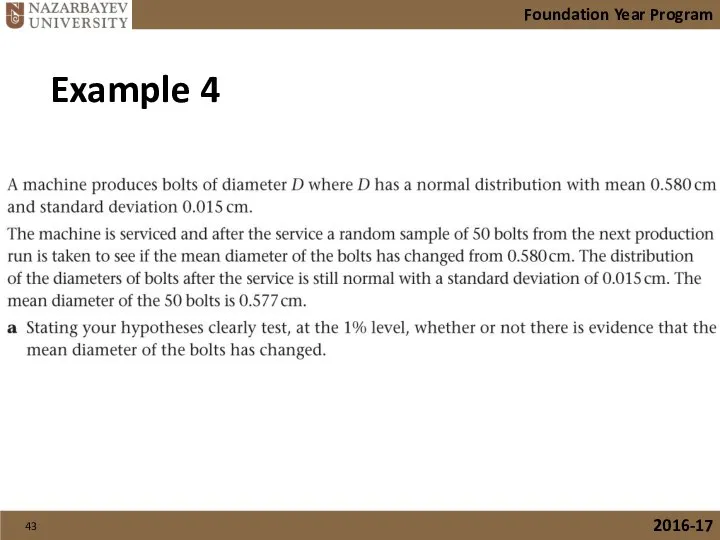
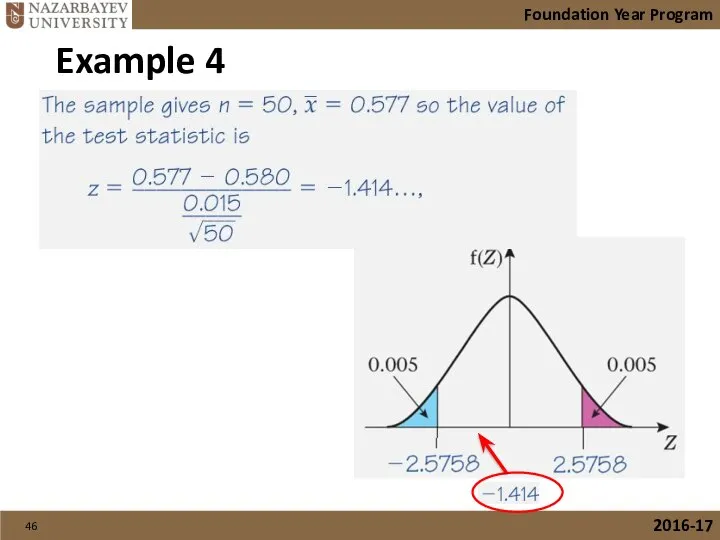
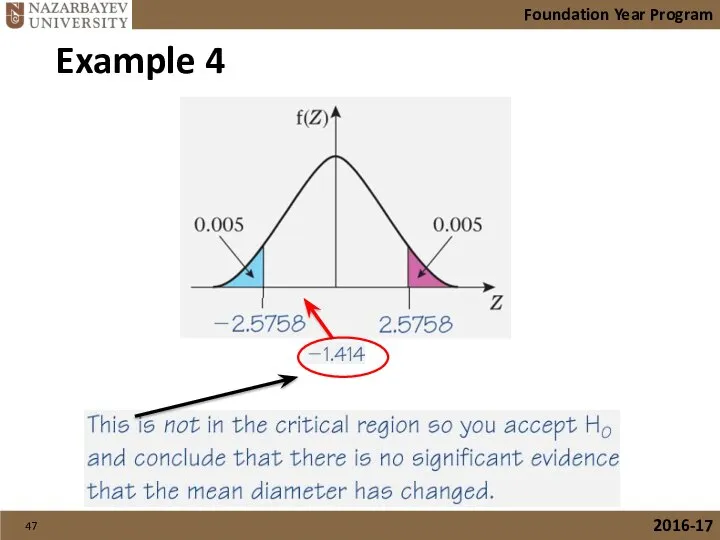
- 43. Foundation Year Program 2016-17 Example 4
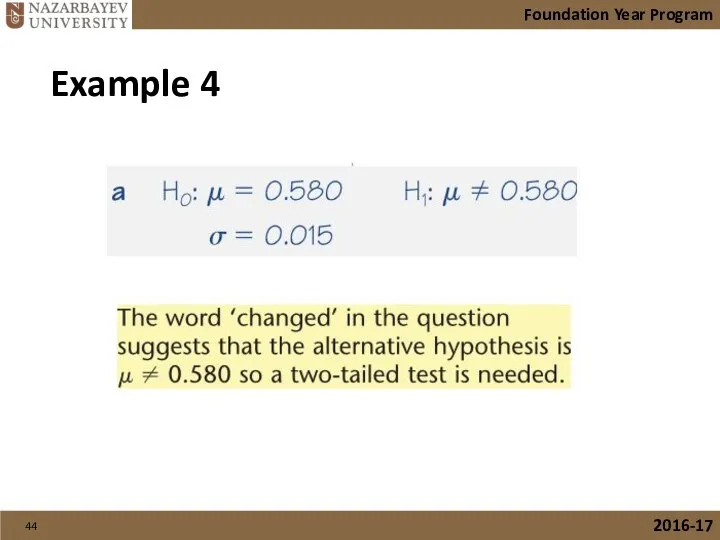
- 44. Foundation Year Program 2016-17 Example 4
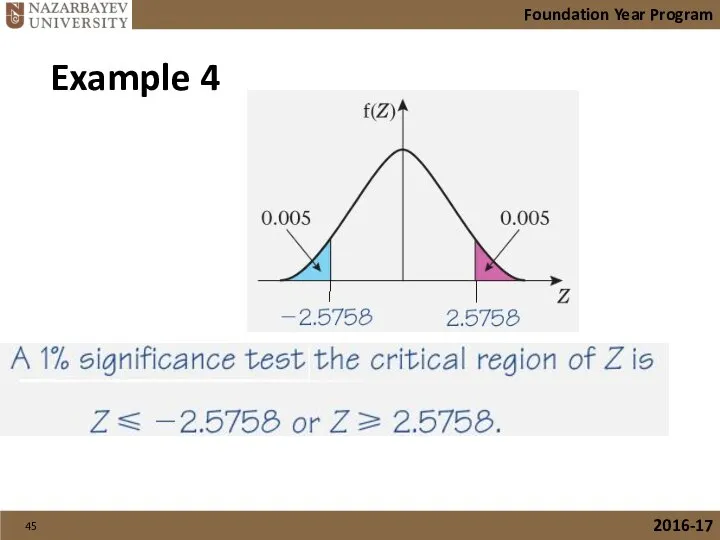
- 45. Foundation Year Program 2016-17 Example 4
- 46. Foundation Year Program 2016-17 Example 4
- 47. Foundation Year Program 2016-17 Example 4
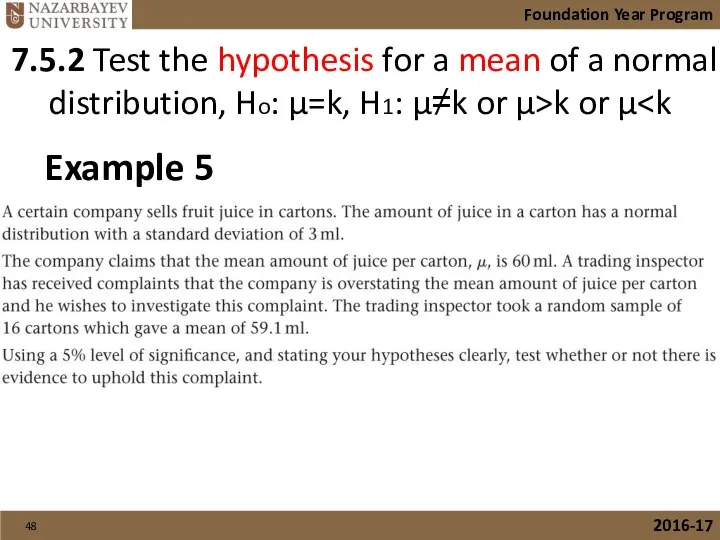
- 48. 7.5.2 Test the hypothesis for a mean of a normal distribution, Ho: µ=k, H1: µ≠k or
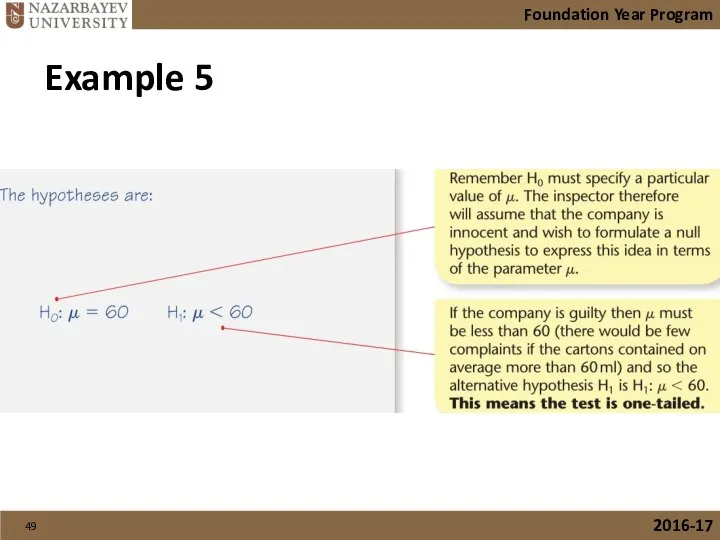
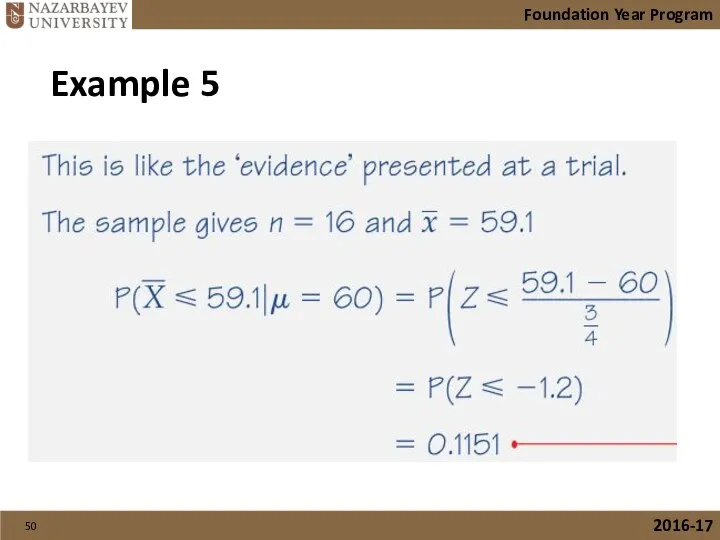
- 49. Foundation Year Program 2016-17 Example 5
- 50. Foundation Year Program 2016-17 Example 5
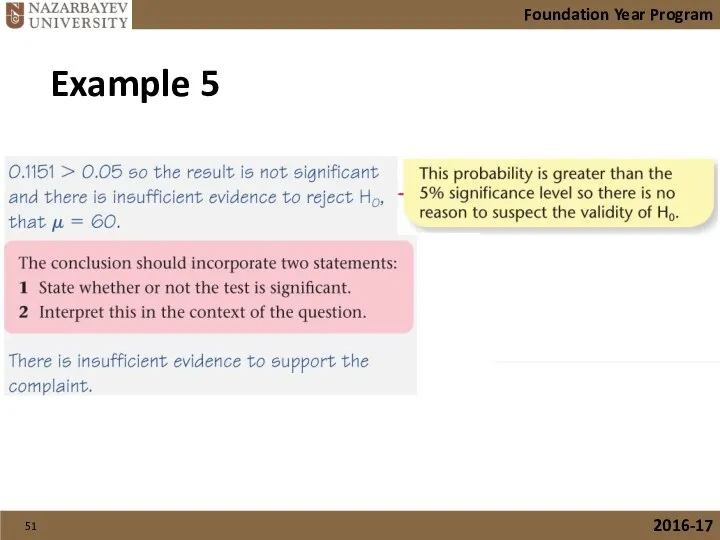
- 51. Foundation Year Program 2016-17 Example 5
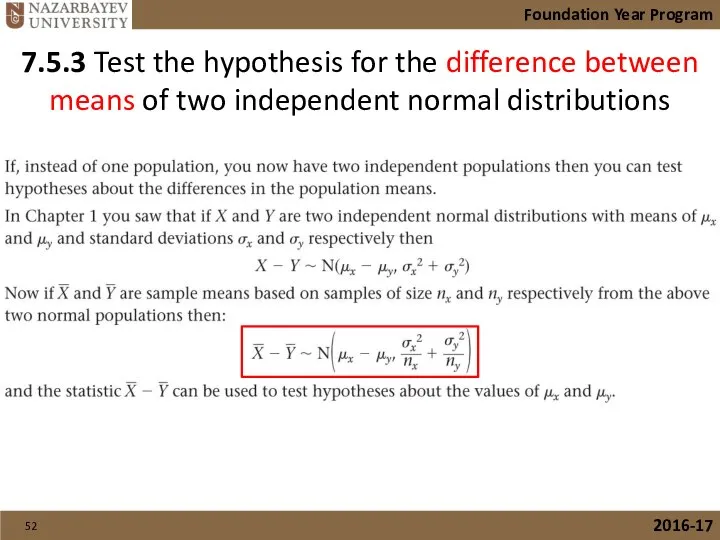
- 52. 7.5.3 Test the hypothesis for the difference between means of two independent normal distributions Foundation Year
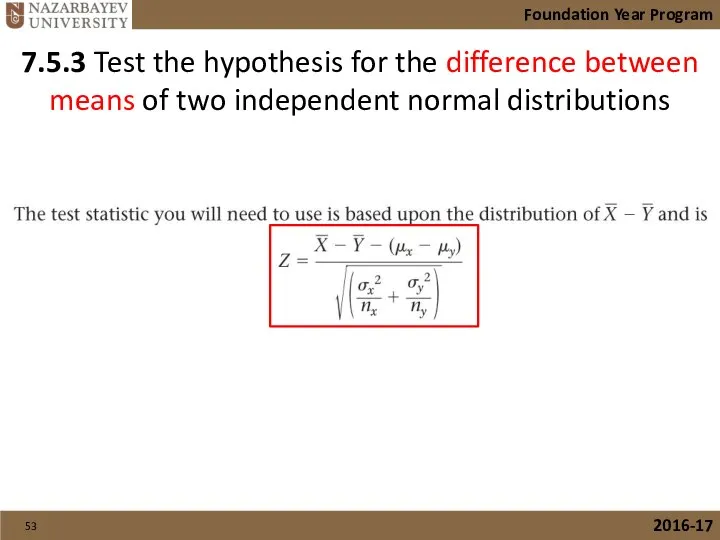
- 53. 7.5.3 Test the hypothesis for the difference between means of two independent normal distributions Foundation Year
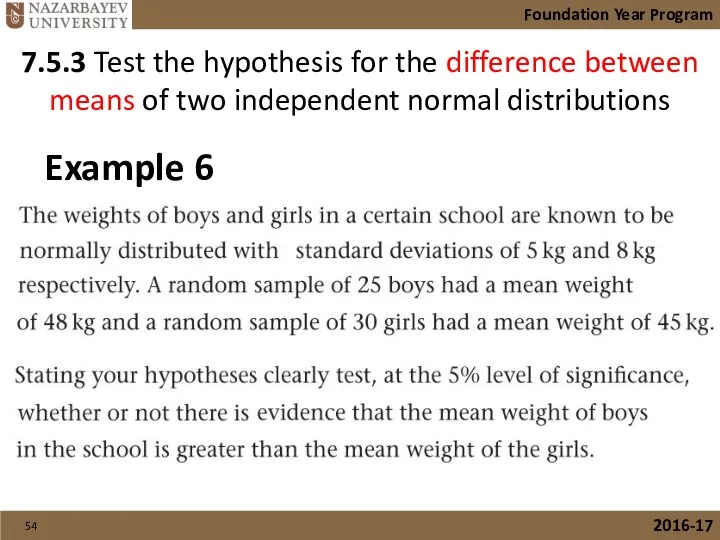
- 54. 7.5.3 Test the hypothesis for the difference between means of two independent normal distributions Foundation Year
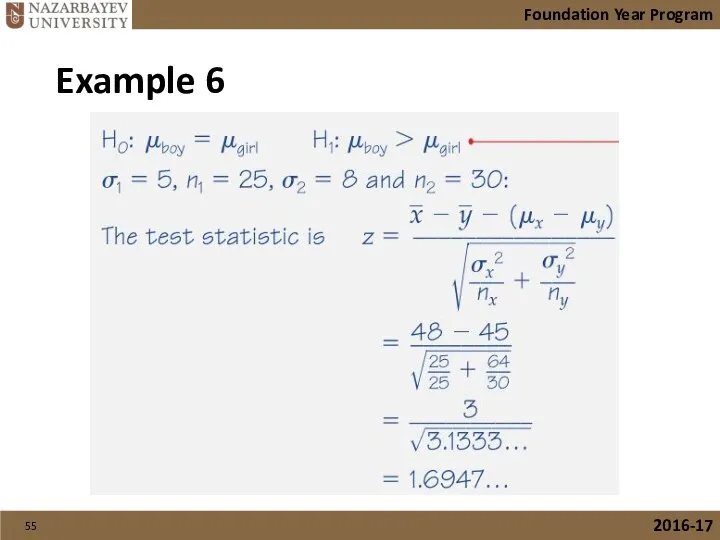
- 55. Foundation Year Program 2016-17 Example 6
- 57. Скачать презентацию
Lecture overview: Learning outcomes
At the end of this lecture you should
Lecture overview: Learning outcomes
At the end of this lecture you should
Lecture overview: Learning outcomes
At the end of this lecture you should
Lecture overview: Learning outcomes
At the end of this lecture you should
Textbook Reference
The content of this lecture is from the following textbook:
Chapter
Textbook Reference
The content of this lecture is from the following textbook:
Chapter
Terminology
A range of values constructed so that there is a
Terminology
A range of values constructed so that there is a
Terminology
Probability of including the true value of a parameter within a
Terminology
Probability of including the true value of a parameter within a
Terminology
Two extreme measurements within which an observation lies
End points of the
Terminology
Two extreme measurements within which an observation lies
End points of the
Estimation of population parameters
Point estimate Interval estimate
Foundation Year Program
2016-17
We have covered
Estimation of population parameters
Point estimate Interval estimate
Foundation Year Program
2016-17
We have covered
Point estimate VS Interval estimate
Point estimate
Foundation Year Program
2016-17
But, sample mean is
Point estimate VS Interval estimate
Point estimate
Foundation Year Program
2016-17
But, sample mean is
Point estimate VS Interval estimate
Point estimate
Foundation Year Program
2016-17
Interval estimate
Point estimate VS Interval estimate
Point estimate
Foundation Year Program
2016-17
Interval estimate
Point estimate VS Interval estimate
Foundation Year Program
2016-17
Interval estimate
In interval estimate we
Point estimate VS Interval estimate
Foundation Year Program
2016-17
Interval estimate
In interval estimate we
Point estimate VS Interval estimate
Point estimate
Foundation Year Program
2016-17
Interval estimate
Until now we
Point estimate VS Interval estimate
Point estimate
Foundation Year Program
2016-17
Interval estimate
Until now we
Point estimate VS Interval estimate
Point estimate
Foundation Year Program
2016-17
Interval estimate
Standard error
Point estimate VS Interval estimate
Point estimate
Foundation Year Program
2016-17
Interval estimate
Standard error
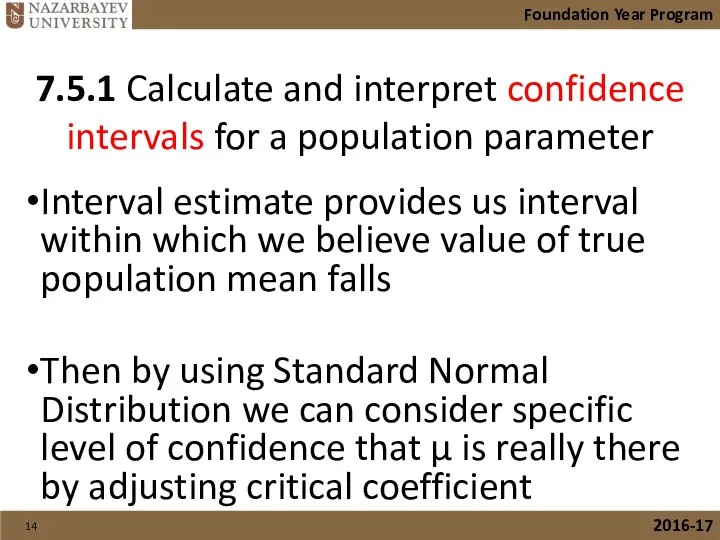
7.5.1 Calculate and interpret confidence intervals for a population parameter
Interval estimate
7.5.1 Calculate and interpret confidence intervals for a population parameter
Interval estimate
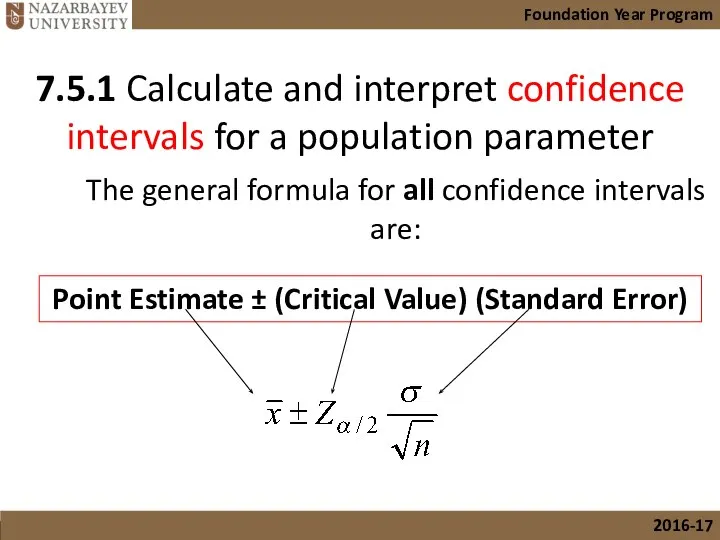
The general formula for all confidence intervals are:
Point Estimate ± (Critical
The general formula for all confidence intervals are:
Point Estimate ± (Critical
7.5.1 Calculate and interpret confidence intervals for a population parameter
Foundation Year
7.5.1 Calculate and interpret confidence intervals for a population parameter
Foundation Year
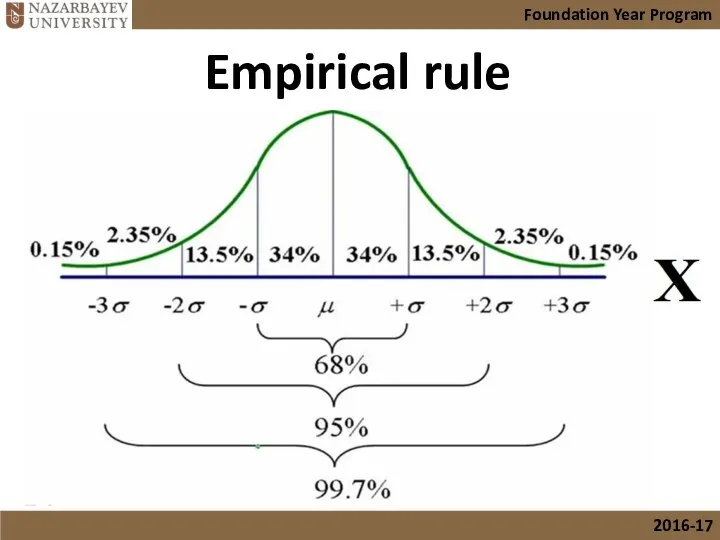
Empirical rule
Foundation Year Program
2016-17
Empirical rule
Foundation Year Program
2016-17
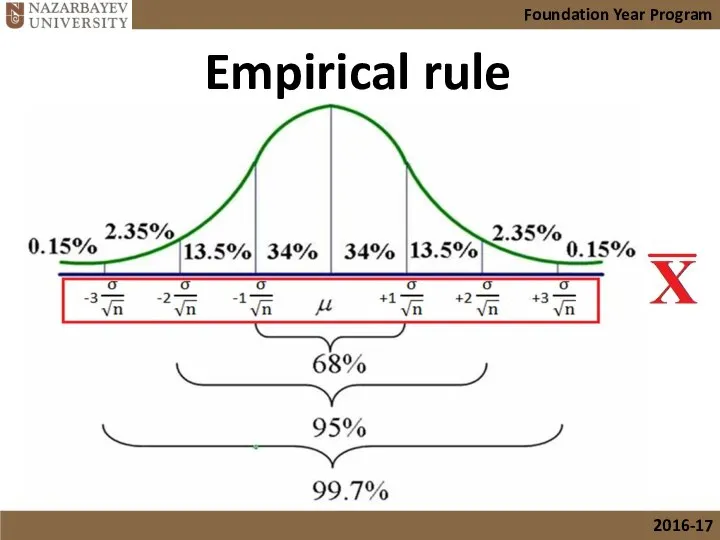
Empirical rule
Foundation Year Program
2016-17
Empirical rule
Foundation Year Program
2016-17
95% Confidence Interval of the Mean
Bluman, Chapter 7
Foundation Year Program
2016-17
?
?
95% Confidence Interval of the Mean
Bluman, Chapter 7
Foundation Year Program
2016-17
?
?
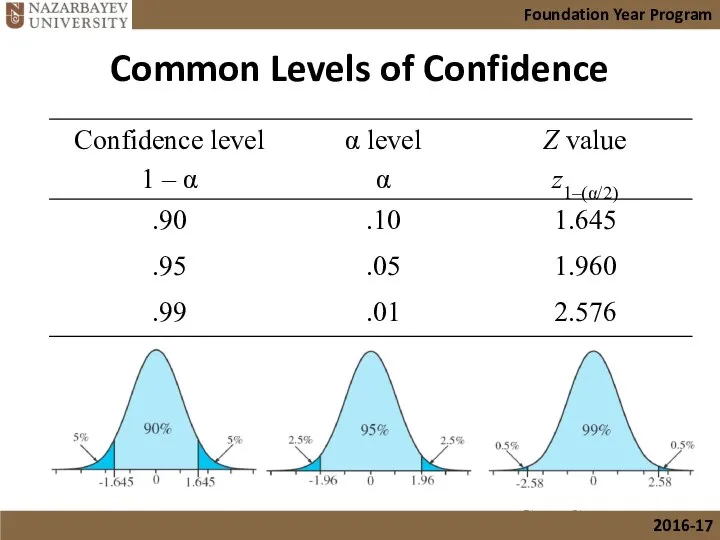
Common Levels of Confidence
Bluman, Chapter 7
Foundation Year Program
2016-17
Common Levels of Confidence
Bluman, Chapter 7
Foundation Year Program
2016-17
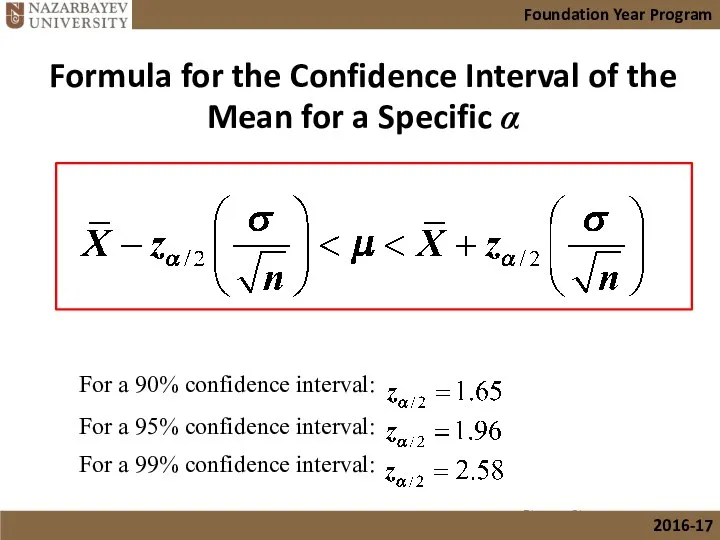
Formula for the Confidence Interval of the Mean for a Specific
Formula for the Confidence Interval of the Mean for a Specific
7.5.1 Calculate and interpret confidence intervals for a population parameter
Foundation Year
7.5.1 Calculate and interpret confidence intervals for a population parameter
Foundation Year
7.5.1 Calculate and interpret confidence intervals for a population parameter
Foundation Year
7.5.1 Calculate and interpret confidence intervals for a population parameter
Foundation Year
7.5.1 Calculate and interpret confidence intervals for a population parameter
Foundation Year
7.5.1 Calculate and interpret confidence intervals for a population parameter
Foundation Year
7.5.1 Calculate and interpret confidence intervals for a population parameter
Foundation Year
7.5.1 Calculate and interpret confidence intervals for a population parameter
Foundation Year
Hypothesis testing as well as estimation is a method used to
Hypothesis testing as well as estimation is a method used to
In Hypothesis testing beside sample statistics level of significance (α) is
In Hypothesis testing beside sample statistics level of significance (α) is
The level of significance, α, is a probability and is, in
The level of significance, α, is a probability and is, in
In Hypothesis testing we compare a sample statistic to a population
In Hypothesis testing we compare a sample statistic to a population
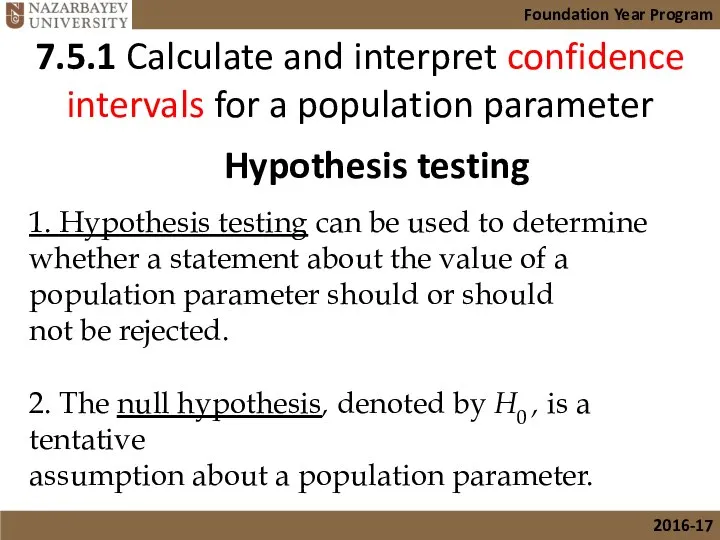
1. Hypothesis testing can be used to determine
whether a statement
1. Hypothesis testing can be used to determine
whether a statement
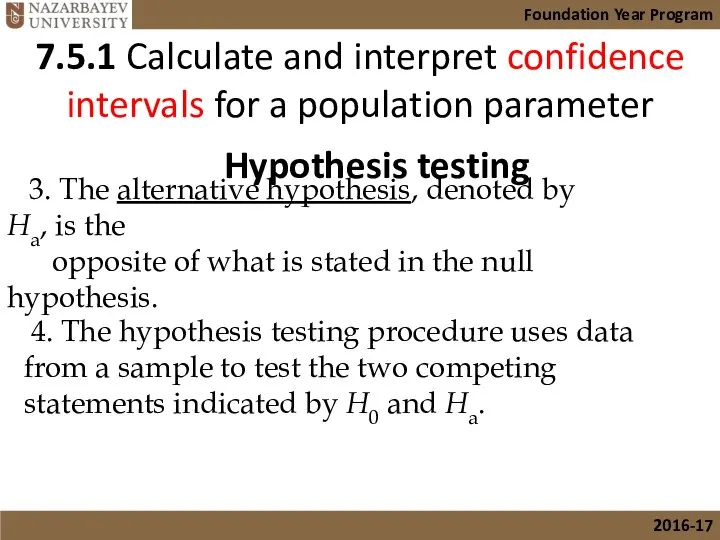
3. The alternative hypothesis, denoted by Ha, is the
opposite
3. The alternative hypothesis, denoted by Ha, is the
opposite
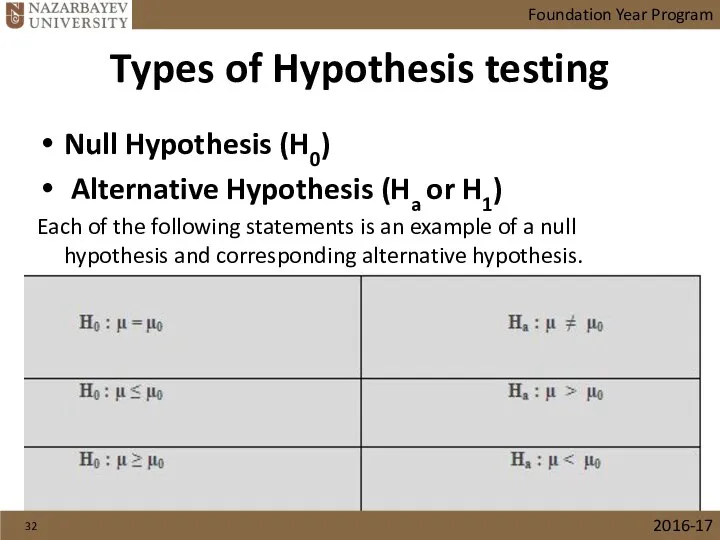
Types of Hypothesis testing
Null Hypothesis (H0)
Alternative Hypothesis (Ha or
Types of Hypothesis testing
Null Hypothesis (H0)
Alternative Hypothesis (Ha or
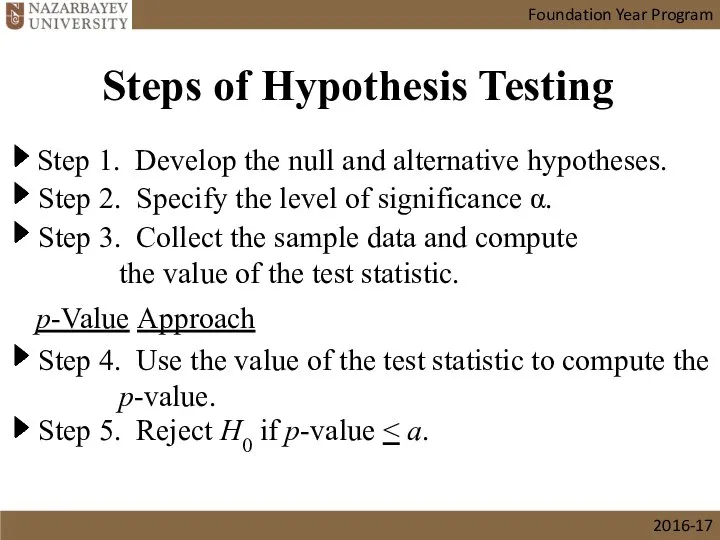
Step 1. Develop the null and alternative hypotheses.
Step 2. Specify the
Step 1. Develop the null and alternative hypotheses.
Step 2. Specify the
Foundation Year Program
2016-17
Steps of Hypothesis Testing
Critical Value Approach
Step 4. Use the
Foundation Year Program
2016-17
Steps of Hypothesis Testing
Critical Value Approach
Step 4. Use the
p-Value Approach to
One-Tailed Hypothesis Testing
Reject H0 if the p-value <
p-Value Approach to
One-Tailed Hypothesis Testing
Reject H0 if the p-value <
Critical Value Approach to
One-Tailed Hypothesis Testing
The test statistic z
Critical Value Approach to
One-Tailed Hypothesis Testing
The test statistic z
One-tailed test (left-tailed)
Foundation Year Program
2016-17
One-tailed test (left-tailed)
Foundation Year Program
2016-17
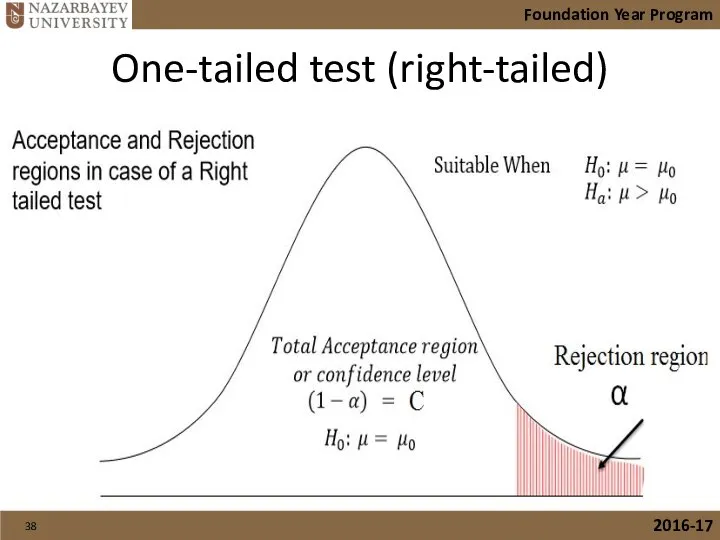
One-tailed test (right-tailed)
Foundation Year Program
2016-17
One-tailed test (right-tailed)
Foundation Year Program
2016-17
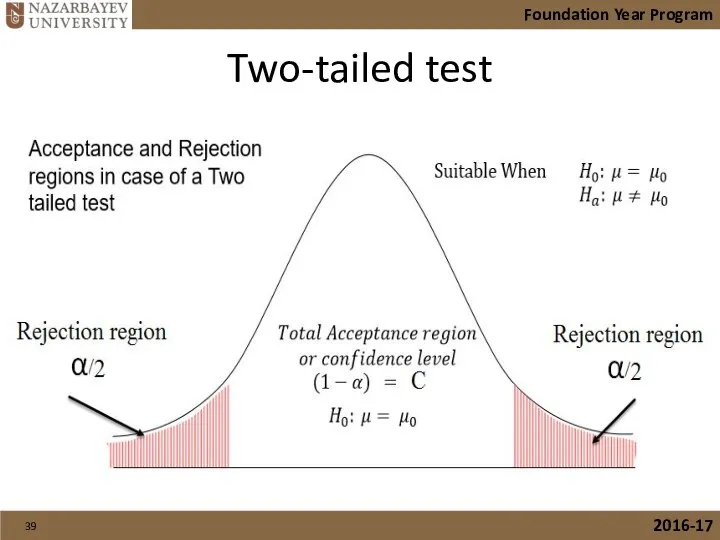
Two-tailed test
Foundation Year Program
2016-17
Two-tailed test
Foundation Year Program
2016-17
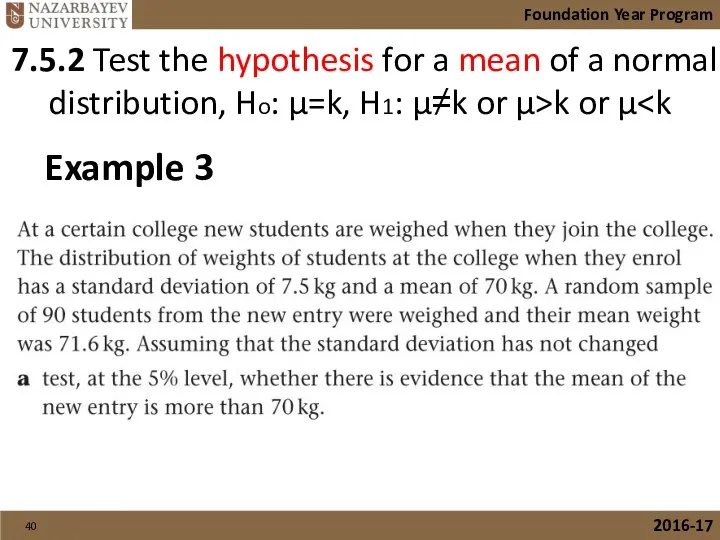
7.5.2 Test the hypothesis for a mean of a normal distribution,
7.5.2 Test the hypothesis for a mean of a normal distribution,
Foundation Year Program
2016-17
Example 3
Foundation Year Program
2016-17
Example 3
Foundation Year Program
2016-17
Example 3
Foundation Year Program
2016-17
Example 3
Foundation Year Program
2016-17
Example 4
Foundation Year Program
2016-17
Example 4
Foundation Year Program
2016-17
Example 4
Foundation Year Program
2016-17
Example 4
Foundation Year Program
2016-17
Example 4
Foundation Year Program
2016-17
Example 4
Foundation Year Program
2016-17
Example 4
Foundation Year Program
2016-17
Example 4
Foundation Year Program
2016-17
Example 4
Foundation Year Program
2016-17
Example 4
7.5.2 Test the hypothesis for a mean of a normal distribution,
7.5.2 Test the hypothesis for a mean of a normal distribution,
Foundation Year Program
2016-17
Example 5
Foundation Year Program
2016-17
Example 5
Foundation Year Program
2016-17
Example 5
Foundation Year Program
2016-17
Example 5
Foundation Year Program
2016-17
Example 5
Foundation Year Program
2016-17
Example 5
7.5.3 Test the hypothesis for the difference between means of two
7.5.3 Test the hypothesis for the difference between means of two
7.5.3 Test the hypothesis for the difference between means of two
7.5.3 Test the hypothesis for the difference between means of two
7.5.3 Test the hypothesis for the difference between means of two
7.5.3 Test the hypothesis for the difference between means of two
Foundation Year Program
2016-17
Example 6
Foundation Year Program
2016-17
Example 6
 Деление с остатком
 Построение графиков функций
 Центральная симметрия
 Окружность и круг (1)
 Палочки Кюизенера. Цветные счетные палочки для детей 3-5 лет
 Математика. Задания на лето. Часть 6
 Группировка слагаемых. Скобки 1 класс ПНШ
  Звёздный час в математике
 Задачи для повторения математики 6 класс Артамонова Л.В., учитель математики МКОУ «Москаленский лицей»
 Исчисление высказываний
 Линейное уравнение с одной переменной 25у - 10 = 0. 7 класс
 Пирамида. Применение логических законов в решении логических содержательных задач
 Лекция RAISE Specification Language: базовые типы, логика, декартовы произведения, множества и операции с множествами
  Обобщение и систематизация знаний и умений решения линейных уравнений с одной переменной в 7 классе
 Готовимся к ВПР по математике
 Автор: Дробаха О.В., учитель гимназии №4 г. Мурманска
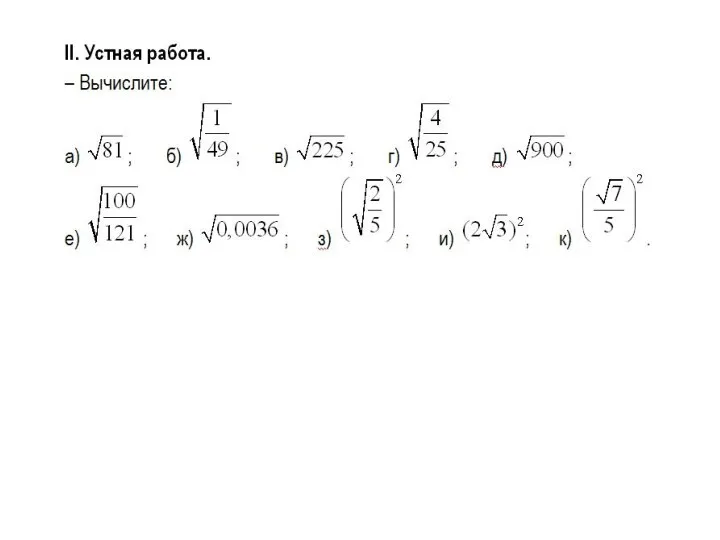 Вычисление дробей. Устная работа
 Основные понятия тригонометрии
 Проект. Задачник в открытках «Математика - география»
 Задания для подготовки к ГИА по математике
 ГИА - 2016. Открытый банк заданий по математике. Задача №15
 Правильные многоугольники в природе
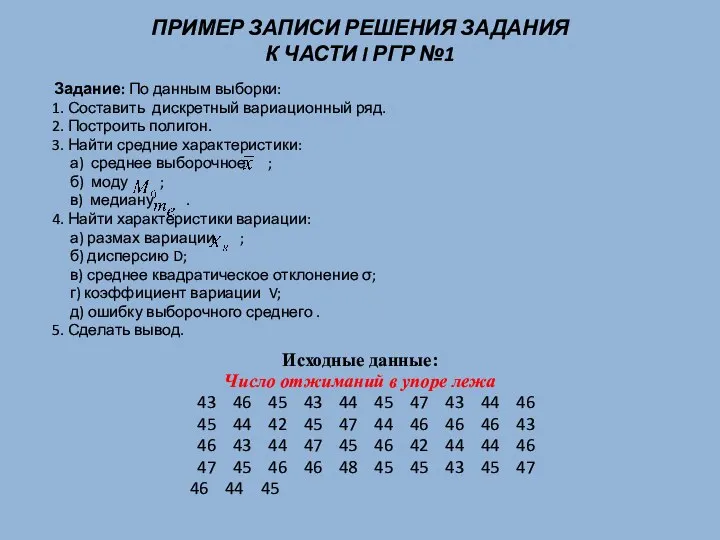 Пример записи решения задания к Части I РГР №1
 Уравнения. Решение задач с помощью уравнений
 Возникновение и развитие геометрии
 Многомерные случайные величины
 Свойства действий с рациональными числами
 Космос