- Management methodology in Technosphere safety

Содержание
- 2. Technosphere The anthroposphere (sometimes also referred as technosphere) is that part of the environment that is
- 3. Technosphere Safety in Russia Labor safety Occupational safety and health Assessment of working conditions Safety management
- 4. Unified technology 4 Main idea: the results of decisions taken do not justify the expectation of
- 5. The axiomatic method 5 1. Basic assumptions and assumptions, usually expressed in basic principles. 2. Basic
- 6. The main process of a complex system 6
- 7. Example Lack of a unified methodology leads to contradictions 7
- 8. Natural-scientific approach 8
- 9. Main directions of system development 9
- 10. 10 System development Direct problem - analytical, based on solving the problem in the form of
- 11. Main directions for assessing the adequacy of the model 11
- 12. Management decision – Solution 12
- 13. Mathematical model of the solution 13
- 14. Basic elements of the formation of the decision model 14 ΔtPM - the periodicity of the
- 15. 15 Process intensity λ = 1/ΔtPM - the periodicity of the problem manifestations ν2 = ΔtPE
- 16. Decision maker 16
- 17. Process of forming the management decision 17
- 18. 18 Basic states of solution A00 - does not identify or neutralize; A10 - identifies and
- 19. 19 Solution of Kolmogorov-Chapman system
- 20. 20 Technology features Safety indicator allows you to assess changes in the situation in any area
- 21. 21 Road safety λ = V/30 V– speed, 30 m – distance to pedestrian crossing ν1
- 22. Road safety 22
- 23. 23 Road safety The graph shows the dependence of the safety indicator (when the driver has
- 24. 24 Worker safety Currently, we are considering possible threats to the most important professions. Firefighter Safety
- 26. Скачать презентацию
Technosphere
The anthroposphere (sometimes also referred as technosphere) is that part of the environment that
Technosphere
The anthroposphere (sometimes also referred as technosphere) is that part of the environment that
Technosphere Safety in Russia
Labor safety
Occupational safety and health
Assessment of working conditions
Safety
Technosphere Safety in Russia
Labor safety
Occupational safety and health
Assessment of working conditions
Safety
Unified technology
4
Main idea:
the results of decisions taken do not justify
Unified technology
4
Main idea:
the results of decisions taken do not justify
The axiomatic method
5
1. Basic assumptions and assumptions, usually expressed in
The axiomatic method
5
1. Basic assumptions and assumptions, usually expressed in
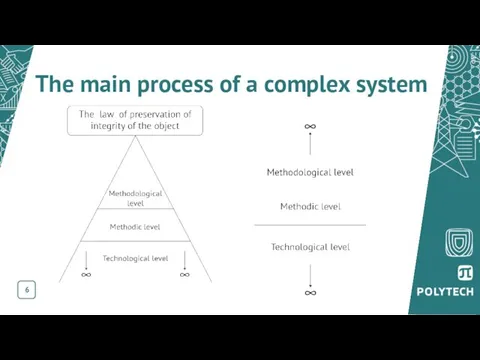
The main process of a complex system
6
The main process of a complex system
6
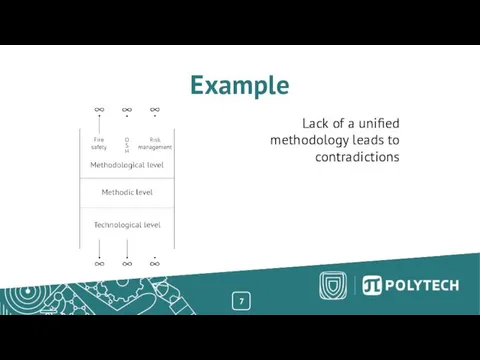
Example
Lack of a unified methodology leads to contradictions
7
Example
Lack of a unified methodology leads to contradictions
7
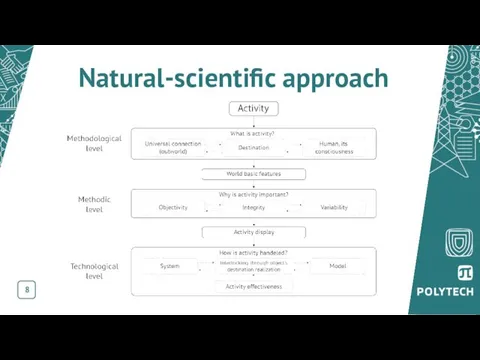
Natural-scientific approach
8
Natural-scientific approach
8
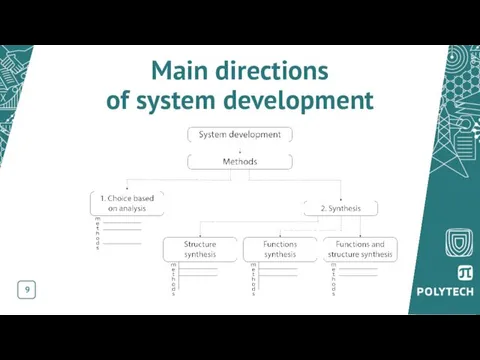
Main directions
of system development
9
Main directions
of system development
9
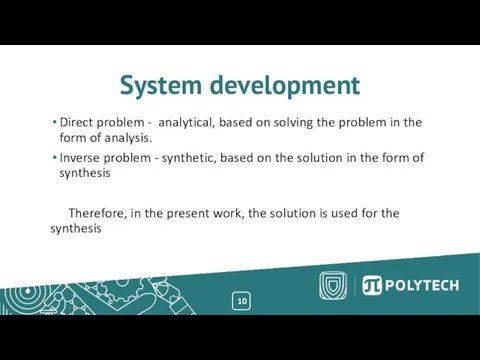
10
System development
Direct problem - analytical, based on solving the problem in
10
System development
Direct problem - analytical, based on solving the problem in
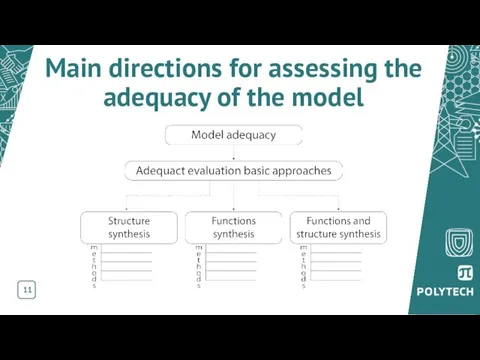
Main directions for assessing the adequacy of the model
11
Main directions for assessing the adequacy of the model
11
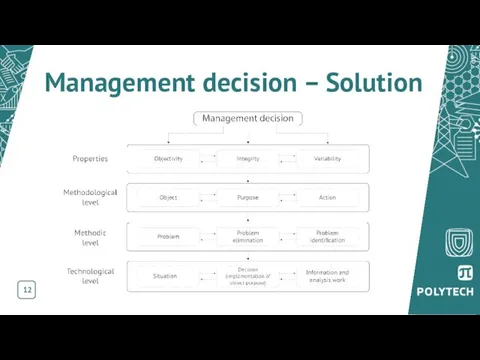
Management decision – Solution
12
Management decision – Solution
12

Mathematical model of the solution
13
Mathematical model of the solution
13
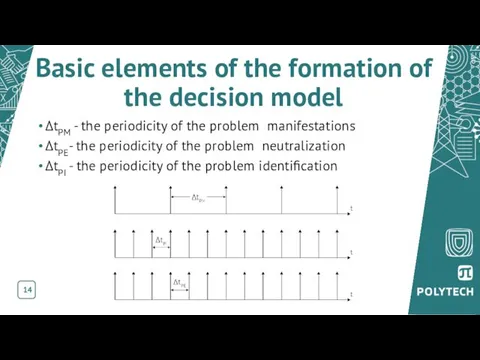
Basic elements of the formation of the decision model
14
ΔtPM - the
Basic elements of the formation of the decision model
14
ΔtPM - the
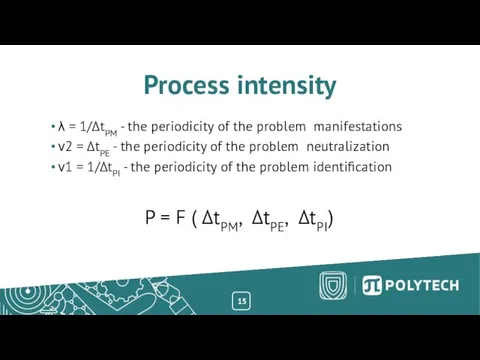
15
Process intensity
λ = 1/ΔtPM - the periodicity of the problem manifestations
ν2
15
Process intensity
λ = 1/ΔtPM - the periodicity of the problem manifestations
ν2
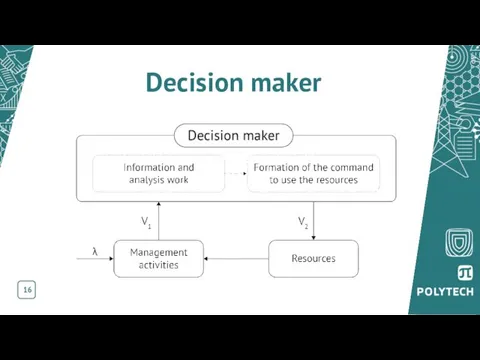
Decision maker
16
Decision maker
16
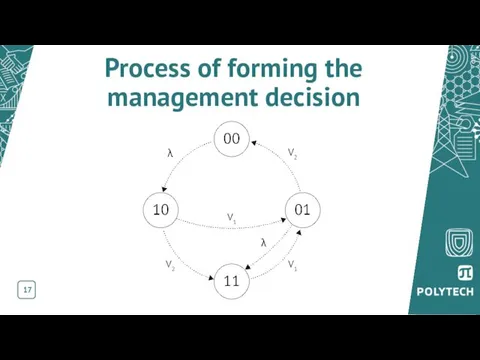
Process of forming the management decision
17
Process of forming the management decision
17
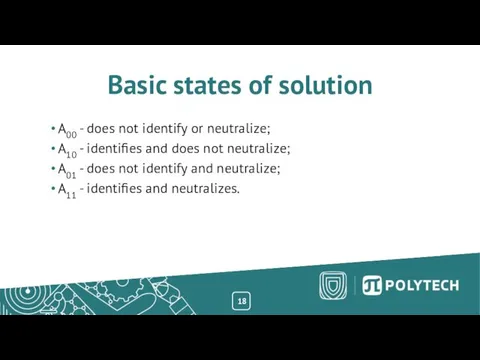
18
Basic states of solution
A00 - does not identify or neutralize;
A10 -
18
Basic states of solution
A00 - does not identify or neutralize;
A10 -
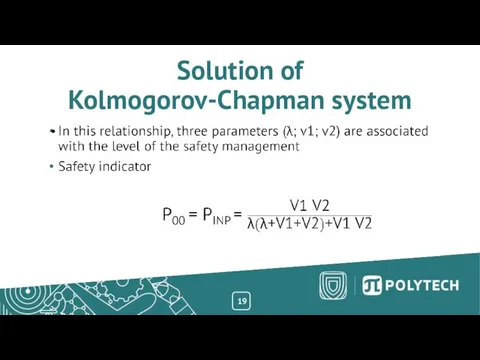
19
Solution of
Kolmogorov-Chapman system
19
Solution of
Kolmogorov-Chapman system
20
Technology features
Safety indicator allows you to assess changes in the situation
20
Technology features
Safety indicator allows you to assess changes in the situation
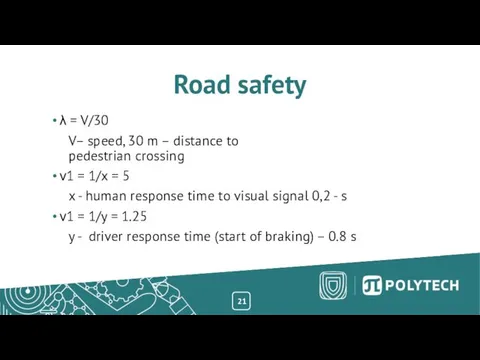
21
Road safety
λ = V/30
V– speed, 30 m – distance to
21
Road safety
λ = V/30
V– speed, 30 m – distance to
Road safety
22
Road safety
22
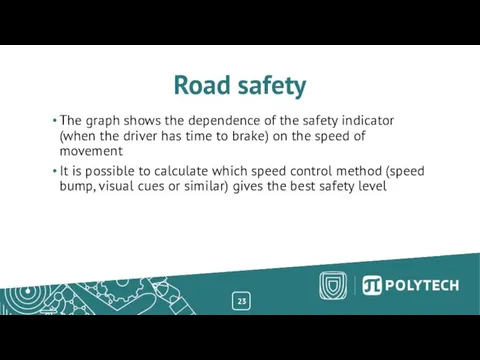
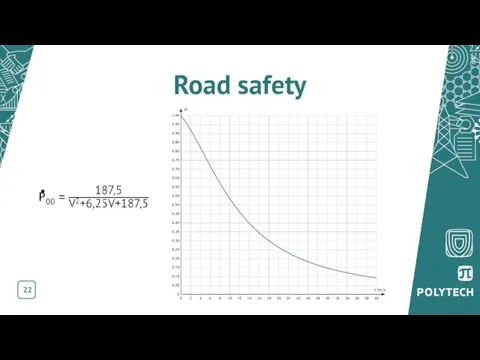
23
Road safety
The graph shows the dependence of the safety indicator (when
23
Road safety
The graph shows the dependence of the safety indicator (when
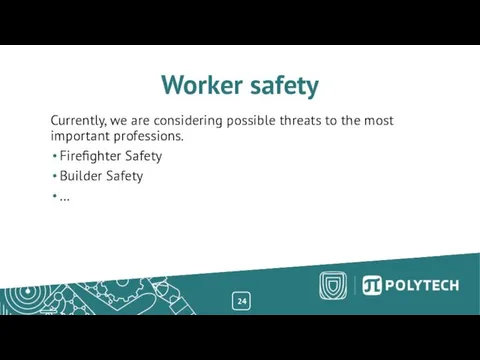
24
Worker safety
Currently, we are considering possible threats to the most important
24
Worker safety
Currently, we are considering possible threats to the most important
 Управление отдельным направлением развития на примере УФМС по Новосибирской области
 Менеджмент
 Классификация предприятий общественного питания
 Методы компенсации рисков. Стратегическое планирование
 Кадровое делопроизводство. Учет рабочего времени и времени отдыха. (Тема 4)
 Материальное и нематериальное стимулирование персонала
 Методы принятия решений
 Основные процедуры и процессы управления проектом
 Планирование и прогнозирование в системе менеджмента
 Раздел 5. Case-технологии структурного анализа и проектирования программных средств
 Организация складского хозяйства предприятий общественного питания
 Системы управления взаимоотношениями с клиентами. Лекция 3
 Профессиональная деятельность турагента
 Виробнича практика. Адміністратор кафе-бара
 Инструкция к документу Установка учета рабочего времени
 Арт-менеджмент в структуре социокультурного менеджмента
 Организация как категория менеджмента
 Тема 2. Основы управления проектами
 Принципы научного менеджмента Фредерика Уинслоу Тейлора
 Tochno.st. Задача повышения возвращаемости пользователей
 Процесс принятия решений
 Субкультура в организации
 Управление проектами: риски
 Производственный менеджмент. Организация процессов в пространстве и во времени
 Управление личной карьерой в современных условиях
 Инновационные управленческие технологии в туризме и гостеприимстве
 Инновационная деятельность. Основные понятия и определения (лекция 1)
 Поняття та класифікація методів управління