- масштабты-үлкейту-туралы_compressed

Содержание
- 2. MacLUTa6K,a uibirapAbiK a/iAbiHAa He Maitbi3Abi?
- 3. HkieTTi 6aranay
- 4. 3epirey Hiieiri 6aranay
- 5. WWW.OEC.WORLD
- 6. PROFILES TOOLS DATA RANKINGS RESEARCH GAMES RUS W LATEST TRENDS @ HISTORICAL DATA ^ SERVICE TRADE
- 7. H)^Z2D
- 8. 3eprrey Hiierri 6aranay
- 9. AmruibiK, iccanap
- 10. \ £HiqMDtf dDmSMHDUWO)l MDVHD^I ajA±M09o>i iqj^Dinreow
- 12. ©nLUEY
- 13. emuEY
- 14. ©3iHfli emuEY
- 15. KOHBEPCMfl ©HLUEY ©3iKfli emuEy
- 16. KOHBEPCMfl emuEY ©3infli emuEY >KOFAPbl CTAHflAPT | 4C
- 17. CEEECTOMMOCTb CPOK COXPAHHOCTb CEPBMC
- 18. KOHBEPCMfl ©3iKfli emiiEV >KOFAPbl CTAHflAPT | 4C eniuEy
- 19. KOHBEPCMfl ©mUEY ©3IHAI eniUEY >KOFAPbl CTAHflAPT | 4C ©3 HAPblFbIKflbl ©niUEY
- 20. KOHBEPCMfl ©flLUEY ©3iKfli emiiEY >KOFAPbl CTAHflAPT | 4C 03 HAPblFblKAbl emuEY KAHLUA % CEHIKI
- 21. ©flLUEY KOHKYPEHTTI emilEY
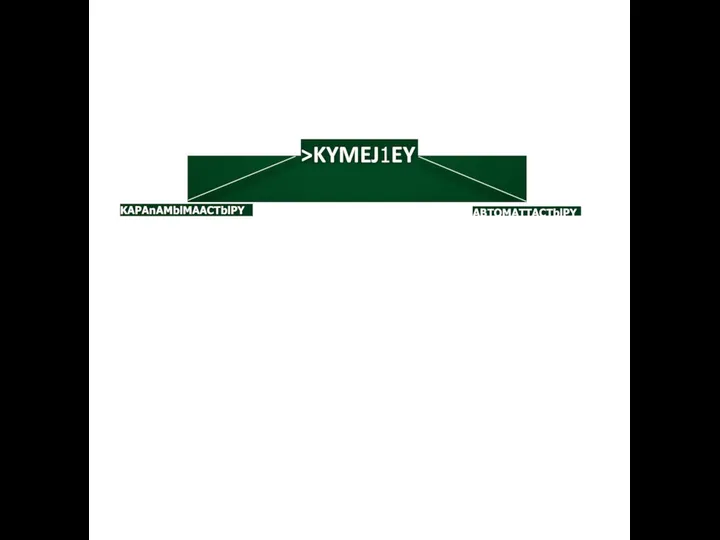
- 22. >KYMEJ1EY
- 23. KAPAflAMblMflACTblPy
- 24. >KYMEJ1EY
- 25. >KYMEJ1EY KAPAnAMblMAACTblPY ABTOMATTACTblPY
- 27. MEHEfl>KMEHT
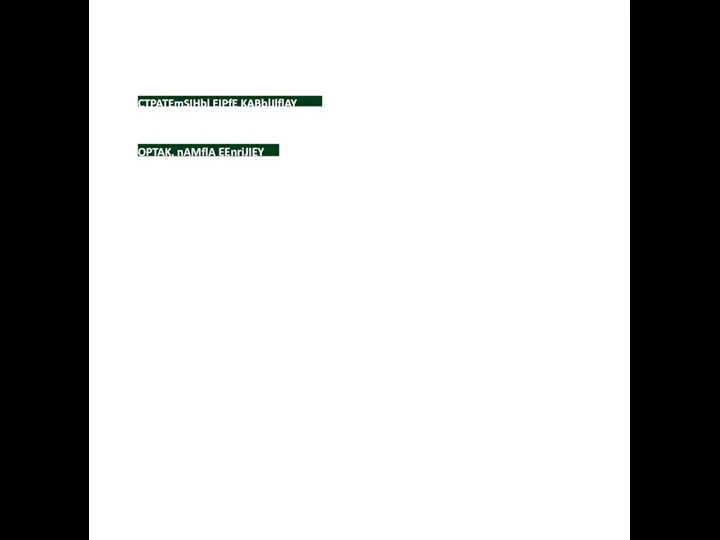
- 28. CTPATEmflHbl EIPfE KABblHflAY
- 29. MEHEfl>KMEHT
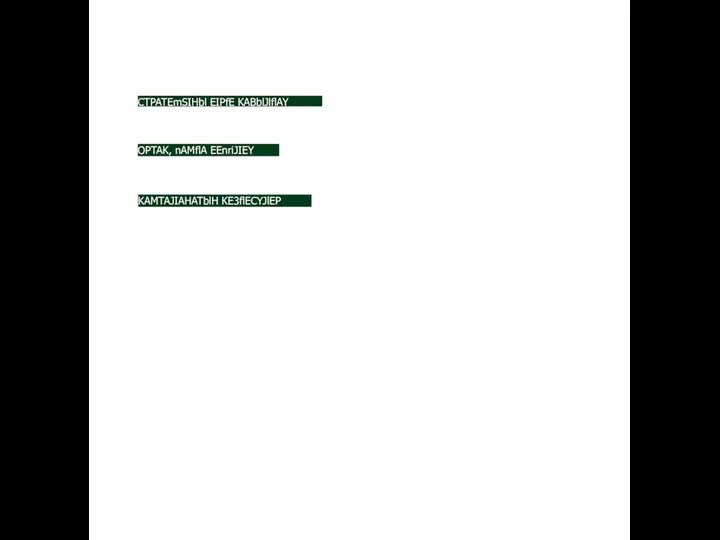
- 30. CTPATEmSIHbl EIPfE KABblJlflAY OPTAK, nAMflA EEnriJIEY
- 31. MEHEfl>KMEHT
- 32. CTPATEmSIHbl EIPfE KABblJlflAY OPTAK, nAMflA EEnriJIEY KAMTAJIAHATblH KE3flECYJlEP
- 33. Telephone: +7 700 459 9288 Instagram: Bolatbek_Dalelkhanuly
- 35. Скачать презентацию
MacLUTa6K,a uibirapAbiK a/iAbiHAa He Maitbi3Abi?
MacLUTa6K,a uibirapAbiK a/iAbiHAa He Maitbi3Abi?

HkieTTi 6aranay
HkieTTi 6aranay

3epirey
Hiieiri 6aranay
3epirey
Hiieiri 6aranay
WWW.OEC.WORLD
WWW.OEC.WORLD
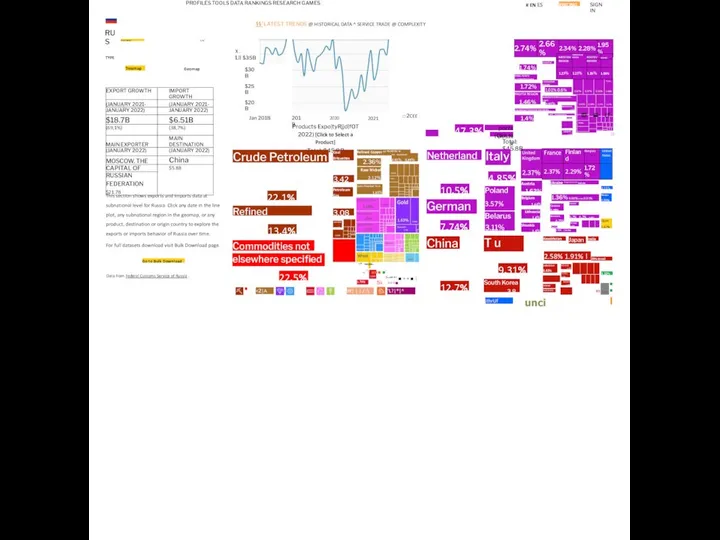
PROFILES TOOLS DATA RANKINGS RESEARCH GAMES
RUS
W LATEST TRENDS @ HISTORICAL DATA
PROFILES TOOLS DATA RANKINGS RESEARCH GAMES
RUS
W LATEST TRENDS @ HISTORICAL DATA
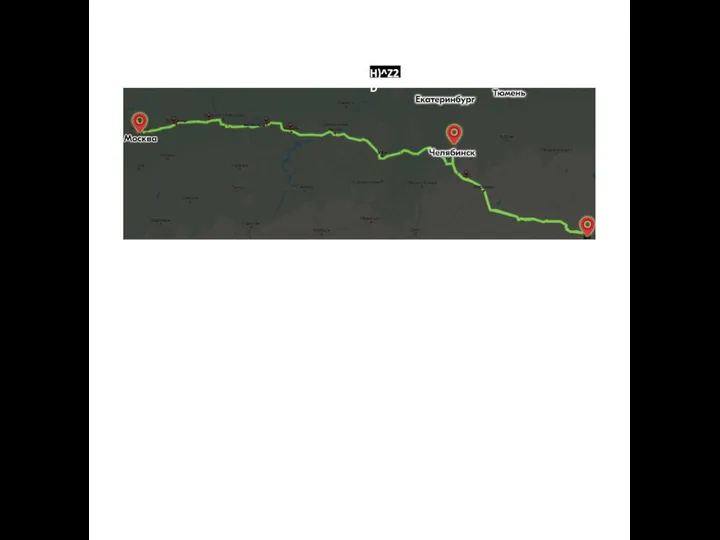
H)^Z2D
H)^Z2D
3eprrey
Hiierri 6aranay
3eprrey
Hiierri 6aranay

AmruibiK, iccanap
AmruibiK, iccanap

\
£HiqMDtf dDmSMHDUWO)l
MDVHD^I ajA±M09o>i iqj^Dinreow
\
£HiqMDtf dDmSMHDUWO)l
MDVHD^I ajA±M09o>i iqj^Dinreow

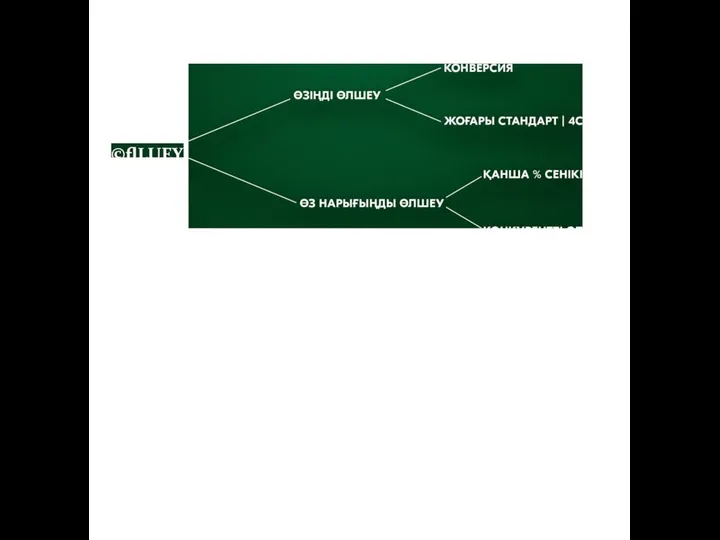
©nLUEY
©nLUEY

emuEY
emuEY
©3iHfli emuEY
©3iHfli emuEY
KOHBEPCMfl
©HLUEY
©3iKfli emuEy
KOHBEPCMfl
©HLUEY
©3iKfli emuEy
KOHBEPCMfl
emuEY
©3infli emuEY
>KOFAPbl CTAHflAPT | 4C
KOHBEPCMfl
emuEY
©3infli emuEY
>KOFAPbl CTAHflAPT | 4C

CEEECTOMMOCTb
CPOK
COXPAHHOCTb
CEPBMC
CEEECTOMMOCTb
CPOK
COXPAHHOCTb
CEPBMC
KOHBEPCMfl
©3iKfli emiiEV
>KOFAPbl CTAHflAPT | 4C
eniuEy
KOHBEPCMfl
©3iKfli emiiEV
>KOFAPbl CTAHflAPT | 4C
eniuEy
KOHBEPCMfl
©mUEY
©3IHAI eniUEY
>KOFAPbl CTAHflAPT | 4C
©3 HAPblFbIKflbl ©niUEY
KOHBEPCMfl
©mUEY
©3IHAI eniUEY
>KOFAPbl CTAHflAPT | 4C
©3 HAPblFbIKflbl ©niUEY
KOHBEPCMfl
©flLUEY
©3iKfli emiiEY
>KOFAPbl CTAHflAPT | 4C
03 HAPblFblKAbl emuEY
KAHLUA % CEHIKI
KOHBEPCMfl
©flLUEY
©3iKfli emiiEY
>KOFAPbl CTAHflAPT | 4C
03 HAPblFblKAbl emuEY
KAHLUA % CEHIKI
©flLUEY
KOHKYPEHTTI emilEY
©flLUEY
KOHKYPEHTTI emilEY

>KYMEJ1EY
>KYMEJ1EY

KAPAflAMblMflACTblPy
KAPAflAMblMflACTblPy

>KYMEJ1EY
>KYMEJ1EY
>KYMEJ1EY
KAPAnAMblMAACTblPY
ABTOMATTACTblPY
>KYMEJ1EY
KAPAnAMblMAACTblPY
ABTOMATTACTblPY


MEHEfl>KMEHT
MEHEfl>KMEHT

CTPATEmflHbl EIPfE KABblHflAY
CTPATEmflHbl EIPfE KABblHflAY

MEHEfl>KMEHT
MEHEfl>KMEHT
CTPATEmSIHbl EIPfE KABblJlflAY
OPTAK, nAMflA EEnriJIEY
CTPATEmSIHbl EIPfE KABblJlflAY
OPTAK, nAMflA EEnriJIEY

MEHEfl>KMEHT
MEHEfl>KMEHT
CTPATEmSIHbl EIPfE KABblJlflAY
OPTAK, nAMflA EEnriJIEY
KAMTAJIAHATblH KE3flECYJlEP
CTPATEmSIHbl EIPfE KABblJlflAY
OPTAK, nAMflA EEnriJIEY
KAMTAJIAHATblH KE3flECYJlEP
Telephone: +7 700 459 9288 Instagram: Bolatbek_Dalelkhanuly
Telephone: +7 700 459 9288 Instagram: Bolatbek_Dalelkhanuly
 Презентация. Место встречи изменить нельзя
 Химическое производство
 Bauman Robotics
 Права и обязанности школьника
 Principles and Elements of Design Applied to Architecture
 Gesty w liturgii
 Махабат және Сүйіспеншілік!
 Презентация Microsoft Office PowerPoint
 Маркиза виста. Гарантийный талон
 Снижение себестоимости затрат на производство
 Строгание и сверление заготовок из древесины
 Отряд Скорпионницы
 Материалы для коттеджа
 Наші пухнасті друзі
 Сварочные генераторы
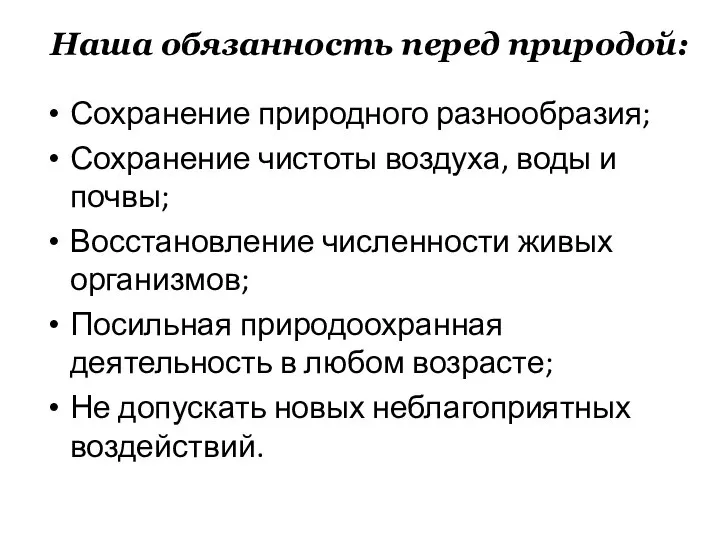 Сохраним богатсво живого мира
 Портфолио медицинской сестры Катаевой Екатерины Яковлевны
 СтрижневаМВ_413_Презентация_задание2
 Rozważania różańcowe. Karola de Foucauld. Tajemnice chwalebne
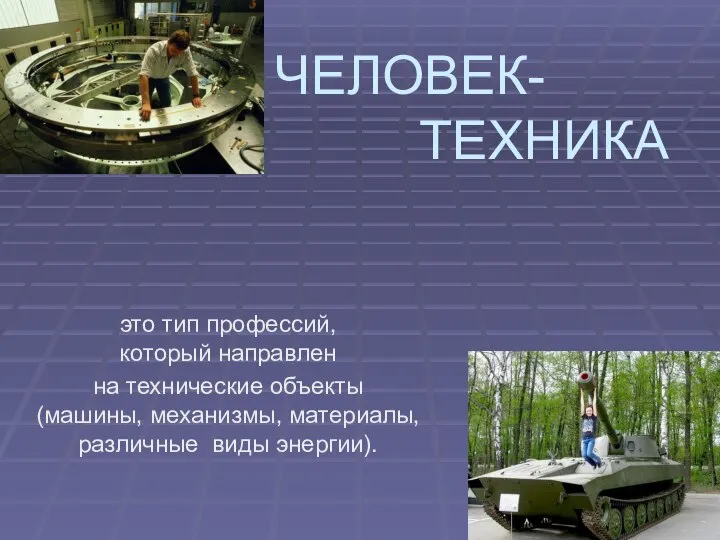 Человек - техника
 Датчики положения. Разновидности и сферы применения
 Современные технологии и архитектура. Энергоэффективная архитектура.Типы энергоэффективных зданий
 к лекции 5
 Мои увлечения
 Символ веры
 Памятки в помощь лицам прибывающим из Украины
 Prezentatsia_copy
 Способы выплавки стали