Содержание
- 2. 01 2019 основные результаты www.stateofeuropeantech.com In Partnership with &
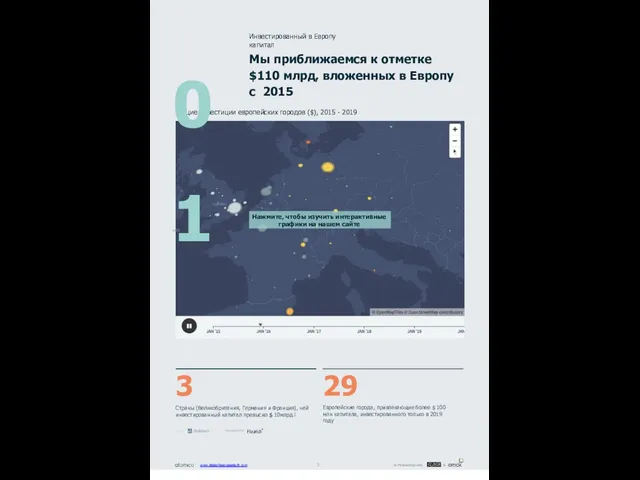
- 3. Общие инвестиции европейских городов ($), 2015 - 2019 Мы приближаемся к отметке $110 млрд, вложенных в
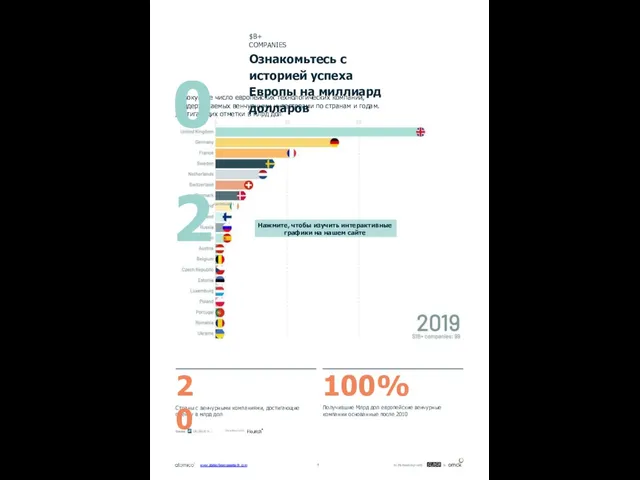
- 4. Совокупное число европейских технологических компаний, поддерживаемых венчурными инвесторами по странам и годам. достигающих отметки в млрд
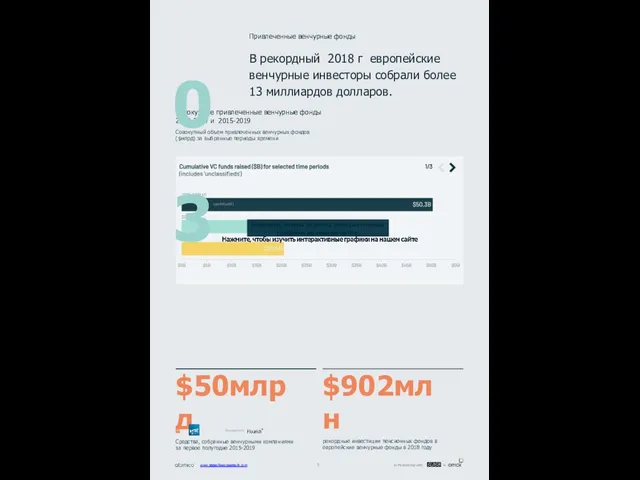
- 5. Совокупные привлеченные венчурные фонды 2010-2014 и 2015-2019 Совокупный объем привлеченных венчурных фондов ($млрд) за выбранные периоды
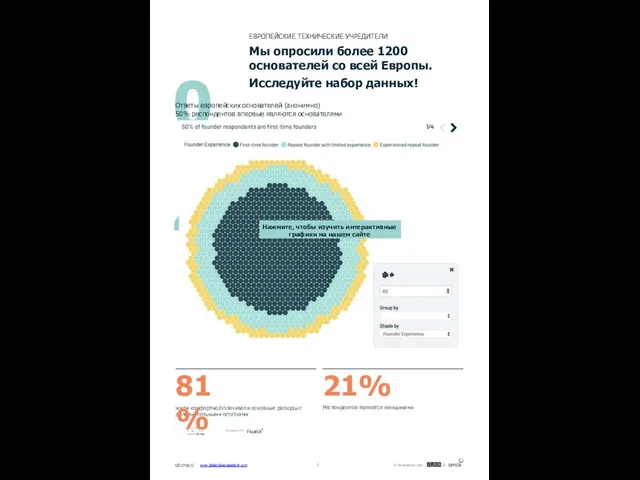
- 6. жили комфортно/оплачивали основные расходы с дополнительными остатками 81% 04sgnidnfiyeK01 21% Респондентов являются женщинами Ответы европейских основателей
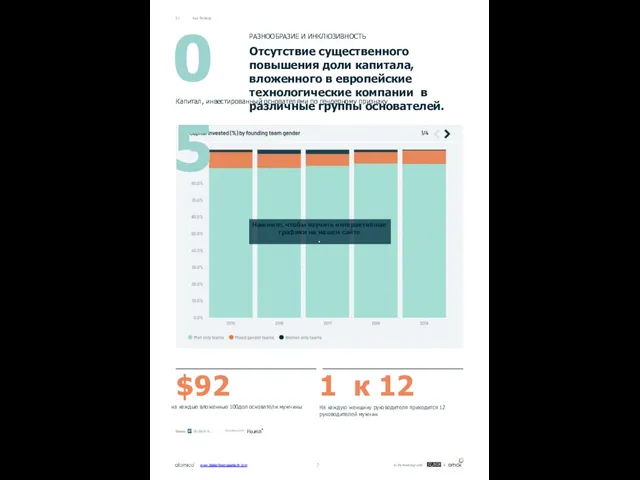
- 7. на каждые вложенные 100дол основатели мужчины $92 1 к 12 На каждую женщину руководителя приходится 12
- 8. $4.4млрд 12.3% капитал, вложенный в целевые европейские от объема капитала, инвестированного технологические компании в 2019 году
- 9. 02 Состояние европейских технологий2019 Почему Европа не может заниматься технологиями? Пора перестать задавать этот вопрос. У
- 10. 02.1 www.stateofeuropeantech.com In Partnership with & At this point, we were amongst a growing but still
- 11. 5 Years of SOET 02.1 Тем не менее, нам нужно убедиться, что мы не зациклились на
- 12. 02.2 Основные положения www.stateofeuropeantech.com In Partnership with & В 2019 году 92% финансирования досталось мужским командам,
- 13. Executive Summary www.stateofeuropeantech.com In Partnership with & 02.2 Теперь это обещание выполняется, и двадцать стран создают
- 14. Наиболее перспективные европейские компании предпочитают больше и дольше оставаться частными, а также получают многомиллиардные оценки на
- 15. 02.3 Компания Slush www.stateofeuropeantech.com In Partnership with & Мы считаем, что предпринимательство - это один из
- 16. 02.4 Компания Orrick www.stateofeuropeantech.com In Partnership with & Развитие технологий по-прежнему опережает регулирование. Отчет демонстрирует, что
- 17. A word from Orrick 02.4 Более 85% учредителей говорят, что они заботятся о социальном и экологическом
- 18. 03 Инвестиции Сколько венчурные капиталисты вкладывают в европейские технологии? Как вы оцениваете доходность европейских технологий? Европейские
- 19. S15.3B S16.5B S22.6B S24.6B S34.3B S49.0B S52.8B S85.5B S117.8B S62.5B 2015 2016 2017 2018 2019 Европа
- 20. Похоже на то, что сейчас для Европы наступил золотой век: качество талантов, уровень амбиций и доступность
- 21. Investment Snapshot Несколько крупных сделок оказывает существенное влияние на годовой уровень капиталовложений в европейские технологические компании.
- 22. Investment Snapshot Как и выше, важно учитывать "запаздывание отчетности" ,чтобы обеспечить сопоставление количества сделок на европейском
- 23. Investment Snapshot Основатели крупных компаний (более 100 сотрудников) и учредители, которые привлекли больше внешнего капитала, имеют
- 24. www.stateofeuropeantech.com 24 In Partnership with & Investment Snapshot В 2019 году в Европе наблюдалось увеличение числа
- 25. Финансовые технологии Корпоративное программное обеспечение Здоровье Энергетика Транспорт Еда Маркетинг Путешествия Безопасность Робототехника Реклама Недвижимость Проведение
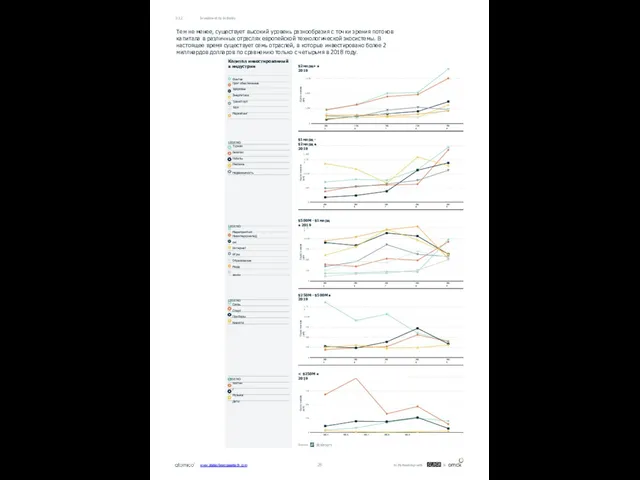
- 26. Тем не менее, существует высокий уровень разнообразия с точки зрения потоков капитала в различных отраслях европейской
- 27. www.stateofeuropeantech.com 27 In Partnership with & Investment by Industry 03.2 Я считаю, что сейчас в Европе
- 28. Самые быстрорастущие отрасли промышленности с точки зрения процентного изменения в годовом исчислении в 2019 году включают
- 29. Искусственный интеллект доминирует над капиталом, вложенным в глубинные технологии, в то время как квантовый еще не
- 30. Великобритания является ведущим направлением в Европе для инвестиций в глубинные технологии, привлекая $ 2,9 млрд в
- 31. Европейская сила в области глубинных технологий также распространяется на новые подкатегории, которые приобретают все большее значение
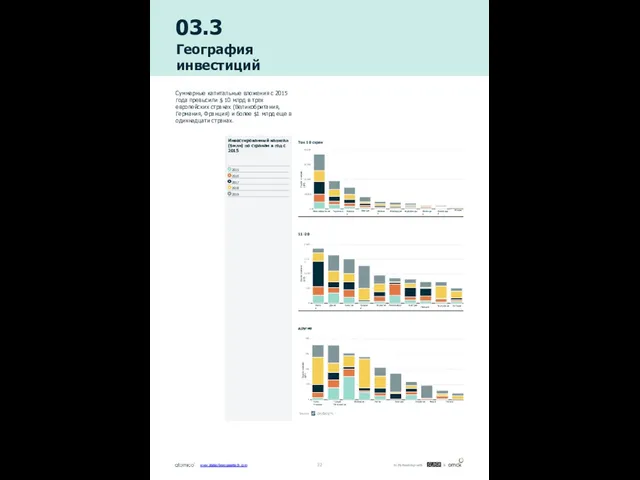
- 32. 03.3 География инвестиций Суммарные капитальные вложения с 2015 года превысили $ 10 млрд в трех европейских
- 33. 2,747 1,183 930 776 457 437 371 359 314 302 London Paris Berlin Stockholm Amsterdam Barcelona
- 34. % of capital invested 2015-2017 2018-2019 YTD 0 25 50 75 100 % of capital invested
- 35. % of capital invested 2015-2017 2018-2019 YTD 0 25 50 75 100 % of capital invested
- 36. % of deals 2015-2017 2018-2019 YTD 0 25 50 75 100 % of deals 2015-2017 2018-2019
- 37. Investment by Geography 03.3 ENERGY FOOD FINTECH % of deals 2015-2017 2018-2019 YTD 0 25 50
- 38. www.stateofeuropeantech.com In Partnership with &
- 39. www.stateofeuropeantech.com In Partnership with &
- 40. www.stateofeuropeantech.com In Partnership with &
- 41. www.stateofeuropeantech.com In Partnership with &
- 42. www.stateofeuropeantech.com In Partnership with &
- 43. Investment by Geography 03.3 The top 10 European tech hubs for capital invested is becoming an
- 44. 03.4 $1B+ Companies There are now at least 174 European tech companies that have scaled to
- 45. www.stateofeuropeantech.com 45 In Partnership with & $1B+ Companies 03.4 At the time of publication, there are
- 46. In Partnership with & www.stateofeuropeantech.com
- 47. 47 In Partnership with & www.stateofeuropeantech.com $1B+ Companies 03.4 The total aggregate value of $1 billion+
- 48. www.stateofeuropeantech.com 48 In Partnership with & $1B+ Companies 03.4 The latest cohort of $1billion+ VC-backed European
- 49. www.stateofeuropeantech.com 49 In Partnership with & $1B+ Companies 03.4 Europe’s now produced 13 $1B+ VC-backed tech
- 50. 50 In Partnership with & 03.5 European Exit Landscape Many will be surprised to know that
- 51. European Exit Landscape 03.5 But you have to dig beneath the headline numbers to get the
- 52. European Exit Landscape 03.5 The numbers of sponsor-backed tech IPOs per region are at similar levels
- 53. European Exit Landscape 03.5 Of course, the 2.8x difference should be put in additional context. It’s
- 54. European Exit Landscape 03.5 Though Europe has yet to produce a company that comes close to
- 55. European Exit Landscape 03.5 Whilst the US had a bumper year in terms of the scale
- 56. European Exit Landscape 03.5 Besides simply looking at the scale of public tech companies, there are
- 57. European Exit Landscape 03.5 2018 was a record year for European VC-backed exits, including the IPOs
- 58. www.stateofeuropeantech.com 58 In Partnership with & European Exit Landscape 03.5 % of M&A exits 2015 2016
- 59. 59 In Partnership with & www.stateofeuropeantech.com 04 Investors What is the definition of a European tech
- 60. wwwwww..ssttatateeooffeueurroopepeaanntteecchh..ccoomm 6060 IInn PPaarrttnneerrsshhiipp wwiitthh && 04.1 VCs and LPs It’s hard to point to a
- 61. VCs and LPs 04.1 2018 was another record year with European VCs raising more than $13B,
- 62. VCs and LPs 04.1 The median size of first-time VC funds closed in Europe hit $62.5m
- 63. VCs and LPs 04.1 Looking back on a cumulative basis at total funds committed to European
- 64. www.stateofeuropeantech.com 64 In Partnership with & VCs and LPs 04.1 Indeed, pension funds appear to be
- 65. VCs and LPs 04.1 The diversification of the LP base for GPs in different regions is
- 66. $30 $33 $23 $12 $20 $5 $0 $2 $3 $57 $57 $54 $54 $30 $18 $16
- 67. VCs and LPs 04.1 It’s interesting to look at the geographic distribution of VC funds raised
- 68. VCs and LPs 04.1 There are interesting differences in the LP composition of VC funds in
- 69. VCs and LPs 04.1 First-time fund managers are most dependent on raising from government agencies and
- 70. VCs and LPs 04.1 Based on their interactions with different LP types VC respondents to the
- 71. www.stateofeuropeantech.com 71 In Partnership with & As venture capital and innovation continue their global growth, Europe
- 72. VCs and LPs 04.1 The scale of European VC is small when compared against the level
- 73. VCs and LPs 04.1 The share of capital deployed by different LP types into European VC
- 74. 04.2 Investors We asked European VCs to give their perspective on a number of trends related
- 75. # of unique institutions 190 234 285 379 356 2015 2016 2017 2018 2019 9M 0
- 76. Investors 04.2 One in five rounds raised in Europe in 2019 involved the participation of at
- 77. Investors 04.2 The volume of investment activity by corporate investors has also expanded considerably in recent
- 78. Investors 04.2 On the other hand, the most active Corporate VCs span a wide range of
- 79. 04.3 Angels European angel investing landscape EBAN estimates that $8.6B (€7.5B) was invested across all European
- 80. www.stateofeuropeantech.com 80 In Partnership with & Angels 04.3 A significant number of founders surveyed mentioned receiving
- 81. Angels 04.3 Founders are becoming more likely to make investments back in the ecosystem in comparison
- 82. Angels 04.3 The age profile of angels varies widely. In France, the average angel investor is
- 83. www.stateofeuropeantech.com 83 In Partnership with & Angels 04.3 Roxanne Varza Station F, France Tuva Palm NordNet,
- 84. Angels 04.3 Repeat founders with significant experience in scaling a company are much more likely to
- 85. Angels 04.3 Still, on average angel investors are likely to say they participate in board activities
- 86. Angels 04.3 Angels tell us the lack of favourable tax systems is a barrier to investing.
- 87. 05 Diversity & Inclusion Does European tech still lack diversity and inclusion? Despiteincreasedawarenessalackofdiversity,theproblemremains entrenched. There is
- 88. Share of founder respondents (%) who have raised external funding by self-identi ed ethnicity LEGEND All
- 89. State of D&I in European Tech 05.1 If we look at the highest educational attainment of
- 90. CAPITAL RAISED % of capital raised / deals 85.4% 86.7% 86.2% 85.5% 86.9% 10.8% 9.9% 9.9%
- 91. % of deals 86% 85% 84% 85% 4% 4% 4% 5% 3% 10% 10% 10% 12%
- 92. Czech Republic Italy Portugal Spain United Kingdom Germany Sweden Russia Switzerland Ireland Finland France Belgium Denmark
- 93. State of D&I in European Tech 05.1 It's particularly notable that, when looking at the evolution
- 94. www.stateofeuropeantech.com In Partnership with &
- 95. Share of deals (%) by founder team gender and industry, 2015- 2019 LEGEND Men Women +
- 96. State of D&I in European Tech 05.1 The fact that Quantum is more inclusive should not
- 97. We revisited prior analysis exploring the gender composition of the leadership teams of European tech companies
- 98. 22% 30% 18% 13% 16% 5 to 9 years 10 to 14 years 15 to 19
- 99. If investors are more representative of society's diversity, we will reach a more diverse set of
- 100. State of D&I in European Tech 05.1 Given these static numbers, it's important to examine the
- 101. State of D&I in European Tech 05.1 We also found large differences between men and women
- 102. In the last 12 months, has your company taken any of the following actions to improve
- 103. In the last 12 months, have you experienced any form of discrimination while working in the
- 104. State of D&I in European Tech 05.1 Discrimination in the European tech industry takes many forms.
- 106. 05.1 State of D&I in European Tech 05.2 Industry Sentiment on D&I I FEEL BETTER INFORMED
- 107. In Partnership with & www.stateofeuropeantech.com
- 108. Asian Black/African/Caribbean Caucasian/White Hispanic/Latinx Middle Eastern/North African Mixed Other 0 10 20 30 40 50 %
- 109. Founder or startup/scale-up employee Venture Capitalist 0 10 20 30 40 50 % of respondents 60
- 110. Industry Sentiment on D&I 05.2 When asked to share their sentiment on any change in the
- 111. Industry Sentiment on D&I 05.2 We asked respondents to share whether they felt more comfortable in
- 112. Industry Sentiment on D&I 05.2 I think we're rightly seeing more thought and attention being given
- 113. Industry Sentiment on D&I 05.2 In our experience hiring in Europe, we assumed there might have
- 114. Asian Black/African/Caribbean Caucasian/White Hispanic/Latinx Middle Eastern/North African Mixed Other Prefer not to say 0 10 20
- 115. 05.3 Community-Led Change We asked respondents to share their views on initiatives they believe have had
- 117. Community-Led Change www.stateofeuropeantech.com In Partnership with & 05.3 UK & IRELAND One of the most powerful
- 118. CEE & DACH Community-Led Change 05.3 UK & IRELAND www.stateofeuropeantech.com In Partnership with &
- 119. FRANCE & BENELUX www.stateofeuropeantech.com In Partnership with & Community-Led Change 05.3
- 120. FRANCE & BENELUX NORDICS Community-Led Change 05.3 120 www.stateofeuropeantech.com In Partnership with &
- 121. SOUTHERN EUROPE NORTH AMERICA GLOBAL Community-Led Change www.stateofeuropeantech.com In Partnership with & 05.3
- 122. ONLINE Community-Led Change 05.3 www.stateofeuropeantech.com In Partnership with &
- 123. In some areas, European tech has certainly become more diverse in the last year. Initiatives like
- 124. Community-Led Change 05.3 According to Meetup, 'Women in Technology' is one of Top 10 fastest-growing topics
- 125. 27.6% 27.5% 26.4% 25.9% 25.7% 25.7% 25.5% 25.5% 25.5% 25.3% Romania Latvia Germany Spain Luxembourg Ireland
- 126. 06 People What kinds of people work in European tech jobs? The archetype of a European
- 127. 06.1 Portrait of a European Tech Founder Our survey of more than 1,200 founders from across
- 128. Portrait of a European Tech Founder 06.1 Around one-quarter of all European founder respondents to the
- 129. Looking only at those founders who have attained a university degree, there are interesting differences in
- 130. Portrait of a European Tech Founder 06.1 The Unicorn Trajectory In November 2019, Notion, a European
- 131. Portrait of a European Tech Founder 06.1 Across Europe, 40% of seed stage startups have a
- 132. Portrait of a European Tech Founder 06.1 # of years of prior work experience 6.5 6.2
- 133. Portrait of a European Tech Founder 06.1 The companies seeding the largest number of European tech
- 134. 06.2 How Founders Get Started Starting out... We wanted to explore the initial phase of the
- 135. How Founders Get Started 06.2 15% 25% 36% 17% 8% 13% 22% 26% 25% 14% No
- 136. How Founders Get Started 06.2 We also observed material differences in the responses from founders who
- 137. How Founders Get Started 06.2 We also wanted to understand how founders finance the initial setup
- 138. How Founders Get Started 06.2 % of respondents 33% 24% 17% 15% 15% 14% 11% Nordics
- 139. 06.3 Founder Challenges & Well-Being We set out to understand how the journey of starting a
- 140. Founder Challenges & Well-Being 06.3 Where we saw a greater variance in responses was when we
- 141. Founder Challenges & Well-Being 06.3 of all founders said that starting a company mostly had a
- 142. Where we did see a larger variance was between founders of externally funded and bootstrapped companies.
- 143. We tried to explore the most challenging aspects of being a founder that were more or
- 144. We also explored if founders who had experienced negative impact on their mental health were receiving
- 145. Of course, it is a fair question to ask whether founders would actually appreciate any support
- 146. 06.4 Strong Talent Base There's a huge competition between cities and countries across Europe to position
- 147. I think the great strength of Europe's ecosystem is the plurality of industrial background we have.
- 148. Strong Talent Base 06.4 The growth in the professional developer talent pool across Europe is a
- 149. Europe's larger countries are, of course, home to the largest developer talent pools. It's useful, therefore,
- 150. 86% 83% 82% 80% 75% 73% 64% 60% 57% 57% 55% 54% 52% 49% 41% 40%
- 151. The European ecosystem's greatest strength continues to be the quality of technical talent, particularly those coming
- 152. % of searches for 'tech' job postings UK Netherlands Italy France Germany Spain Belgium Ireland Sweden
- 153. Top 10 countries with the largest share of freelance professional developers LEGEND % of respondents by
- 154. % of respondents 65% 64% 72% 31% 33% 21% 4% 4% 7% ≤10 employees 11-100 employees
- 155. The best part is that thanks to another 2019 milestone, we're open: When you join a
- 156. 06.5 Incentivising and Retaining Talent The difference in the level of compensation for founders is material
- 157. European tech companies have historically lagged behind those from the US in their use of stock
- 158. It's also interesting to observe how founders of companies that have raised external capital compare in
- 159. In Partnership with & www.stateofeuropeantech.com
- 160. Competition for talent from local startups Competition for talent from global tech companies Employee awareness of
- 161. Beyond financial incentives, employees are increasingly drawn to companies with strong missions. This is particularly striking
- 162. 07 Purpose What is the definition of a purpose-driven tech startup? The EU competition commissioner Margrethe
- 163. 07.1 Finding Purpose Techlash narrative In the United States the Techlash narrative is driven mostly by
- 164. Finding Purpose 07.1 80% of VCs say they assess the potential long-term societal and/or environmental impact
- 165. Finding Purpose 07.1 One in five European founders states their company is already measuring its societal
- 166. Finding Purpose 07.1 I see us moving towards a potentially unhealthy dual internet: a free- for-all
- 167. Finding Purpose 07.1 I'm excited to see a new generation of entrepreneurs in Europe who oppose
- 168. 07.2 Purpose-driven Investment Measuring purpose-driven investment in European tech 2019 saw a huge spike in investment
- 169. Purpose-driven Investment 07.2 Overview of SDGs included in analysis and mapping to keywords on Dealroom platform
- 170. Purpose-driven Investment 07.2 Germany SDG 2: Zero Hunger Netherlands SDG 3: Health and Well-being United Kingdom
- 171. In Partnership with & www.stateofeuropeantech.com
- 172. Purpose-driven Investment 07.2 This year the number of purpose-driven European founders who have pitched to us
- 173. Purpose-driven Investment 07.2 'Tech for good' generally addresses humankind's most important needs, which means the largest
- 174. Purpose-driven Investment 07.2 The number of deals involving purpose-driven European tech companies has been increasing steadily
- 175. Purpose-driven Investment 07.2 Belgium Denmark Norway Austria Poland Portugal Russia Estonia Hungary Lithuania 0.0 0.2 0.5
- 176. Rank of countries by %-point difference in relative share of purpose-driven European tech companies versus all
- 177. 08 Places What are the best hubs for European tech? Cluj-Napoca, Romania, Delft, the Netherlands, Minsk,
- 178. 08.1 Picking Places The answer from founders is interesting; for the significant majority (60%+), regardless of
- 179. Picking Places 08.1 Most founders alsosharedthattheyareunlikelytochangetheiroriginaldecision. Giventhechoicetostart overandto found andbuildtheircompanyagain, theoverwhelmingmajorityof founders, bothfirst-timers andrepeat, wouldchooseeithertostayexactlywheretheyareortostayin Europe,
- 180. Picking Places 08.1 In fact, European scale-ups, i.e. those that have reached $1B+ valuations or more,
- 181. Picking Places 08.1 When you go to market in your own local market, you have a
- 182. $966 $364 $341 $261 $261 $239 Paris Marseille Lyon Nice Lille Bordeaux 0 100 200 300
- 183. Picking Places 08.1 As consumers are more and more aware that tech is changing their lives,
- 184. Picking Places 08.1 The cost of office space is perhaps not at the top of the
- 185. Picking Places 08.1 Amsterdam has built a growing reputation as an attractive location choice for international
- 186. Picking Places 08.1 Capital invested ($) per professional developer by country LEGEND up to 50,000 40,000
- 187. There are a number of challenges facing the tech ecosystem in Spain. However, the biggest issue
- 188. 08.2 Budgeting for your (Series) A Team 'Cheat sheet' How much does it cost to start
- 189. www.stateofeuropeantech.com In Partnership with & Budgeting for your (Series) A Team 08.2
- 190. In Partnership with & www.stateofeuropeantech.com
- 191. $529k $699k $105k $314k $168k $168k $896k $1,351k $93k $93k $470k $706k 20 people 30 people
- 192. 08.3 Research & Technology Hubs Europe enjoys a broad technical talent base composed of professionals with
- 193. A profound and exciting wind of change is blowing through Europe. European Universities are simply among
- 194. Research & Technology Hubs 08.3 Giovanni Anelli CERN Head of Knowledge Transfer Group Historically, US research
- 195. The growth of Europe's most dynamic tech hubs - London, Berlin, Amsterdam, Stockholm, Helsinki, Dublin and
- 196. Mobilityhasbeenconsistentlyintheleadin Europeoverthepast 5 yearsaswellas Health/Pharmaceuticals. It should not come as a surprise that Germany leads by
- 197. Do you agree or disagree with the following statement? European universities effectively commercialise intellectual property (knowledge,
- 198. When asked directly how to better support the research community to start companies and help them
- 199. I believe the academic and business sectors are currently fragmented and stuck in tunnel vision. We
- 200. Given those concerns, it shouldn't be surprising that students themselves cite increased access to startup support
- 201. What are the main reservations you would have when considering whether to start or join a
- 202. Top European universities by total capital raised ($M) by spinoffs NOTE: Based on data from September
- 203. 08.4 Trending Hubs & Communities Europe continues to flourish and to experience growth rates in the
- 204. Trending Hubs & Communities 08.4 # of Meetup attendees 2015 2016 2017 2018 2019 0 20,000
- 205. Trending Hubs & Communities 08.4 European tech communities are also expanding beyond the largest hubs. The
- 206. We need to build up stronger relationships between these local ecosystems so as to form a
- 207. Trending Hubs & Communities 08.4 Bright future ahead for Central & Eastern Europe Central and Eastern
- 208. Trending Hubs & Communities 08.4 Central & Eastern Europe also dominates the list of top ten
- 209. Trending Hubs & Communities 08.4 28 cities have made the list of European cities surpassing 1,000
- 210. 09 Policy What can policymakers do to best help European tech? European policymakers will play a
- 211. 09.1 Europe Policy Focus Measuring policy focus in Europe The data challenge According to our survey
- 212. Europe Policy Focus 09.1 Weinterrogated European Parliamentdocumentationovertheperiod 2014-2019 togetasenseofwhichtopicssurfacedmostfrequentlyintermsofmentionsin activitiesandpressreleases. Itmightbesurprisingtoseethat Big Tech companies fromthe USwerecitedmorefrequentlythananyothertopic,
- 213. Europe Policy Focus 09.1 We also believe that privacy is going to be a huge topic
- 214. Europe Policy Focus 09.1 What’s interesting is just how little discussion, on a relative basis, there
- 215. Europe Policy Focus 09.1 European information governance rules are strong on privacy protection, but there are
- 216. Europe Policy Focus 09.1 The overall trends outlined in terms of the analysis of European Parliament
- 217. The rise of AI, big data, gig workers, facial recognition technology and 5G has given rise
- 218. 09.2 Tech’s Take on Policy We need clearer objectives to successfully regulate the European tech ecosystem.
- 219. Tech’s Take on Policy 09.2 At present, there are too many instances of governments trying to
- 220. Tech’s Take on Policy 09.2 Academic/researcher Consultant/ M&A advisor/investment banker Employee at a company that is
- 221. Tech’s Take on Policy 09.2 Academic/researcher Consultant/M&A advisor/investment banker Employee at a company that is not
- 222. Tech’s Take on Policy 09.2 It’s also telling that just one in five European founders believes
- 223. Tech’s Take on Policy 09.2 One of the shared responsibilities of all government – local and
- 224. Tech’s Take on Policy 09.2 The impact of data privacy regulation is the top-ranked area of
- 225. Tech’s Take on Policy 09.2 It’s interesting that respondents from outside Europe show a materially higher
- 226. Tech’s Take on Policy 09.2 Europe’s tech ecosystem remains characterised by a strong level of optimism
- 227. Tech’s Take on Policy 09.2 There is still a wide gap between the world of policymaking
- 228. 10 About This report was produced in partnership with Slush and Orrick. Nearly 100 people and
- 229. 10.1 Our Contributors Thanks to all of the following people for their assistance and insight in
- 230. Andy Davis Backstage Capital Our Contributors 10.1 Simon Cook Draper Esprit Pierre Entremont FRST Sonali de
- 231. Our Contributors 10.1 Leila Rastegar Zegna Kindred Capital Niklas Zennström Atomico Nicky Morgan UK Secretary of
- 232. 10.2 Acknowledgements We wouldn’t have been able to put together the State of European Tech without
- 233. Our Contributors 10.1 Sarah Guemouri Atomico Ben Jakob Studio Lovelock Thierry Heles Global University Venturing Ant
- 234. Our Contributors 10.1 Tom Wehmeier Atomico Yoram Wijngaarde Dealroom The purpose-driven porpoise Self-employed Maxine Smith Atomico
- 235. 10.3 About Atomico 10.4 About Orrick www.stateofeuropeantech.com In Partnership with & But who is Orrick? Creators.
- 236. 10.4 About Slush 10.5 About Studio Lovelock www.stateofeuropeantech.com In Partnership with & Once again we’ve partnered
- 237. 11 Appendix Last but not least www.stateofeuropeantech.com In Partnership with &
- 238. 11.1 Survey Respondents 27% 19% 16% 10% 7% 5% 4% 3% 2% 2% 2% 1% 1%
- 239. Survey Respondents 11.1 67% 31% 2% Male Female Prefer not to say Non-binary 0% Other 0%
- 240. 11.2 More About Our Data Partners Aon Radford is the technology and life sciences unit of
- 241. More About Our Data Partners 11.2 The European Business Angels Network (EBAN) EBAN, The European Business
- 242. More About Our Data Partners 11.2 Graphext Graphext provides a data science software for business decision
- 243. More About Our Data Partners 11.2 London Stock Exchange London Stock Exchange Group (LSE.L) is a
- 245. Скачать презентацию
01
2019 основные результаты
www.stateofeuropeantech.com
In Partnership with
&
01
2019 основные результаты
www.stateofeuropeantech.com
In Partnership with
&
Общие инвестиции европейских городов ($), 2015 - 2019
Мы приближаемся к отметке
Общие инвестиции европейских городов ($), 2015 - 2019
Мы приближаемся к отметке
Инвестированный в Европу капитал
01sgnidnfiyeK01
Страны (Великобритания, Германия и Франция), чей инвестированный капитал превысил $ 10млрд.l
3
29
Европейские города, привлекающие более $ 100 млн капитала, инвестированного только в 2019 году
Нажмите, чтобы изучить интерактивные графики на нашем сайте
Visualised with:
www.stateofeuropeantech.com
In Partnership with
&
Совокупное число европейских технологических компаний, поддерживаемых венчурными инвесторами по странам и
Совокупное число европейских технологических компаний, поддерживаемых венчурными инвесторами по странам и
Ознакомьтесь с историей успеха Европы на миллиард долларов
$B+ COMPANIES
02sgnidnfiyeK01
Visualised with:
Страны с венчурными компаниями, достигающие оценку в млрд дол
20
100%
Получившие Млрд дол европейские венчурные компании основанные после 2010
Нажмите, чтобы изучить интерактивные графики на нашем сайте
www.stateofeuropeantech.com
In Partnership with
&
Совокупные привлеченные венчурные фонды 2010-2014 и 2015-2019
Совокупный объем привлеченных венчурных фондов
Совокупные привлеченные венчурные фонды 2010-2014 и 2015-2019
Совокупный объем привлеченных венчурных фондов
В рекордный 2018 г европейские венчурные инвесторы собрали более 13 миллиардов долларов.
Привлеченные венчурные фонды
03sgnidnfiyeK01
$50млрд
Средства, собранные венчурными компаниями за первое полугодие 2015-2019
$902млн
рекордные инвестиции пенсионных фондов в европейские венчурные фонды в 2018 году
Нажмите, чтобы изучить интерактивные графики на нашем сайте
Visualised with:
www.stateofeuropeantech.com
In Partnership with
&
жили комфортно/оплачивали основные расходы с дополнительными остатками
81%
04sgnidnfiyeK01
21%
Респондентов являются женщинами
Ответы европейских основателей
жили комфортно/оплачивали основные расходы с дополнительными остатками
81%
04sgnidnfiyeK01
21%
Респондентов являются женщинами
Ответы европейских основателей
50% респондентов впервые являются основателями
ЕВРОПЕЙСКИЕ ТЕХНИЧЕСКИЕ УЧРЕДИТЕЛИ
Мы опросили более 1200 основателей со всей Европы.
Исследуйте набор данных!
Нажмите, чтобы изучить интерактивные графики на нашем сайте
Visualised with:
www.stateofeuropeantech.com
In Partnership with
&
на каждые вложенные 100дол основатели мужчины
$92
1 к 12
На каждую
на каждые вложенные 100дол основатели мужчины
$92
1 к 12
На каждую
Капитал, инвестированный основателями по гендерному признаку
РАЗНООБРАЗИЕ И ИНКЛЮЗИВНОСТЬ
Отсутствие существенного повышения доли капитала, вложенного в европейские технологические компании в различные группы основателей.
01 Key findings
05
Нажмите, чтобы изучить интерактивные графики на нашем сайте
.
Visualised with:
www.stateofeuropeantech.com
In Partnership with
&
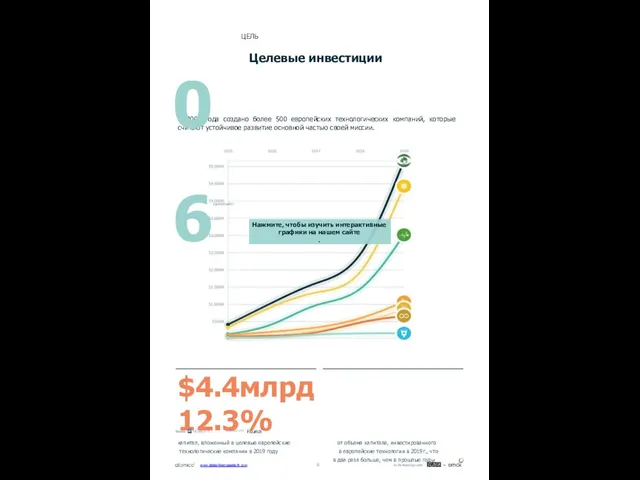
$4.4млрд 12.3%
капитал, вложенный в целевые европейские от объема капитала, инвестированного
технологические
$4.4млрд 12.3%
капитал, вложенный в целевые европейские от объема капитала, инвестированного
технологические
в два раза больше, чем в прошлые годы
С
С 2005 года создано более 500 европейских технологических компаний, которые считают устойчивое развитие основной частью своей миссии.
Целевые инвестиции
ЦЕЛЬ
06sgnidnfiyeK01
Нажмите, чтобы изучить интерактивные графики на нашем сайте
.
Visualised with:
www.stateofeuropeantech.com
In Partnership with
&
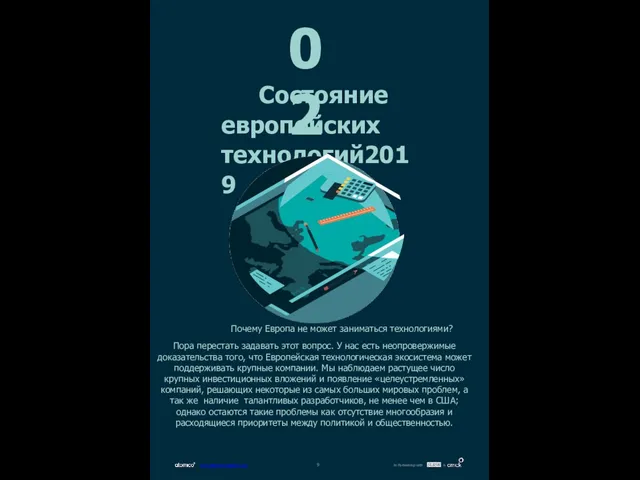
02
Состояние европейских технологий2019
Почему Европа не может заниматься технологиями?
Пора перестать задавать этот
02
Состояние европейских технологий2019
Почему Европа не может заниматься технологиями?
Пора перестать задавать этот
www.stateofeuropeantech.com
In Partnership with
&
02.1
www.stateofeuropeantech.com
In Partnership with
&
At this point, we were amongst a growing but
02.1
www.stateofeuropeantech.com
In Partnership with
&
At this point, we were amongst a growing but
Belief is as vital as talent or capital when it comes to building tech companies. However, in 2015, belief in the European ecosystem was limited to the European tech industry itself.
Fast forward to 2019, and while the world’s media may have focused on Chinese-US trade disputes and volatility on the public markets, European tech has quietly increased its number of external believers. We see this everywhere, from the increased time top US investors are spending on the ground here to the fact that a fifth
of European rounds this year had at least one US or Asian investor participating - a proportion which grows as the deal size increases. VCs are reporting increasing interest from global LPs, while previously unconvinced European Institutional Investors are now fully engaged. We’re also seeing valuations and pre-emptive term sheets on the increase in Europe - always a sign that competition to invest in the best tech companies is accelerating, as well as a reflection on the quality of the opportunity.
In fact, European tech companies are performing at a level exceeding the expectations of all but the most optimistic. In 2015, we celebrated $10B of investment into the region’s tech companies. This year, $35B seems par for the course. That year, our report concerned itself with the late-stage funding gap: in 2019, 40 different European tech companies were able to raise
$100M+ rounds. To date, there are now at least 174 European tech companies that have scaled to a valuation of over $1B - including 99 venture-backed companies.
However, we can’t afford to be complacent - or to lose focus. Now that we’ve instilled the external as well as internal belief,
it’s up to us to shape our own destiny when it comes to the future of European tech. We hope this report provides inspiration and guidance: we need to address our D&I issues, acknowledge the importance of well-being, foster a generation of purpose-driven companies, reinforce the density of our networks of people
and capital, and end the disconnect between policymakers and founders.
A word on our D&I issues: we won’t realise our full potential until we stop squandering talent and value.
Если мы сможем обеспечить, безопасность демографических показателей и многолетнего опыта, у нас будет огромное конкурентное преимущество перед другими частями света, которые менее всеобъемлющи.
Мы надеемся, что этот отчет является полезным исследованием, который является обоснованным подтверждением способностей Европейцев создавать технологические компании. Однако этот отчет-не последнее и не единственное слово о европейских технологиях. Мы рекомендуем вам посетить города, выходящие за рамки тех, которые вы обычно посещаете, и живущие широкими и разнообразными технологическими площадками, которые вместе представляют собой крупнейшую экономическую силу экономического роста во всей Европе
Мы пишем этот отчет, чтобы пролить свет на европейскую технологическую систему. Он намеренно обеспечивает макро взгляд на ландшафт и предназначен для исследования, полезного для максимально возможного количества людей. . Дело в том, что каждый город имеет свою собственную невероятную историю с собственным микро-составом основателей, сотрудников, компаний, инвесторов и университетов, помогающих продвигать технологии как на местном, так и на региональном уровне. Мы инвестировали в 20 европейских городов в 15 странах, но мы помним о том, что у нас есть и слепые зоны. С каждым годом мы наблюдаем, что европейские технологии становятся все более взаимосвязанными - каждый из нас должен воплотить это в жизнь и гарантировать, что эти связи будут продолжаться. Создав прочность талантов и опыта, мы увидим что технологические знания более эффективно передаются будущим и нынешним поколениям европейских основателей. Это поможет нам достичь плотности населения в Европе: обеспечив равномерное распределение талантливых разработчиков и исследователей с капиталом по всему континенту, наш и без того стремительный прогресс ускорится еще быстрее. Когда мы начинали в 2015 году , мы верили, что европейский успех останется без внимания. Сегодня вера в европейские технологии приходит как извне нашей экосистемы, так и изнутри. Принято считать, что вы можете собрать необходимые деньги, нанять лучшую команду и выйти на международный уровень, не мигрируя в США. На самом деле ничто так не демонстрирует этот сдвиг, как приток американского капитала увеличившегося в пять раз в 2018 году.
Предисловие к докладу 2019 года
Многое изменилось с тех пор, как мы представили первый отчет о состоянии европейских технологий в 2015 году . В тот год президент Обама отмечал первую годовщину соглашения по климату с Китаем, в то время как Совет Европы размышлял над письмом премьер- министра Великобритании Дэвида Кэмерона, в котором излагались будущие отношения Великобритании с Евросоюзом. Будущее имеет обыкновение высмеивать прошлые прогнозы, но иногда они действительно попадают в цель. Тогда мы считали, что технологии в Европе уже испытали прорывной год, став платформой для большего успеха. Однако это убеждение оказалось неуместным.
5 Years of SOET
02.1
Тем не менее, нам нужно убедиться, что мы
5 Years of SOET
02.1
Тем не менее, нам нужно убедиться, что мы
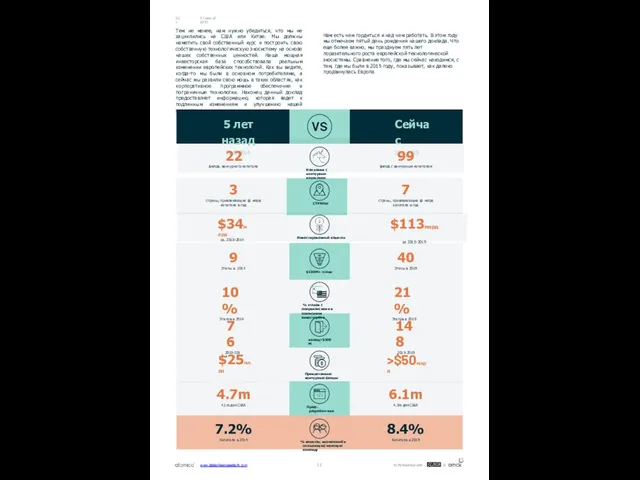
Нам есть чем гордиться и над чем работать. В этом году мы отмечаем пятый день рождения нашего доклада. Что еще более важно, мы празднуем пять лет поразительного роста европейской технологической экосистемы. Сравнение того, где мы сейчас находимся, с тем, где мы были в 2015 году, показывает, как далеко продвинулась Европа.
Сейчас
2015-2019
5 лет назад
2010-2014
22
$млрд. венчурного капитала
99
$млрд с венчурным капиталом
Компании с венчурным капиталом
3
страны, привлекающие $1 млрд капитала в год
7
страны, привлекающие $1 млрд капитала в год
СТРАНЫ
$34млрд
за. 2010-2014
$113млрд
за 2015-2019
Инвестированный капитал
76
2010-2014
148
2015-2019
выход>$100M
$25млрд
>$50млрд
Привлеченные венчурные фонды
9
Этапы в 2014
40
Этапы в 2019
$100M+ этапы
10%
Этапов в 2014
21%
Этапов в 2019
% этапов с американскими и азиатскими инвесторами
4.7m
4.1m для США
6.1m
4.3m для США
Проф. разработчики
7.2%
Капитала в 2014
8.4%
Капитала в 2019
% капитал, вложенный в смешанную/женскую команду
www.stateofeuropeantech.com
In Partnership with
&
02.2
Основные положения
www.stateofeuropeantech.com
In Partnership with
&
В 2019 году 92% финансирования досталось мужским командам,
02.2
Основные положения
www.stateofeuropeantech.com
In Partnership with
&
В 2019 году 92% финансирования досталось мужским командам,
Что также становится все более очевидным, так это то, что женщины-капиталисты продолжают решать проблемы разнообразия Европы: 63% из них сообщили нам, что они увеличили свое внимание на посещение мероприятий с более активным участием различных учредителей против 36%мужчин. Это особенно проблематично, поскольку в докладе за этот год показано, что венчурные капиталисты не увеличили долю женщин на уровне партнеров. Один положительный момент - в быстро растущей отрасли глубоких технологий, мы обнаружили, что 23% европейских квантовых компаний имели смешанную или возглавляемую женщинами команду основателей, что более чем вдвое превышает средний показатель по Европе-13%.Это неудивительно, учитывая большую долю исследователей и ученых, которые являются женщинами: как показывает доклад, женщины фактически составляют более половины населения ученых и инженеров в Литве, Болгарии, Латвии и Дании.
В ходе этого процесса возник целый ряд идей, начиная от детальной информации о том, как основатели на ранних стадиях финансировали свой бизнес, и заканчивая возрастным составом компаний, которые оценивались в миллиарды долларов. Мы также смогли изучить интенсивное личное становление, которое влечет за собой строительство компании, в отчете за этот год. Мы собрали набор данных, который без сомнения демонстрирует, что многие основатели хотят получить помощь.
Целых 57% учредителей, которые привлекли внешний капитал, заявили, что они были бы признательны за поддержку со стороны Совета директоров или инвесторов. В других странах есть положительные стороны : мы обнаружили, что Европейский профессиональный союз разработчиков по- прежнему глубже, чем в США (6,1 млн против 4,3 млн), в то время как на более поздних стадиях европейские компании сокращают разрыв с США в использовании фондовых условий для стимулирования инвестиций.
Состояние разнообразия и вовлеченности
Этот отчет показывает, что европейское разнообразие и вовлеченность все еще недостаточно развиты.
Люди
Опираясь на ответы опроса учредителей , мы набросали портрет того, как выглядит типичный европейский технологический основатель в 2019 году , и как их проблемы меняются по мере увеличения их компании.
Executive Summary
www.stateofeuropeantech.com
In Partnership with
&
02.2
Теперь это обещание выполняется, и двадцать стран создают
Executive Summary
www.stateofeuropeantech.com
In Partnership with
&
02.2
Теперь это обещание выполняется, и двадцать стран создают
Место
Каждый год наши данные выделяют целый ряд технологических центров, которые показывают многообещающие результаты .
Инвесторы поддержали целевые европейские технологические компании с капиталовложениями в размере более $4 млрд в 2019 году, увеличившись более чем в 6 раз за последние пять лет - с учетом того, что совокупный объем инвестиций с 2015 года приблизился к $10 млрд. Dealroom.co была создана основа для оценки европейских технологических компаний с венчурной поддержкой на основе их соответствия целям устойчивого развития Организации Объединенных Наций. Анализ был сосредоточен на совокупности семи из семнадцати Целей устойчивого развития (ЦУР), отобрав только те, где Dealroom наблюдал более высокий уровень активности европейских венчурных стартапов. Мы обнаружили, что более 500 европейских технологических компаний, основанных с 2005 года, решают по крайней мере одну из этих семи целей в качестве основной части своей миссии.
Цель
По наблюдению Маргрет Вестэджер в настоящем докладе рассматривается вопрос о том, что европейские технологии отличаются друг от друга по целевому назначению
Слишком многие основатели все еще пребывают в неведении относительно видения европейской политики в области технологий: 40% опрошенных нами основателей и сотрудников стартапов заявили нам, что они не чувствуют себя информированными о цифровых приоритетах Европейской комиссии. Наш отчет показывает, что основатели технологий призывают к упрощенному регулированию занятости, в то время как данные Politico говорят о том, что внимание политиков находится в другом месте: они меньше сосредоточены на цифровом едином рынке, чем два года назад, и больше сосредоточены на создании цифрового налога и деятельности из крупных американских технологических фирм. Европейские истории успеха, такие как финтех и цифровое здравоохранение, также редко обсуждаются политиками. Мы должны обеспечить, чтобы европейские политики и основатели смотрели в том же направлении, если Европа хочет реализовать свой потенциал.
Политика
Чтобы реализовать потенциал европейских технологий, сложная и четкая политика будет иметь ключевое значение , поэтому необходим диалог
Наиболее перспективные европейские компании предпочитают больше и дольше оставаться частными, а
Наиболее перспективные европейские компании предпочитают больше и дольше оставаться частными, а
Во многом это было вызвано большими раундами финансирования: 40% всего финансирования, привлеченного европейскими технологическими компаниями за первые девять месяцев 2019 года, было в сделках больше $100 млн. Хотя в 2019 году не было европейского IPO с венчурной поддержкой в $1B, мы действительно видим амбиции масштабироваться до огромных результатов в экосистеме.
IPO больше не входят в повестку дня каждого основателя, но сколько бы капитала ни поступал в регион, они всегда будут осторожно относиться к повышению следующего раунда
Инвестиции
В отличие от США и Китая, инвестиции в европейские технологии продолжают расти.
Данные кембриджской ассоциации по доходности венчурных инвестиций показывают, что индексы по Европе либо находятся на одном уровне, либо значительно превосходят показатели как американских так и европейских прямых инвестиций.
Даже несмотря на то, что инвестиции государственных агентств в венчурные фонды упали почти на $1 млрд в 2018 году , фактически мы наблюдаем всплеск инвестиций в пенсионные фонды, что на 203% больше, чем в прошлом году.
Отчет этого года отслеживает больше инвесторов, чем когда- либо прежде, от новичков до 2600 уникальных институциональных инвесторов, участвующих в европейской сделке в 2019 году .
И давайте не будем забывать о корпоративных инвесторах, таких как Unilever Ventures или Next 47, которые участвовали в 1 из 5 сделок в 2019 году или рост интереса инвесторов из- за рубежа: в прошлом году 21% европейских раундов имели по крайней мере одного американского или азиатского инвестора- по сравнению с 10% в 2015 году.
Инвесторы
После успеха европейской технологической экосистемы в последние пять лет, нет ничего удивительного в том, что европейская венчурная индустрия чувствует себя вполне здорово.
Executive Summary
02.2
Photo by: Jussi Hellsten
www.stateofeuropeantech.com
In Partnership with
&
02.3
Компания Slush
www.stateofeuropeantech.com
In Partnership with
&
Мы считаем, что предпринимательство - это один из
02.3
Компания Slush
www.stateofeuropeantech.com
In Partnership with
&
Мы считаем, что предпринимательство - это один из
Однако Европа только начинает осознавать тот факт, что предпринимательство не является одинаково доступным для всех. И для того, чтобы увидеть разного рода проблемы, нужны разные люди. Slush по- прежнему стремится освещать более широкий спектр ролевых моделей для следующего поколения основателей через наши мероприятия и недавно запущенные средства массовой информации .
Учитывая эти достижения, рекордные инвестиции в европейские технологии- это явный признак динамичной экосистемы. Одним из наиболее обнадеживающих событий является рост предпринимательских амбиций, о чем свидетельствует количество инвестиционных раундов на поздних стадиях: европейские компании больше не продают свои активы на ранних сроках , а продолжают расти как самостоятельные предприятия. Это создает надежду на исключительно положительные времена, когда основатели и ключевые сотрудники этих историй успеха начинают свой второй этап построения компании.
Andreas Saari
CEO, Slush
02.4
Компания Orrick
www.stateofeuropeantech.com
In Partnership with
&
Развитие технологий по-прежнему опережает регулирование. Отчет демонстрирует, что
02.4
Компания Orrick
www.stateofeuropeantech.com
In Partnership with
&
Развитие технологий по-прежнему опережает регулирование. Отчет демонстрирует, что
Мы также призываем директивные органы рассмотреть возможности упрощения и рационализации требований к соблюдению требований, увеличивая нагрузку по мере расширения компании (и риска). Это особенно важно в сфере регулирования занятости. В противном случае мы рискуем возложить непомерное бремя на стартапы – и задушить их способность расти, внедрять инновации и создавать те самые рабочие места .
Интеграция по- прежнему является сложной задачей для данного сектора, поскольку только 8% финансирования приходится на компании, возглавляемые смешанными гендерными и женскими командами. Однако на уровне компании более 40% членов команды видят улучшение. В докладе также отмечается, что более половины инвесторов и сотрудников стартапов до сих пор не имели преимуществ от неосознанных предубеждений.
Социальная наука не оставляет никаких сомнений в том, что более инклюзивное лидерство будет порождать больше инноваций и отдачи.
Европейская комиссия должна уточнить свои приоритеты в области регулирования.
Технологии-это двигатель европейского роста, как ясно видно из отчета о состоянии европейских технологий в этом году. Технологическая экосистема Европы хорошо налажена и устойчива, с рекордным финансированием, опытными основателями и инвесторами, а также ускоряющимся ростом. Европейские технологические компании, скорее всего, достигнут $34 млрд финансирования в 2019 году, по сравнению с $25 млрд в 2018 году. За последние пять лет объем финансирования увеличился более чем вдвое. Это включает в себя более 40 $100 млн сделок в этом году – больше, чем когда-либо прежде. ПО всей Европе сейчас насчитывается 174 $ млрд+ технологических единорогов. В 2010 году их было всего 18 – Это в 10 раз больше, чем за последние десять лет. А в 20 странах сейчас есть по крайней мере один единорог, вдвое больше, чем всего пять лет назад. Сегодня в 170 городах есть технологические сообщества, по сравнению с 70 четыре года назад. Хотя в этом году число сделок по слияниям и поглощениям сократилось, за последние пять лет их было в два раза больше, чем за предыдущие пять лет. А стоимость сделки по слияниям и поглощениям уже близка к тому, чтобы превысить прошлогоднюю сумму в $100 млрд.
Что потребуется для поддержания успеха Европы? В докладе говорится о четырех вещах:
Поменять отношение к ценности интеграции; за этим должны следовать инвестиции
A word from Orrick
02.4
Более 85% учредителей говорят, что они заботятся о
A word from Orrick
02.4
Более 85% учредителей говорят, что они заботятся о
Почти 20% основателей говорят, что запуск компании оказал “в основном негативное” влияние на их психическое здоровье, а подавляющее большинство-на психическое здоровье людей. Большинство заявило, что они приветствовали бы большую поддержку со стороны инвесторов в управлении давлением, с которым они сталкиваются. Здоровье основателя является важным фактором общего здоровья экосистемы. Мы считаем, что акцент на инклюзивность может помочь и здесь. Мы невероятно благодарны компании Atomic за то, что она собрала и поделилась богатой информацией о рынке в этом отчете. В Orrick мы с нетерпением ожидаем продолжения нашей работы с Европейским технологическим сообществом для создания еще более сильной европейской платформы. За последние 15 кварталов мы консультировали больше венчурных сделок в Европе, чем любая другая юридическая фирма – в 2,5 раза. И мы поддержали более 20 компаний единорогов юридическими, нормативными и коммерческими консультациями с момента их создания. Это невероятная честь-быть частью вашей истории успеха.
Устойчивость- это верх ума – но есть место для большей сосредоточенности.
Как общество, мы должны заботиться о психическом здоровье и стабильности
Chris Grew
Партнер Группы Технологических Компаний Orrick
Photo by: Jussi Hellsten
www.stateofeuropeantech.com
In Partnership with
&
03
Инвестиции
Сколько венчурные капиталисты вкладывают в европейские технологии?
Как вы оцениваете доходность европейских
03
Инвестиции
Сколько венчурные капиталисты вкладывают в европейские технологии?
Как вы оцениваете доходность европейских
www.stateofeuropeantech.com
In Partnership with
&
S15.3B S16.5B
S22.6B S24.6B
S34.3B
S49.0B
S52.8B
S85.5B
S117.8B
S62.5B
2015 2016 2017 2018 2019
Европа
2015 2016 2017 2018 2019
Азия
2015
S15.3B S16.5B
S22.6B S24.6B
S34.3B
S49.0B
S52.8B
S85.5B
S117.8B
S62.5B
2015 2016 2017 2018 2019
Европа
2015 2016 2017 2018 2019
Азия
2015
США
S79.8B
S66.4B
S71.5B
S118.2B S116.7B
125.0
100.0
75.0
50.0
25.0
0.0
Venture capital invested (SB)
03.1
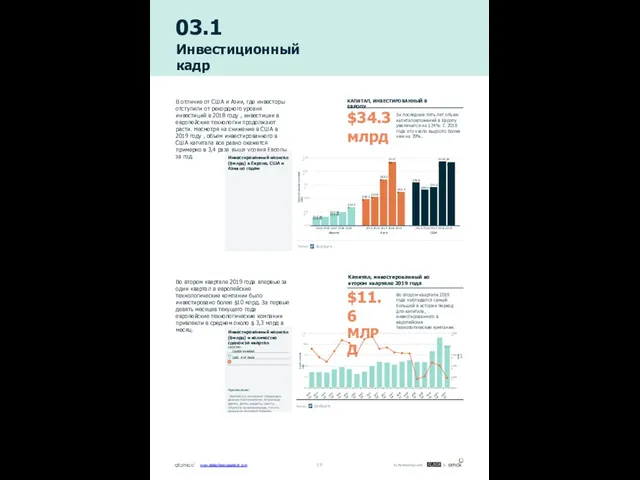
Инвестиционный кадр
В отличие от США и Азии, где инвесторы отступили от рекордного уровня инвестиций в 2018 году , инвестиции в европейские технологии продолжают расти. Несмотря на снижение в США в 2019 году , объем инвестированного в США капитала все равно окажется примерно в 3,4 раза выше уровня Европы за год.
Во втором квартале 2019 года впервые за один квартал в европейские технологические компании было инвестировано более $10 млрд. За первые девять месяцев текущего года европейские технологические компании привлекли в среднем около $ 3,3 млрд в месяц.
За последние пять лет объем капиталовложений в Европу увеличился на 124%. С 2018 года это число выросло более чем на 39%.
Во втором квартале 2019 года наблюдался самый большой в истории период для капитала, инвестированного в европейские технологические компании.
КАПИТАЛ, ИНВЕСТИРОВАННЫЙ В ЕВРОПУ
Капитал, инвестированный во втором квартале 2019 года
$11.6МЛРД
$34.3млрд
Capital invested ($B)
# of deals
2015 Q1
2015 Q2
2015 Q3
2015 Q4
2016 Q1
2016 Q2
2016 Q3
2016 Q4
2017 Q1
2017 Q2
2017 Q3
2017 Q4
2018 Q1
2018 Q2
2018 Q3
2018 Q4
2019 Q1
2019 Q2
2019 Q3
0.0
2.5
5.0
7.5
10.0
12.5
800.0
1,000.0
1,200.0
1,400.0
1,600.0
1,800.0
Инвестированный капитал ($млрд) в Европе, США и Азия по годам
Инвестированный капитал ($млрд) и количество сделок за квартал
LEGEND
Capital invested ($B) # of deals
Примечание:
Dealroom.co исключают следующие данные: биотехнологии, вторичные сделки, долги, кредиты, гранты. Обратите также внимание, что эти данные не включают Израиль.
www.stateofeuropeantech.com
In Partnership with
&
Похоже на то, что сейчас для Европы наступил золотой век: качество
Похоже на то, что сейчас для Европы наступил золотой век: качество
Европейские стартапы строят глобально определяющие потребительские и корпоративные бизнесы с большим успехом. Spotify, UiPath, Adeyn - все это яркие примеры. Я думаю, что эти и другие ролевые модели сыграли решающую роль в вдохновении нового и совершенного поколения основателей, которые теперь выбирают предпринимательство в качестве своего карьерного пути.
Sonali de Rycker
Accel Partner
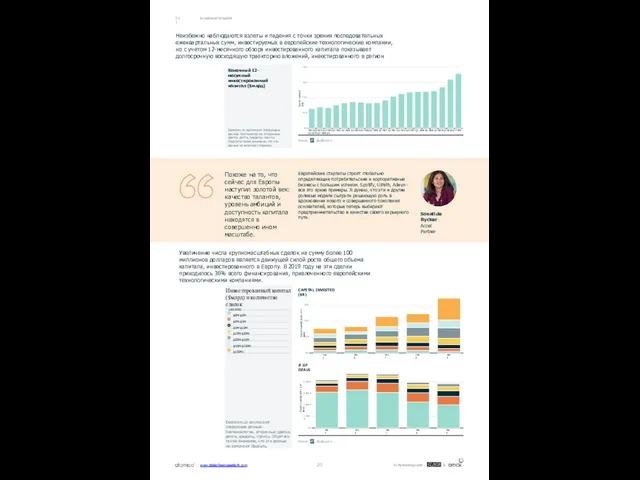
Investment Snapshot
03.1
Неизбежно наблюдаются взлеты и падения с точки зрения последовательных ежеквартальных сумм, инвестируемых в европейские технологические компании, но с учетом 12-месячного обзора инвестированного капитала показывает долгосрочную восходящую траекторию вложений, инвестированного в регион
Увеличение числа крупномасштабных сделок на сумму более 100 миллионов долларов является движущей силой роста общего объема капитала, инвестированного в Европу. В 2019 году на эти сделки приходилось 36% всего финансирования, привлеченного европейскими технологическими компаниями.
# OF DEALS
CAPITAL INVESTED ($B)
Capital invested ($B)
2015 Q1 2015 Q2 2015 Q3 2015 Q4 2016 Q1 2016 Q2 2016 Q3 2016 Q4 2017 Q1 2017 Q2 2017 Q3 2017 Q4 2018 Q1 2018 Q2 2018 Q3 2018 Q4 2019 Q1 2019 Q2 2019 Q3
0.0
10.0
20.0
30.0
40.0
Capital invested ($M) / # of deals
2015
2016
2017
2018
2019
0.0
10.0
20.0
30.0
Capital invested ($M) / # of deals
2015
2016
2017
2018
2019
0.0
1,000.0
2,000.0
3,000.0
4,000.0
Конечный 12-месячный инвестированный капитал ($млрд)
Dealroom.co исключают следующие данные: биотехнологии, вторичные сделки, долги, кредиты, гранты. Обратите также внимание, что эти данные не включают Израиль.
Инвестированный капитал ($млрд) и количество сделок
LEGEND
$0M-$2M
$2M-$5M
$5M-$10M
$10M-$20M
$20M-$50M
$50M-$100M
$100M+
Dealroom.co исключают следующие данные: биотехнологии, вторичные сделки, долги, кредиты, гранты. Обратите также внимание, что эти данные не включают Израиль.
www.stateofeuropeantech.com
In Partnership with
&
Investment Snapshot
Несколько крупных сделок оказывает существенное влияние на годовой уровень капиталовложений
Investment Snapshot
Несколько крупных сделок оказывает существенное влияние на годовой уровень капиталовложений
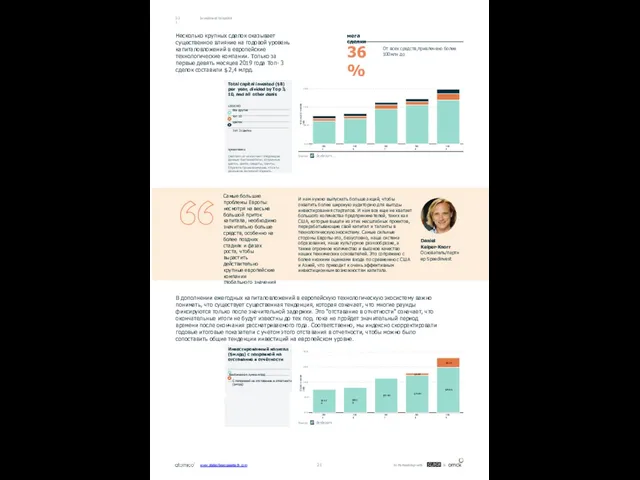
От всех средств,привлечено более 100млн до
мега сделки
36%
В дополнении ежегодных капиталовложений в европейскую технологическую экосистему важно понимать, что существует существенная тенденция, которая означает, что многие раунды фиксируются только после значительной задержки. Это "отставание в отчетности" означает, что окончательные итоги не будут известны до тех пор, пока не пройдет значительный период времени после окончания рассматриваемого года. Соответственно, мы индексно скорректировали годовые итоговые показатели с учетом этого отставания в отчетности, чтобы можно было сопоставить общие тенденции инвестиций на европейском уровне.
Самые большие проблемы Европы: несмотря на весьма большой приток капитала, необходимо значительно больше средств, особенно на более поздних стадиях и фазах роста, чтобы вырастить действительно крупные европейские компании глобального значения
И нам нужно выпускать больше акций, чтобы охватить более широкую аудиторию для выгоды инвестирования стартапов. И нам все еще не хватает большого количества предпринимателей, таких как США, которые вышли из этих масштабных проектов, перерабатывающие свой капитал и таланты в технологическую экосистему. Самые сильные стороны Европы-это, безусловно, наша система образования, наше культурное разнообразие, а также огромное количество и высокое качество наших технических основателей. Это сопряжено с более низкими оценками входа по сравнению с США и Азией, что приводит к очень эффективным инвестиционным возможностям капитала.
Daniel Keiper-Knorr Основатель/партнер Speedinvest
03.1
Total capital invested ($B)
2015
2016
2017
2018
2019
0.0
10.0
20.0
30.0
Capital invested ($B)
$15.3B
$16.5B
$22.6B
$24.6B
$29.8B
$1.3B
$6.3B
2015
2016
2017
2018
2019
0.0
10.0
20.0
30.0
40.0
Total capital invested ($B) per year, divided by Top 3, 10, and all other deals
LEGEND
Все другие топ 10 сделок
Топ 3 сделки
примечание
Dealroom.co исключают следующие данные: биотехнологии, вторичные сделки, долги, кредиты, гранты. Обратите также внимание, что эти данные не включают Израиль.
Инвестированный капитал ($млрд) с поправкой на отставание в отчётности
фактическая сумма млрд
С поправкой на отставание в отчетности($млрд)
www.stateofeuropeantech.com
In Partnership with
&
Investment Snapshot
Как и выше, важно учитывать "запаздывание отчетности" ,чтобы обеспечить сопоставление
Investment Snapshot
Как и выше, важно учитывать "запаздывание отчетности" ,чтобы обеспечить сопоставление
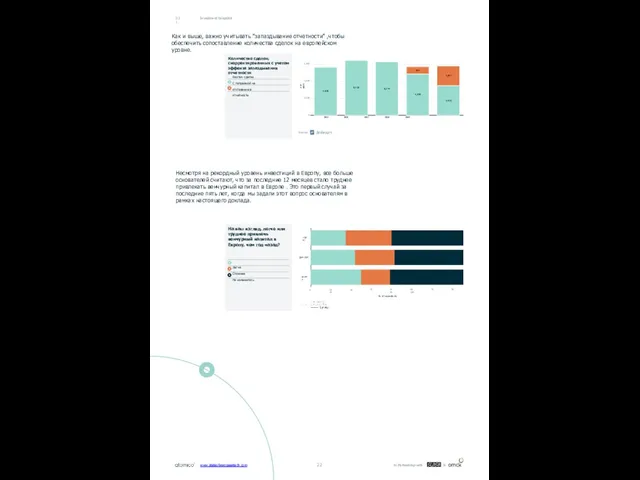
Несмотря на рекордный уровень инвестиций в Европу, все больше основателей считают, что за последние 12 месяцев стало труднее привлекать венчурный капитал в Европе . Это первый случай за последние пять лет, когда мы задали этот вопрос основателям в рамках настоящего доклада.
03.1
# of deals
5,620
6,416
6,244
4,839
3,456
854
2,304
2015 2016 2017 2018 2019
0
2,000
4,000
6,000
<$5M
$5M-25M
$25M+
0 10 20 30
40 50 60 70 80 90 100
% of respondents
На ваш взгляд, легче или труднее привлечь венчурный капитал в Европу, чем год назад?
Легче
Сложнее
Не изменилось
Количество сделок, скорректированных с учетом эффекта запаздывания отчетности
Фактич сделки
С поправкой на отставание в отчетности
www.stateofeuropeantech.com
In Partnership with
&
Investment Snapshot
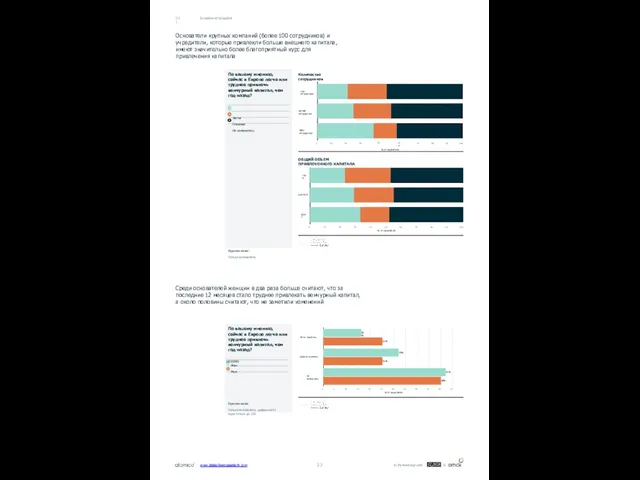
Основатели крупных компаний (более 100 сотрудников) и учредители, которые привлекли
Investment Snapshot
Основатели крупных компаний (более 100 сотрудников) и учредители, которые привлекли
Среди основателей женщин в два раза больше считают, что за последние 12 месяцев стало труднее привлекать венчурный капитал, а около половины считают, что не заметили изменений
03.1
ОБЩИЙ ОБЪЕМ ПРИВЛЕЧЕННОГО КАПИТАЛА
Количество сотрудников
≤10 сотрудников
10-100 сотрудников
100+ сотрудников
0
10
20
30
40 50 60
% of respondents
70
80
90
100
<$5M
$5M-25M
$25M+
0
10
20
30
40
50
% of respondents
60
70
80
90
100
16%
32%
52%
25%
25%
50%
Легче привлечь
Труднее привлечь
Не изменилось
0
5
10
15
20
25
30
% of respondents
35
40
45
50
55
По вашему мнению, сейчас в Европе легче или труднее привлечь венчурный капитал, чем год назад?
Легче
Сложнее
Не изменилось
Примечание:
Только основатели
По вашему мнению, сейчас в Европе легче или труднее привлечь венчурный капитал, чем год назад?
LEGEND
Жен Муж
Примечание
Только основатели, цифры могут округляться до 100
www.stateofeuropeantech.com
In Partnership with
&
www.stateofeuropeantech.com 24 In Partnership with &
Investment Snapshot
В 2019 году в Европе наблюдалось увеличение числа
www.stateofeuropeantech.com 24 In Partnership with &
Investment Snapshot
В 2019 году в Европе наблюдалось увеличение числа
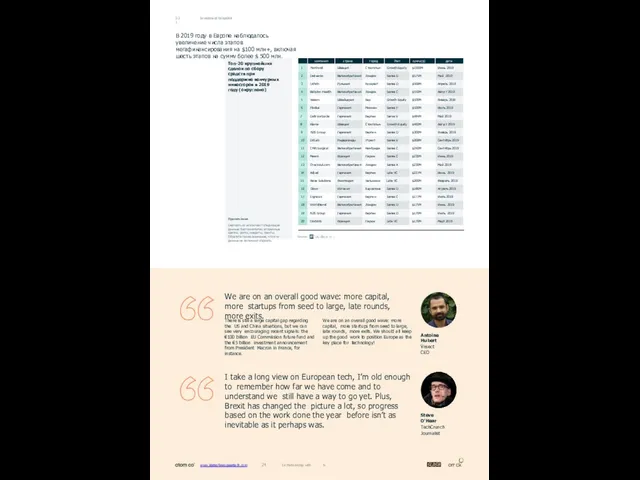
We are on an overall good wave: more capital, more startups from seed to large, late rounds, more exits.
I take a long view on European tech, I’m old enough to remember how far we have come and to understand we still have a way to go yet. Plus, Brexit has changed the picture a lot, so progress based on the work done the year before isn’t as inevitable as it perhaps was.
There is still a large capital gap regarding the US and China situations, but we can see very encouraging recent signals: the €100 billion EU Commission future fund and the €5 billion investment announcement from President Macron in France, for instance.
Antoine Hubert
Ÿnsect CEO
Steve O’Hear TechCrunch Journalist
03.1
Топ-20 крупнейших сделок по сбору средств при поддержке венчурных инвесторов в 2019 году (округлено)
Примечание
Dealroom.co исключают следующие данные: биотехнологии, вторичные сделки, долги, кредиты, гранты. Обратите также внимание, что эти данные не включают Израиль.
We are on an overall good wave: more capital, more startups from seed to large, late rounds, more exits. We should all keep up the good work to position Europe as the key place for technology!
Финансовые технологии
Корпоративное программное обеспечение
Здоровье
Энергетика
Транспорт
Еда
Маркетинг
Путешествия
Безопасность
Робототехника
Реклама
Недвижимость
Проведение мероприятий
Подбор персонала
Интернет Дом Игры
Образование
Мода Закон Связь
Финансовые технологии
Корпоративное программное обеспечение
Здоровье
Энергетика
Транспорт
Еда
Маркетинг
Путешествия
Безопасность
Робототехника
Реклама
Недвижимость
Проведение мероприятий
Подбор персонала
Интернет Дом Игры
Образование
Мода Закон Связь
Красота Хостинг музыка дети
Финансовые технологии
Корпоративное программное обеспечение
Health
Энергетика
Транспорт
Еда
Маркетинг
Путешествия
Безопасность
Робототехника
Реклама
Недвижимость
Дом
Мода
Связь Интернет
приборы
спорт меропр красота закон
Игры персонал музыка образов
Дети
03.2
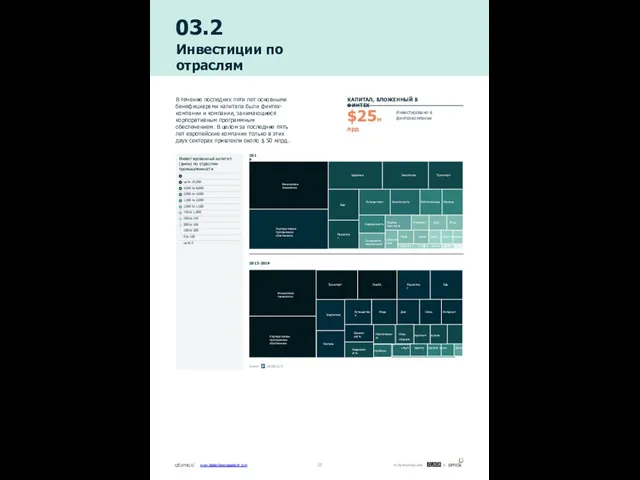
Инвестиции по отраслям
В течение последних пяти лет основными бенефициарами капитала были финтех-компании и компании, занимающиеся корпоративным программным обеспечением. В целом за последние пять лет европейские компании только в этих двух секторах привлекли около $ 50 млрд..
Инвестировано в финтехкомпании
КАПИТАЛ, ВЛОЖЕННЫЙ В ФИНТЕХ
$25млрд
2015-2019
2019
Инвестированный капитал ($млн) по отраслям промышленности
up to 10,000
4,000 to 8,000
2,000 to 4,000
1,500 to 2,000
1,000 to 1,500
750 to 1,000
500 to 750
200 to 500
100 to 200
0 to 100
up to 0
www.stateofeuropeantech.com
In Partnership with
&
Тем не менее, существует высокий уровень разнообразия с точки зрения потоков
Тем не менее, существует высокий уровень разнообразия с точки зрения потоков
Investment by Industry
03.2
Capital invested ($M)
2015
2016
2017
2018
2019
0
2,500
5,000
7,500
Capital invested ($M)
2015
2016
2017
2018
2019
0
500
1,000
1,500
Capital invested ($M)
2015
2016
2017
2018
2019
0
250
500
750
1,000
1,250
Capital invested ($M)
2015
2016
2017
2018
2019
0
250
500
750
1,000
1,250
Capital invested ($M)
2015 2016 2017 2018 2019
0
250
500
750
1,000
$2млрд+ в 2019
$1млрд - $2млрд в 2019
2,000
$250M - $500M в 2019
$500M - $1млрд в 2019
< $250M в 2019
Капитал инвестированный в индустрии
Финтех
Прог обеспечение
Здоровье
Энергетика Транспорт
Еда Маркетинг
LEGEND
Туризм БезопасРоботы Реклама
Недвижимость
LEGEND
Мероприятия
НаемперсоналаДом
Интернет
Игры
Образование
Мода
закон
LEGEND
Связь Спорт
Приборы Красота
LEGEND
Хостинг МузыкаДети
www.stateofeuropeantech.com
In Partnership with
&
www.stateofeuropeantech.com 27 In Partnership with &
Investment by Industry
03.2
Я считаю, что сейчас в Европе есть
www.stateofeuropeantech.com 27 In Partnership with &
Investment by Industry
03.2
Я считаю, что сейчас в Европе есть
Akshay Naheta Инвестиционный Консультант SoftBank управляющий партнер
Европейские технологические компании в области финтеха, корпоративного программного обеспечения, энергетики, здравоохранения и продовольствия стали самыми крупными бенефициарами возросших инвестиций в 2019 году, в совокупности увидев прирост капитала более чем на 11 миллиардов долларов по сравнению с 2018 годом.
$3,929M
$-53M
$-141M
M
$-308
$-333
M
$-399M
$-424M
$-757M
финтех
Прогр обеспечение
энергетика
здоровье
еда
безопасность
туризм
мероприятия
маркетинг
персонал
недвижимость
роботы
закон
игры
образование
реклама
итернет
транспорт
дом
мода
-1,000
-500 0
500
1,000
1,500 2,000
YoY growth ($M)
2,500
3,000
3,500
4,000
Абсолютное изменение по отраслевой вертикали инвестированного капитала ($млн), 2018 г. по сравнению с 2019 г.
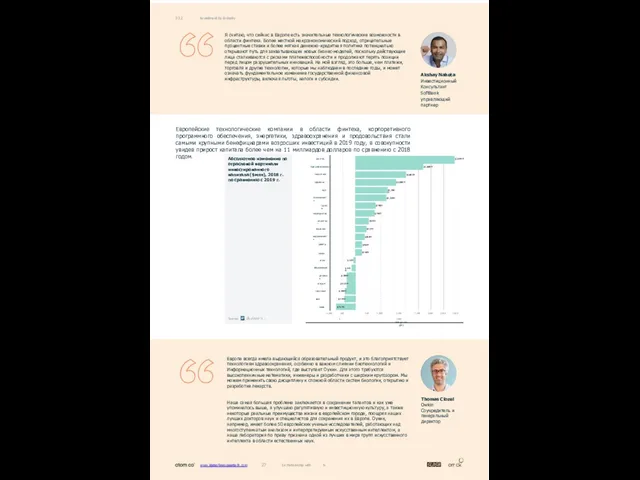
Европа всегда имела выдающийся образовательный продукт, и это благоприятствует технологиям здравоохранения, особенно в важном слиянии биотехнологий и Информационных технологий, где выступает Оукин. Для этого требуются высокотехничные математики, инженеры и разработчики с широким кругозором. Мы можем применить свою дисциплину к сложной области систем биологии, открытию и разработке лекарств.
Наша самая большая проблема заключается в сохранении талантов и как уже упоминалось выше, я улучшаю регулятивную и инвестиционную культуру, а также некоторые реальные преимущества жизни в европейском городе, поощряя наших лучших докторов наук и специалистов для сохранения их в Европе. Оукин, например, имеет более 50 европейских ученых-исследователей, работающих над многоступенчатым анализом и интерпретируемым искусственным интеллектом, а наша лаборатория по праву признана одной из лучших в мире групп искусственного интеллекта в области естественных наук.
Thomas Clozel
Owkin
Соучредитель и генеральный директор
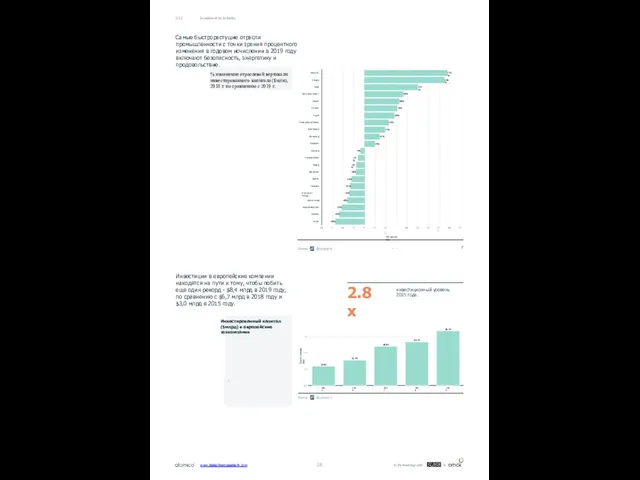
Самые быстрорастущие отрасли промышленности с точки зрения процентного изменения в годовом
Самые быстрорастущие отрасли промышленности с точки зрения процентного изменения в годовом
Инвестиции в европейские компании находятся на пути к тому, чтобы побить еще один рекорд - $8,4 млрд в 2019 году, по сравнению с $6,7 млрд в 2018 году и $3,0 млрд в 2015 году.
инвестиционный уровень 2015 года.
2.8x
Investment by Industry
03.2
193%
186%
124%
90%
80%
76%
69%
56%
47%
34%
23%
-9%
-15%
-19%
-20%
-30%
-33%
-35%
-40%
-53%
-59%
-68%
Security
Energy
Food
Jobs recruitment
Health
Fintech
Travel
Enterprise software
Real estate
Marketing
Robotics
Gaming
Transportation
Media
Education
Sports
Telecom
Internet of Things
Home living
Semiconductors
Fashion
Music
-100
-75
-50
-25
0
25
50 75
YoY growth (%)
100
125
150
175
200
225
Capital invested ($B)
$3.0B
$3.9B
$6.0B
$6.7B
$8.4B
2015
2016
2017
2018
2019
0.0
2.5
5.0
7.5
% изменение отраслевой вертикали инвестированного капитала ($млн), 2018 г. по сравнению с 2019 г.
Инвестированный капитал ($млрд) в европейские техкомпании
:
www.stateofeuropeantech.com
In Partnership with
&
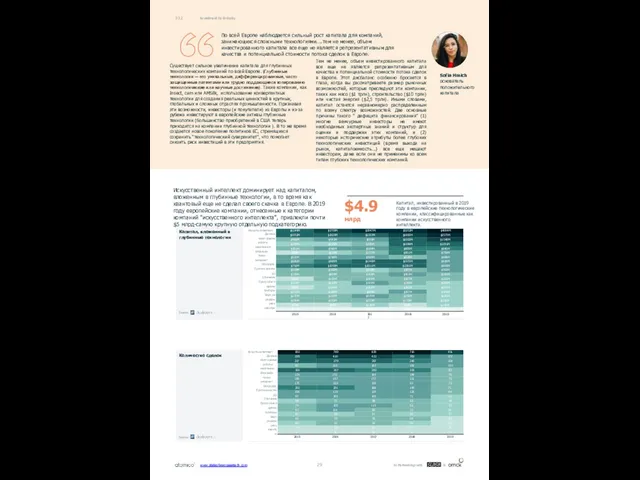
Искусственный интеллект доминирует над капиталом, вложенным в глубинные технологии, в то
Искусственный интеллект доминирует над капиталом, вложенным в глубинные технологии, в то
Капитал, инвестированный в 2019 году в европейские технологические компании, классифицированные как компании искусственного интеллекта.
$4.9млрд
По всей Европе наблюдается сильный рост капитала для компаний, занимающихся сложными технологиями....тем не менее, объем инвестированного капитала все еще не является репрезентативным для качества и потенциальной стоимости потока сделок в Европе.
Существует сильное увеличение капитала для глубинных технологических компаний по всей Европе. (Глубинные технологии — это уникальные, дифференцированные, часто защищенные патентами или трудно поддающиеся копированию технологические или научные достижения). Такие компании, как Insect, cam или AMSilk, использование конвергентных технологии для создания реальных ценностей в крупных, глобальных и сложных отраслях промышленности. Признавая эти возможности, инвесторы (и покупатели) из Европы и из-за рубежа инвестируют в европейские активы глубинные технологии (большинство приобретений в США теперь приходится на компании глубинной технологии ). В то же время создается новое поколение политиков ЕС, стремящихся сохранить “технологический суверенитет", что помогает снизить риск инвестиций в эти предприятия.
Sofia Hmich основатель положительного капитала
Investment by Industry
03.2
2015
2016
2017
2018
2019
Искуств.интеллект
Данные комп зрение
роботы нанотехнол. Блокчейн
поиск интернет
Оборудов. Прогноз.анализ
3D
Обучение
Прогр обесп
дроны приборы
Вирт ре
радары
речь
квантум
2015
2016
2017
2018
2019
Искуств.интеллект
Данные комп зрение
роботы нанотехно Блокчейн
поиск интернет
Оборудов. Прогноз.анализ
3D
Обучение
Прогр обесп
дроны приборы
Вирт радары
речь
квантум
Капитал, вложенный в глубинные технологии
Количество сделок
Тем не менее, объем инвестированного капитала все еще не является репрезентативным для качества и потенциальной стоимости потока сделок в Европе. Этот дисбаланс особенно бросается в глаза, когда вы рассматриваете размер рыночных возможностей, которые преследуют эти компании, таких как мясо ($1 трлн), строительство ($10 трлн) или чистая энергия ($2,5 трлн). Иными словами, капитал остается неравномерно распределенным по всему спектру возможностей. Две основные причины такого " дефицита финансирования” (1) многие венчурные инвесторы не имеют необходимых экспертных знаний и структур для оценки и поддержки этих компаний, и (2) некоторые исторические атрибуты более глубоких технологических инвестиций (время выхода на рынок, капиталоемкость...) все еще мешают инвесторам, даже если они не применимы ко всем типам глубоких технологических компаний.
www.stateofeuropeantech.com
In Partnership with
&
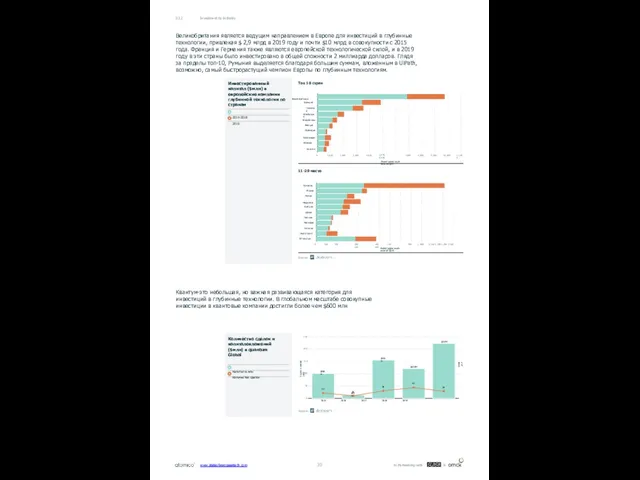
Великобритания является ведущим направлением в Европе для инвестиций в глубинные технологии,
Великобритания является ведущим направлением в Европе для инвестиций в глубинные технологии,
Квантум-это небольшая, но важная развивающаяся категория для инвестиций в глубинные технологии. В глобальном масштабе совокупные инвестиции в квантовые компании достигли более чем $600 млн
Investment by Industry
03.2
11-20 место
Топ 10 стран
Великобритания
Франция
Германия
Швейцария
Нидерланды
Швеция
Ирландия
Финляндия
Испания
Бельгия
0
1,000
2,000
3,000
4,000
5,000 6,000
Инвестированный капитал($M)
7,000
8,000
9,000
10,000
11,000
Инвестированный капитал ($M)
Румыния
Италия
Россия
Норвегия
Австрия
Дания
Польша
Исландия
Эстония
Португалия
Остальные
0
100
200 300 400 500 600
700 800
900
1,000
1,100 1,200 1,300 1,400
Инвестированный капитал ($млн) в европейские компании глубинной технологии по странам
2014-2018
2019
Capital invested ($M)
# of deals
$101M
$13M
$155M
$120M
$222M
21
10
30
43
28
2015 2016 2017 2018 2019
0
50
100
150
200
250
Количество сделок и капиталовложений ($млн) в quantum Global
Капитал в млн
Количество сделок
www.stateofeuropeantech.com
In Partnership with
&
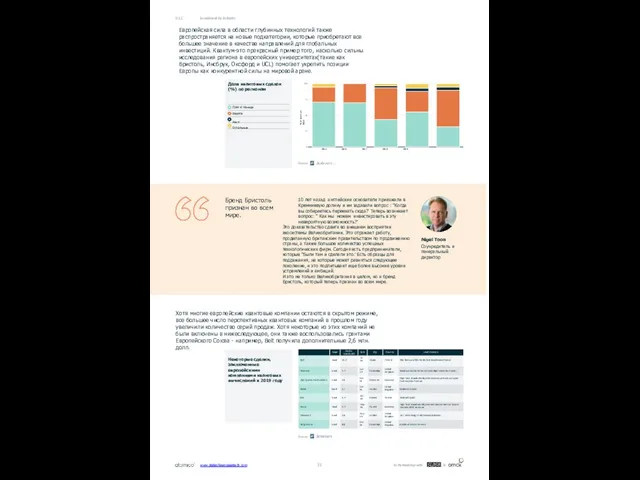
Европейская сила в области глубинных технологий также распространяется на новые подкатегории,
Европейская сила в области глубинных технологий также распространяется на новые подкатегории,
Хотя многие европейские квантовые компании остаются в скрытом режиме, все большее число перспективных квантовых компаний в прошлом году увеличили количество серий продаж. Хотя некоторые из этих компаний не были включены в нижеследующее, они также воспользовались грантами Европейского Союза - например, Beit получила дополнительные 2,6 млн. долл.
Бренд Бристоль признан во всем мире.
10 лет назад английские основатели приезжали в Кремниевую долину и им задавали вопрос : "Когда вы собираетесь переехать сюда?’ Теперь возникает вопрос: " Как мы можем инвестировать в эту невероятную возможность?’
Это доказательство сдвига во внешнем восприятии экосистемы Великобритании. Это отражает работу, проделанную британским правительством по продвижению страны, а также большое количество успешных технологических фирм. Сегодня есть предприниматели, которые "были там и сделали это.’ Есть образцы для подражания, на которые может равняться следующее поколение, и это подпитывает еще более высокие уровни устремлений и амбиций.
И это не только Великобритания в целом, но и бренд Бристоль, который теперь признан во всем мире.
Nigel Toon
Соучредитель и генеральный директор
Investment by Industry
03.2
% of quantum deals
2015 2016 2017 2018 2019
0
25
50
75
100
Доля квантовых сделок (%) по регионам
США И Канада
Европа
Азия
Остальные
Некоторые сделки, заключенные европейскими компаниями квантовых вычислений в 2019 году
www.stateofeuropeantech.com
In Partnership with
&
03.3
География инвестиций
Суммарные капитальные вложения с 2015 года превысили $ 10 млрд
03.3
География инвестиций
Суммарные капитальные вложения с 2015 года превысили $ 10 млрд
11-20
другие
Топ 10 стран
Capital invested ($M)
Великобритания Германия
Франция
Швеция
Испания
Швейцария Нидерланды
Исландия
Финляндия
Италия
0
10,000
20,000
30,000
40,000
Capital invested ($M)
Россия
Дания
Бельгия
Румыния
Норвегия
Люксембург Австрия
Польша
Португалия
Эстония
0
500
1,000
1,500
2,000
Capital invested ($M)
Кипр Турция Исландия Литва Венгрия Хорватия Чехия Гернси Украина Монтенегро
0
100
200
300
400
Инвестированный капитал ($млн) по странам в год с 2015
2015
2016
2017
2018
2019
www.stateofeuropeantech.com
In Partnership with
&
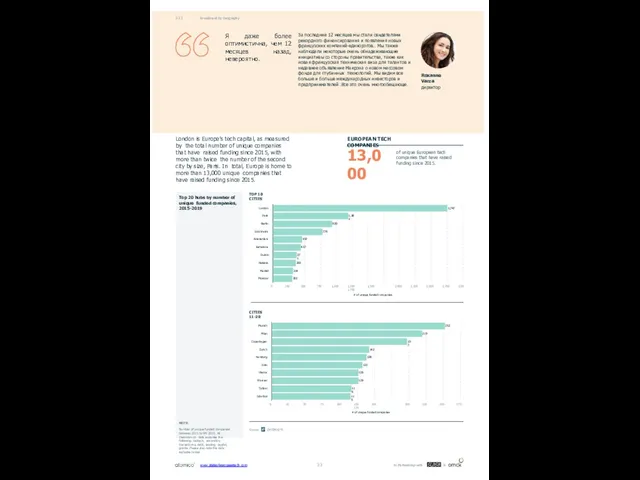
2,747
1,183
930
776
457
437
371
359
314
302
London
Paris
Berlin
Stockholm
Amsterdam
Barcelona
Dublin
Helsinki
Madrid
Moscow
0
250
500
750
1,000
1,250 1,500 1,750
# of unique funded companies
2,000
2,250
2,500
2,750
3,00
Я даже более оптимистична, чем 12 месяцев
2,747
1,183
930
776
457
437
371
359
314
302
London
Paris
Berlin
Stockholm
Amsterdam
Barcelona
Dublin
Helsinki
Madrid
Moscow
0
250
500
750
1,000
1,250 1,500 1,750
# of unique funded companies
2,000
2,250
2,500
2,750
3,00
Я даже более оптимистична, чем 12 месяцев
За последние 12 месяцев мы стали свидетелями рекордного финансирования и появления новых французских компаний-единорогов.. Мы также наблюдали некоторые очень обнадеживающие инициативы со стороны правительства, такие как новая французская техническая виза для талантов и недавнее объявление Макрона о новом массовом фонде для глубинных технологий. Мы видим все больше и больше международных инвесторов и предпринимателей .Все это очень многообещающе.
Roxanne Varza директор
Investment by Geography
03.3
London is Europe’s tech capital, as measured by the total number of unique companies that have raised funding since 2015, with more than twice the number of the second city by size, Paris. In total, Europe is home to more than 13,000 unique companies that have raised funding since 2015.
of unique European tech companies that have raised funding since 2015.
EUROPEAN TECH COMPANIES
13,000
CITIES 11-20
TOP 10 CITIES
252
219
197
142
138
132
126
126
116
115
Munich
Milan
Copenhagen
Zurich
Hamburg
Oslo
Vienna
Warsaw
Tallinn
Istanbul
0
25
50
75
100
125 150 175
# of unique funded companies
200
225
250
275
Top 20 hubs by number of unique funded companies, 2015-2019
NOTE:
Number of unique funded companies between 2015 to 9M 2019. All Dealroom.co data excludes the following: biotech, secondary transactions, debt, lending capital, grants. Please also note the data excludes Israel.
www.stateofeuropeantech.com
In Partnership with
&
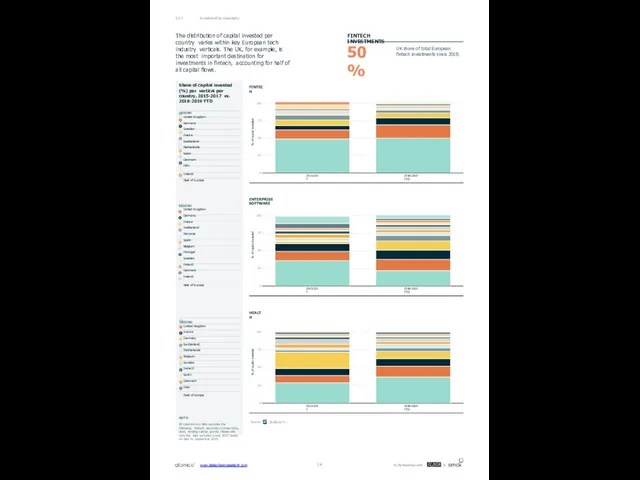
% of capital invested
2015-2017
2018-2019 YTD
0
25
50
75
100
% of capital invested
2015-2017
2018-2019 YTD
0
25
50
75
100
% of capital
% of capital invested
2015-2017
2018-2019 YTD
0
25
50
75
100
% of capital invested
2015-2017
2018-2019 YTD
0
25
50
75
100
% of capital
2015-2017
2018-2019 YTD
0
25
50
75
100
Investment by Geography
03.3
The distribution of capital invested per country varies within key European tech industry verticals. The UK, for example, is the most important destination for investments in fintech, accounting for half of all capital flows.
UK share of total European
fintech investments since 2018.
FINTECH INVESTMENTS
50%
FINTECH
ENTERPRISE SOFTWARE
HEALTH
Share of capital invested (%) per vertical per country, 2015-2017 vs. 2018-2019 YTD
LEGEND
United Kingdom Germany Sweden
France Switzerland Netherlands Spain Denmark Italy
Ireland
Rest of Europe
LEGEND
United Kingdom Germany France Switzerland Romania
Spain Belgium Portugal Sweden Finland Denmark Ireland
Rest of Europe
LEGEND
United Kingdom France Germany Switzerland Netherlands Belgium Sweden
Ireland Spain Denmark Italy
Rest of Europe
NOTE:
All Dealroom.co data excludes the following: biotech, secondary transactions, debt, lending capital, grants. Please also note the data excludes Israel. 2019 based on data to September 2019.
www.stateofeuropeantech.com
In Partnership with
&
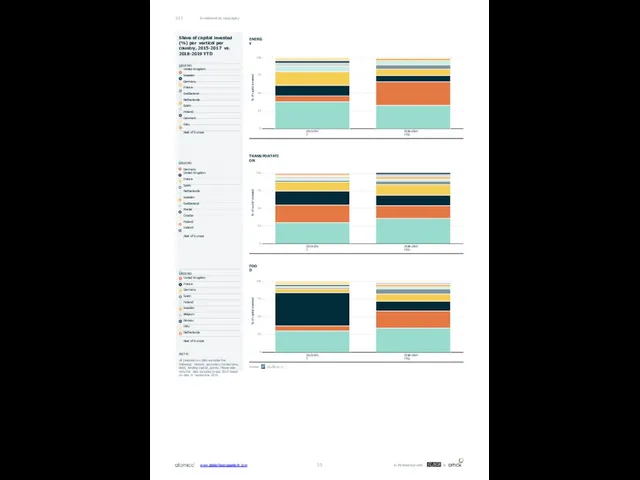
% of capital invested
2015-2017
2018-2019 YTD
0
25
50
75
100
% of capital invested
2015-2017
2018-2019 YTD
0
25
50
75
100
% of capital
% of capital invested
2015-2017
2018-2019 YTD
0
25
50
75
100
% of capital invested
2015-2017
2018-2019 YTD
0
25
50
75
100
% of capital
2015-2017
2018-2019 YTD
0
25
50
75
100
Share of capital invested (%) per vertical per country, 2015-2017 vs. 2018-2019 YTD
LEGEND
United Kingdom Sweden Germany France Switzerland Netherlands Spain
Finland Denmark Italy
Rest of Europe
LEGEND
Germany
United Kingdom France
Spain Netherlands Sweden Switzerland Russia Croatia Finland Ireland
Rest of Europe
LEGEND
United Kingdom France Germany
Spain Finland Sweden Belgium Norway Italy Netherlands
Rest of Europe
NOTE:
All Dealroom.co data excludes the following: biotech, secondary transactions, debt, lending capital, grants. Please also note the data excludes Israel. 2019 based on data to September 2019.
Investment by Geography
03.3
ENERGY
TRANSPORTATION
FOOD
www.stateofeuropeantech.com
In Partnership with
&
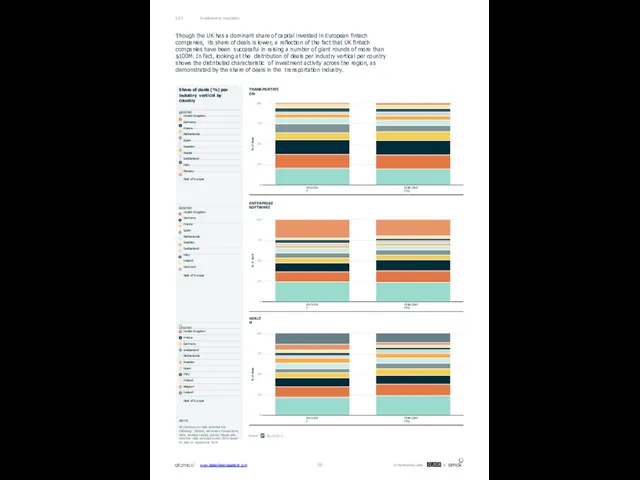
% of deals
2015-2017
2018-2019 YTD
0
25
50
75
100
% of deals
2015-2017
2018-2019 YTD
0
25
50
75
100
% of deals
2015-2017
2018-2019 YTD
0
25
50
75
100
Investment by
% of deals
2015-2017
2018-2019 YTD
0
25
50
75
100
% of deals
2015-2017
2018-2019 YTD
0
25
50
75
100
% of deals
2015-2017
2018-2019 YTD
0
25
50
75
100
Investment by
03.3
Though the UK has a dominant share of capital invested in European fintech companies, its share of deals is lower, a reflection of the fact that UK fintech companies have been successful in raising a number of giant rounds of more than $100M. In fact, looking at the distribution of deals per industry vertical per country shows the distributed characteristic of investment activity across the region, as demonstrated by the share of deals in the transportation industry.
TRANSPORTATION
ENTERPRISE SOFTWARE
HEALTH
Share of deals (%) per industry vertical by country
LEGEND
United Kingdom Germany France Netherlands Spain
Sweden Russia Switzerland Italy Norway
Rest of Europe
LEGEND
United Kingdom Germany France
Spain Netherlands Sweden Switzerland Italy
Ireland Denmark
Rest of Europe
LEGEND
United Kingdom France Germany Switzerland Netherlands Sweden
Spain Italy Finland Belgium Ireland
Rest of Europe
NOTE:
All Dealroom.co data excludes the following: biotech, secondary transactions, debt, lending capital, grants. Please also note the data excludes Israel. 2019 based on data to September 2019.
www.stateofeuropeantech.com
In Partnership with
&
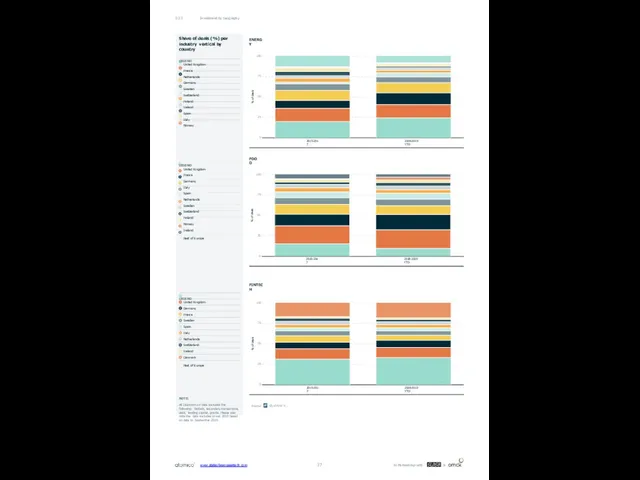
Investment by Geography
03.3
ENERGY
FOOD
FINTECH
% of deals
2015-2017
2018-2019 YTD
0
25
50
75
100
% of deals
2015-2017
2018-2019 YTD
0
25
50
75
100
% of deals
2015-2017
2018-2019
Investment by Geography
03.3
ENERGY
FOOD
FINTECH
% of deals
2015-2017
2018-2019 YTD
0
25
50
75
100
% of deals
2015-2017
2018-2019 YTD
0
25
50
75
100
% of deals
2015-2017
2018-2019
0
25
50
75
100
Share of deals (%) per industry vertical by country
LEGEND
United Kingdom France Netherlands Germany Sweden Switzerland Finland
Ireland Spain Italy Norway
LEGEND
United Kingdom France Germany
Italy Spain
Netherlands Sweden Switzerland Finland Norway Ireland
Rest of Europe
LEGEND
United Kingdom Germany France
Sweden Spain Italy
Netherlands Switzerland Ireland Denmark
Rest of Europe
NOTE:
All Dealroom.co data excludes the following: biotech, secondary transactions, debt, lending capital, grants. Please also note the data excludes Israel. 2019 based on data to September 2019.
www.stateofeuropeantech.com
In Partnership with
&

www.stateofeuropeantech.com
In Partnership with
&
www.stateofeuropeantech.com
In Partnership with
&

www.stateofeuropeantech.com
In Partnership with
&
www.stateofeuropeantech.com
In Partnership with
&

www.stateofeuropeantech.com
In Partnership with
&
www.stateofeuropeantech.com
In Partnership with
&

www.stateofeuropeantech.com
In Partnership with
&
www.stateofeuropeantech.com
In Partnership with
&

www.stateofeuropeantech.com
In Partnership with
&
www.stateofeuropeantech.com
In Partnership with
&
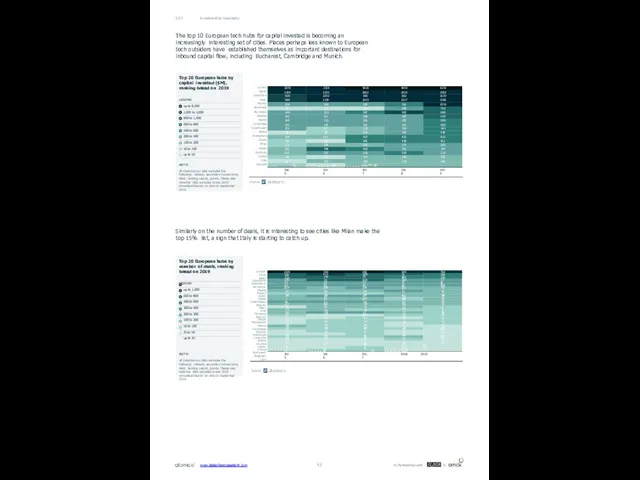
Investment by Geography
03.3
The top 10 European tech hubs for capital invested
Investment by Geography
03.3
The top 10 European tech hubs for capital invested
Similarly on the number of deals, it is interesting to see cities like Milan make the top 15% list, a sign that Italy is starting to catch up.
2015
2016
2017
2018
2019
London Berlin Stockholm
Paris
Munich Bucharest Barcelona Helsinki Madrid Cambridge Copenhagen
Bristol Amsterdam
Zurich Milan Dublin Hamburg Oxford Oslo Brussels
30
19 20
22
19
39
32
22 21
17
16
14
12 23
23
15
24
13
25
19
32
18
23
23
33
29
30
77
23
32
21
20
33
39
23
36
27
31
26
24
20
25
25
25
55
36
23
23
25
16
22
50
38
38
22
47
45
28
49
28
20
34
23
19
36
36
35
28
25
80
104
110
72
39
53
40
41
15
51
55
53
38
67
41
73
82
78
88
53
114
135
122
87
56
71
67
83
50
59
74
182
126
84
64
114
92
37
100
84
39
102
84
49
83
101
55
83
67
65
137
157
161
131
108
151
127
137
114
117
170
321
334
200
177
349
321
266
319
326
411
399
315
300
249
1035
993
952
655
788
2015
2016
2017
2018 2019
13
London
Paris
Berlin Stockholm
Amsterdam
Barcelona
Madrid
Munich Zurich
Dublin
Copenhagen
Helsinki Milan
Oslo
Hamburg
Moscow Vilnius
Manchester
Vienna
Cambridge
Warsaw Edinburgh
Lausanne
Bristol
Istanbul Lisbon
Oxford
Bucharest
Budapest
Lyon
Top 20 European hubs by capital invested ($M), ranking based on 2019
LEGEND
up to 8,000
1,000 to 4,000
800 to 1,000
600 to 800
400 to 600
200 to 400
100 to 200
50 to 100
up to 50
NOTE:
All Dealroom.co data excludes the following: biotech, secondary transactions, debt, lending capital, grants. Please also note the data excludes Israel. 2019 annualised based on data to September 2019.
Top 20 European hubs by number of deals, ranking based on 2019
LEGEND
up to 1,000
600 to 800
400 to 600
300 to 400
200 to 300
100 to 200
50 to 100
25 to 50
up to 25
NOTE:
All Dealroom.co data excludes the following: biotech, secondary transactions, debt, lending capital, grants. Please also note the data excludes Israel. 2019 annualised based on data to September 2019.
www.stateofeuropeantech.com
In Partnership with
&
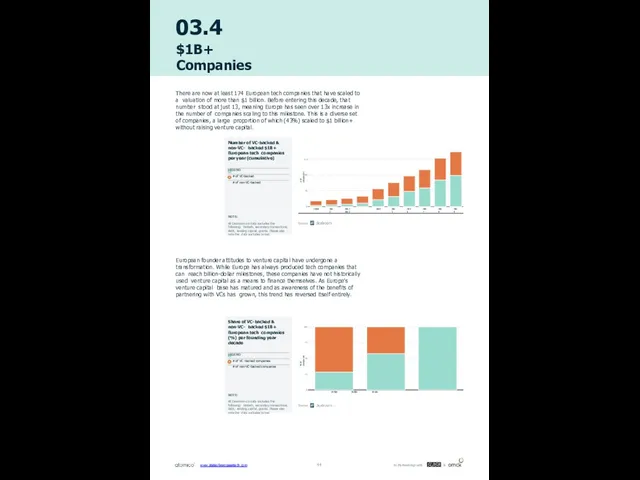
03.4
$1B+ Companies
There are now at least 174 European tech companies that
03.4
$1B+ Companies
There are now at least 174 European tech companies that
European founder attitudes to venture capital have undergone a transformation. While Europe has always produced tech companies that can reach billion-dollar milestones, these companies have not historically used venture capital as a means to finance themselves. As Europe’s venture capital base has matured and as awareness of the benefits of partnering with VCs has grown, this trend has reversed itself entirely.
# of companies
2010
2011
2012 2013
2014
2015
2016
2017
2018
2019
0
50
100
150
% of companies
1990s 2000s 2010s
0
25
50
75
100
Number of VC-backed & non-VC- backed $1B+ European tech companies per year (cumulative)
LEGEND
# of VC-backed
# of non-VC-backed
NOTE:
All Dealroom.co data excludes the following: biotech, secondary transactions, debt, lending capital, grants. Please also note the data excludes Israel.
Share of VC-backed & non-VC- backed $1B+ European tech companies (%) per founding year decade
LEGEND
# of VC -backed companies
# of non-VC-backed companies
NOTE:
All Dealroom.co data excludes the following: biotech, secondary transactions, debt, lending capital, grants. Please also note the data excludes Israel.
www.stateofeuropeantech.com
In Partnership with
&
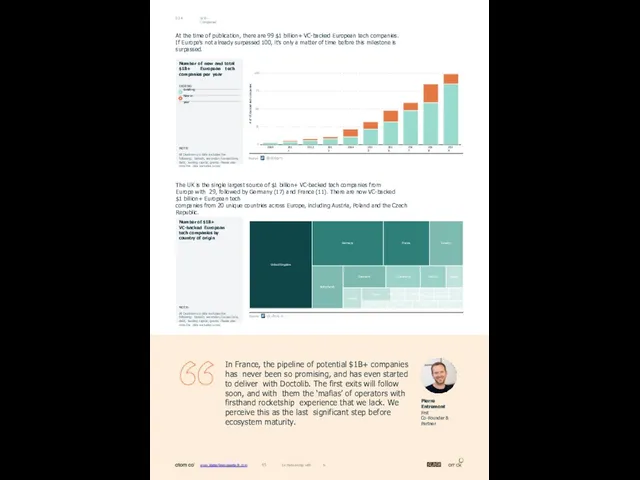
www.stateofeuropeantech.com 45 In Partnership with &
$1B+ Companies
03.4
At the time of publication, there are 99
www.stateofeuropeantech.com 45 In Partnership with &
$1B+ Companies
03.4
At the time of publication, there are 99
If Europe’s not already surpassed 100, it’s only a matter of time before this milestone is surpassed.
The UK is the single largest source of $1 billion+ VC-backed tech companies from Europe with 29, followed by Germany (17) and France (11). There are now VC-backed $1 billion+ European tech
companies from 20 unique countries across Europe, including Austria, Poland and the Czech Republic.
In France, the pipeline of potential $1B+ companies has never been so promising, and has even started to deliver with Doctolib. The first exits will follow soon, and with them the ‘mafias’ of operators with firsthand rocketship experience that we lack. We perceive this as the last significant step before ecosystem maturity.
Pierre Entremont
Frst
Co-Founder & Partner
# of VC-backed tech companies
2010
2011
2012
2013
2014
2015
2016
2017
2018
2019
0
25
50
75
100
United Kingdom
Germany
France
Sweden
Netherlands
Denmark
Switzerland
Ireland
Russia
Ireland
Spain
Czech RepublLicuxemburg Poland Ukraine Romania
Portugal
Austria
Estonia
Belgium
Number of new and total $1B+ European tech companies per year
LEGEND
Exisiting New in year
NOTE:
All Dealroom.co data excludes the following: biotech, secondary transactions, debt, lending capital, grants. Please also note the data excludes Israel.
Number of $1B+ VC-backed European tech companies by country of origin
NOTE:
All Dealroom.co data excludes the following: biotech, secondary transactions, debt, lending capital, grants. Please also note the data excludes Israel.
In Partnership with
&
www.stateofeuropeantech.com
In Partnership with
&
www.stateofeuropeantech.com
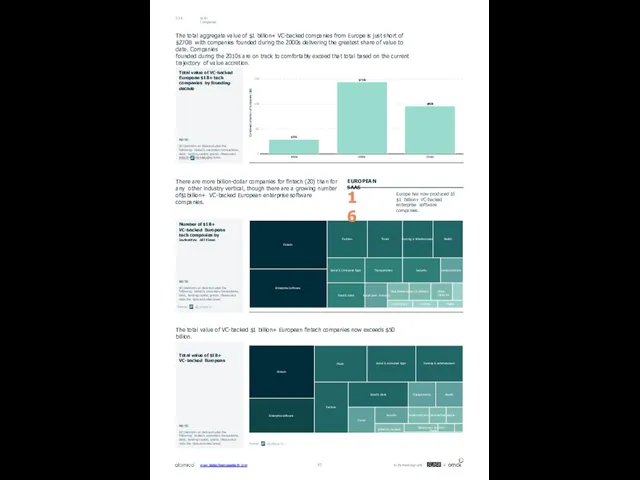
47
In Partnership with
&
www.stateofeuropeantech.com
$1B+ Companies
03.4
The total aggregate value of $1 billion+ VC-backed
47
In Partnership with
&
www.stateofeuropeantech.com
$1B+ Companies
03.4
The total aggregate value of $1 billion+ VC-backed
founded during the 2010s are on track to comfortably exceed that total based on the current trajectory of value accretion.
Combined valuation of companies ($B)
$29B
$144B
$96B
1990s
2000s
2010s
0
50
100
150
Fintech
Enterprise Software
Fashion
Travel
Gaming & Entertainment
Health
Social & Consumer Apps
Food & Drink
Transportation
Security
Semiconductors
Retail (excl. Fashion)
Real Estate Adtech & Martech
Music Classi ed
Construction
Hosting
Media
Fintech
Enterprise software
Music
Social & consumer Apps
Gaming & entertainment
Fashion
Food & drink
Transportation
Health
Travel
Security
Semiconductors Classi ed Real estate
Adtech & martech Retail (excl. fashion) ConstructionHosting
Media
There are more billion-dollar companies for fintech (20) than for any other industry vertical, though there are a growing number of$1billion+ VC-backed European enterprise software companies.
Europe has now produced 16 $1 billion+ VC-backed enterprise software companies.
EUROPEAN SAAS
16
Number of $1B+ VC-backed European tech companies by industry, all time
The total value of VC-backed $1 billion+ European fintech companies now exceeds $50 billion.
Total value of $1B+ VC-backed European tech companies by industry
Total value of VC-backed European $1B+ tech companies by founding decade
NOTE:
All Dealroom.co data excludes the following: biotech, secondary transactions, debt, lending capital, grants. Please also note the data excludes Israel.
NOTE:
All Dealroom.co data excludes the following: biotech, secondary transactions, debt, lending capital, grants. Please also note the data excludes Israel.
NOTE:
All Dealroom.co data excludes the following: biotech, secondary transactions, debt, lending capital, grants. Please also note the data excludes Israel.
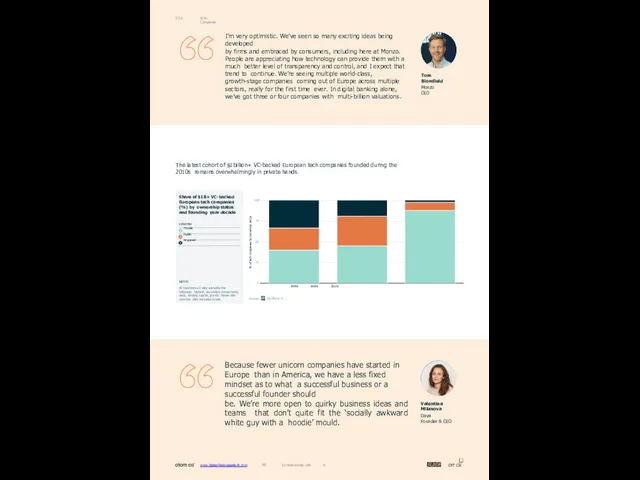
www.stateofeuropeantech.com 48 In Partnership with &
$1B+ Companies
03.4
The latest cohort of $1billion+ VC-backed European tech
www.stateofeuropeantech.com 48 In Partnership with &
$1B+ Companies
03.4
The latest cohort of $1billion+ VC-backed European tech
I’m very optimistic. We’ve seen so many exciting ideas being developed
by firms and embraced by consumers, including here at Monzo.
People are appreciating how technology can provide them with a much better level of transparency and control, and I expect that trend to continue. We’re seeing multiple world-class, growth-stage companies coming out of Europe across multiple sectors, really for the first time ever. In digital banking alone, we’ve got three or four companies with multi-billion valuations.
Because fewer unicorn companies have started in Europe than in America, we have a less fixed mindset as to what a successful business or a successful founder should
be. We’re more open to quirky business ideas and teams that don’t quite fit the ‘socially awkward white guy with a hoodie’ mould.
Tom Blomfield
Monzo CEO
Valentina Milanova
Daye
Founder & CEO
% of tech companies by ownership status
1990s 2000s 2010s
0
25
50
75
100
Share of $1B+ VC-backed European tech companies (%) by ownership status and founding year decade
LEGEND
Private Public Acquired
NOTE:
All Dealroom.co data excludes the following: biotech, secondary transactions, debt, lending capital, grants. Please also note the data excludes Israel.
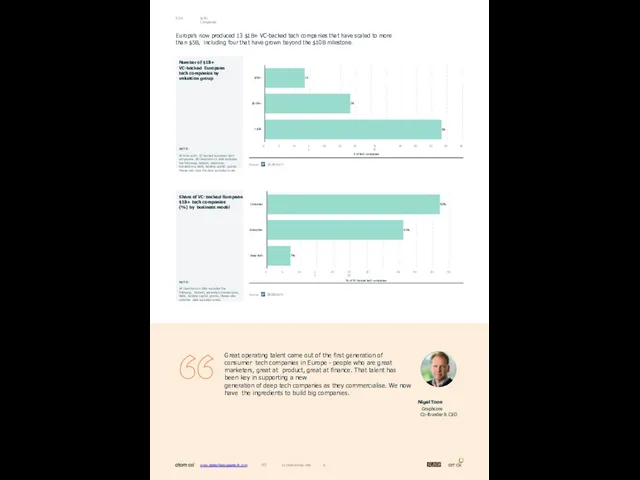
www.stateofeuropeantech.com 49 In Partnership with &
$1B+ Companies
03.4
Europe’s now produced 13 $1B+ VC-backed tech companies
www.stateofeuropeantech.com 49 In Partnership with &
$1B+ Companies
03.4
Europe’s now produced 13 $1B+ VC-backed tech companies
Great operating talent came out of the first generation of consumer tech companies in Europe - people who are great marketers, great at product, great at finance. That talent has been key in supporting a new
generation of deep tech companies as they commercialise. We now have the ingredients to build big companies.
Nigel Toon
Graphcore
Co-founder & CEO
13
28
58
$5B+
$2-5B+
<$2B
0
5
10
15
20
25
30 35 40
# of tech companies
45
50
55
60
65
52%
41%
7%
Consumer
Enterprise
Deep tech
0
5
10
15
20
25 30 35
% of VC-backed tech companies
40
45
50
55
Number of $1B+ VC-backed European tech companies by valuation group
NOTE:
All time $1B+ VC-backed European tech companies. All Dealroom.co data excludes the following: biotech, secondary transactions, debt, lending capital, grants. Please also note the data excludes Israel.
Share of VC-backed European
$1B+ tech companies (%) by business model
NOTE:
All Dealroom.co data excludes the following: biotech, secondary transactions, debt, lending capital, grants. Please also note the data excludes Israel.
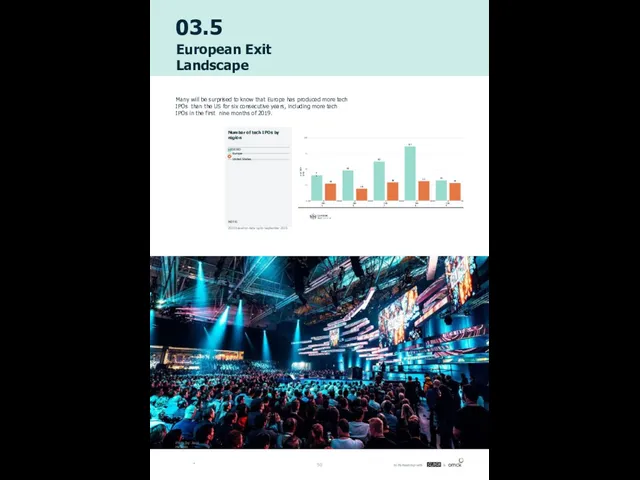
50
In Partnership with
&
03.5
European Exit Landscape
Many will be surprised to know that
50
In Partnership with
&
03.5
European Exit Landscape
Many will be surprised to know that
# of tech IPOs
41
49
63
87
33
28
20
30
32
29
2015
2016
2017
2018
2019
0
25
50
75
100
Number of tech IPOs by region
LEGEND
Europe United States
NOTE:
2019 based on data up to September 2019.
Photo by: Jussi Hellsten
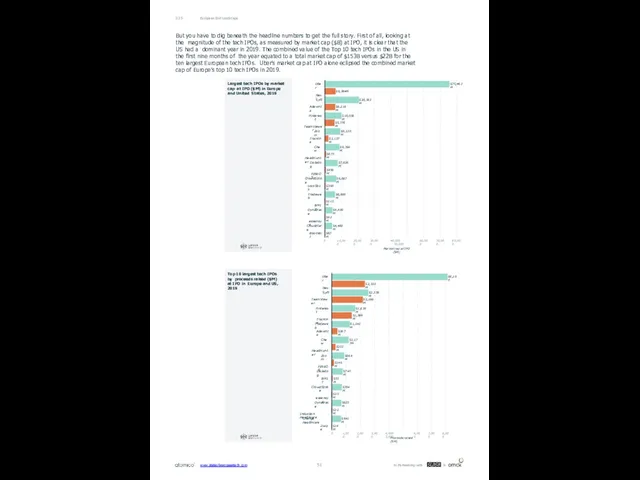
European Exit Landscape
03.5
But you have to dig beneath the headline numbers
European Exit Landscape
03.5
But you have to dig beneath the headline numbers
Uber
Nexi
S75,463M
S6,384M
Lyft
Adevinta
S20,583M
S6,218M
Pinterest
TeamViewer
S10,058M
S5,776M
Zoom
Trainline
S9,230M
S2,137M
Chew
HeadHunter
S9,769M
S675M
Datadog
FINEOS
S7,826M
S458M
CrowdStrike
LocoSoco
S6,687M
S390M
Tradeweb
BMIT
S6,000M
S113M
Dynatrace
essensys
S4,409M
S92M
CloudFlare
BoomBit
S4,400M
S67M
10,000
20,000
30,000
40,000 50,000
Market caр at IPO (SM)
60,000
70,000
80,000
0
Uber
Nexi
S8,100
S2,323M
Lyft
TeamViewer
S2,556M
S2,166M
Pinterest
Trainline
S1,639M
S1,389M
Tradeweb
Adevinta
S1,242M
S387M
Chew
HeadHunter
S1,177M
S253M
Zoom
FINEOS
S864M
S146M
Datadog
BMIT
S745M
S55M
CrowdStrike
essensys
S704M
S35M
Dynatrace
Induction Healthcare
S655M
S22M
Change Healthcare
Zwiрe
S641M
S14M
1,000
2,000
3,000
4,000 5,000
Proceeds raised (SM)
6,000
7,000
8,000
0
Largest tech IPOs by market cap at IPO ($M) in Europe and United States, 2019
Top 10 largest tech IPOs by proceeds raised ($M) at IPO in Europe and US, 2019
www.stateofeuropeantech.com
In Partnership with
&
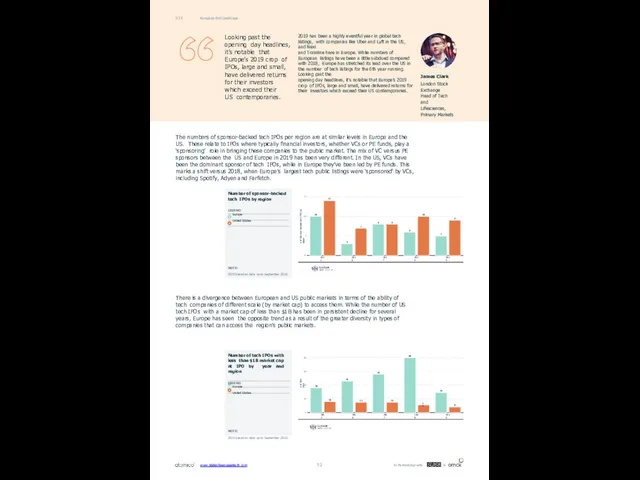
European Exit Landscape
03.5
The numbers of sponsor-backed tech IPOs per region are
European Exit Landscape
03.5
The numbers of sponsor-backed tech IPOs per region are
There is a divergence between European and US public markets in terms of the ability of tech companies of different scale (by market cap) to access them. While the number of US tech IPOs with a market cap of less than $1B has been in persistent decline for several years, Europe has seen the opposite trend as a result of the greater diversity in types of companies that can access the region’s public markets.
# of sponsor-backed tech IPOs by region
10
3
8
6
5
14
7
8
10
9
2015
2016
2017
2018
2019
0
5
10
15
# of tech IPOs
36
46
56
80
29
16
15
15
11
8
2015
2016
2017
2018
2019
0
20
40
60
80
Number of sponsor-backed tech IPOs by region
LEGEND
Europe United States
NOTE:
2019 based on data up to September 2019.
Number of tech IPOs with less than $1B market cap at IPO by year and region
LEGEND
Europe United States
NOTE:
2019 based on data up to September 2019.
Looking past the opening day headlines, it’s notable that Europe’s 2019 crop of IPOs, large and small, have delivered returns for their investors
which exceed their US contemporaries.
2019 has been a highly eventful year in global tech listings, with companies like Uber and Lyft in the US, and Nexi
and Trainline here in Europe. While numbers of European listings have been a little subdued compared with 2018, Europe has stretched its lead over the US in the number of tech listings for the 6th year running. Looking past the
opening day headlines, it’s notable that Europe’s 2019 crop of IPOs, large and small, have delivered returns for their investors which exceed their US contemporaries.
James Clark
London Stock Exchange
Head of Tech and Lifesciences, Primary Markets
www.stateofeuropeantech.com
In Partnership with
&
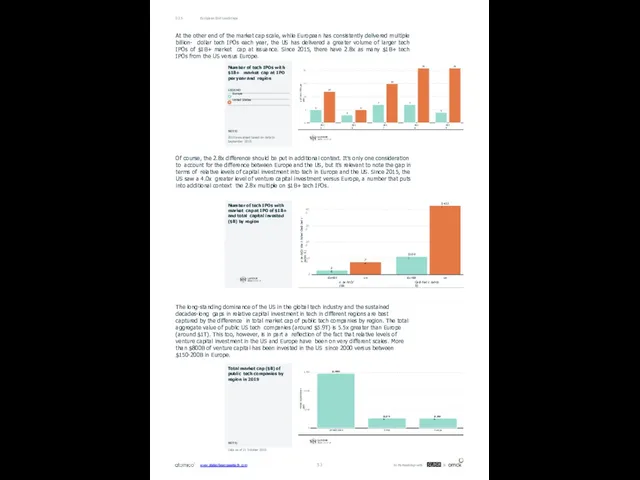
European Exit Landscape
03.5
Of course, the 2.8x difference should be put in
European Exit Landscape
03.5
Of course, the 2.8x difference should be put in
The long-standing dominance of the US in the global tech industry and the sustained decades-long gaps in relative capital investment in tech in different regions are best captured by the difference in total market cap of public tech companies by region. The total aggregate value of public US tech companies (around $5.9T) is 5.5x greater than Europe (around $1T). This too, however, is in part a reflection of the fact that relative levels of venture capital investment in the US and Europe have been on very different scales. More than $800B of venture capital has been invested in the US since 2000 versus between $150-200B in Europe.
o te htO/ ttla
EurtBt
us
26
74
EurtBt
CeB het c tahto S)
us
S109)
S423)
400
300
200
100
0
o te htO/ ttla t hthet OeB het c tahto S)
Market capitalisation ($B)
$5,880B
$1,070B
$1,060B
United States
China
Europe
0
2,000
4,000
6,000
Number of tech IPOs with market cap at IPO of $1B+ and total capital invested ($B) by region
Total market cap ($B) of public tech companies by region in 2019
NOTE:
Data as of 21 October 2019.
At the other end of the market cap scale, while European has consistently delivered multiple billion- dollar tech IPOs each year, the US has delivered a greater volume of larger tech IPOs of $1B+ market cap at issuance. Since 2015, there have 2.8x as many $1B+ tech IPOs from the US versus Europe.
# of tech IPOs per year
5
3
7
7
4
12
5
15
21
21
2015
2016
2017
2018
2019
0
5
10
15
20
Number of tech IPOs with $1B+ market cap at IPO per year and region
LEGEND
Europe United States
NOTE:
2019 annualised based on data to September 2019.
www.stateofeuropeantech.com
In Partnership with
&
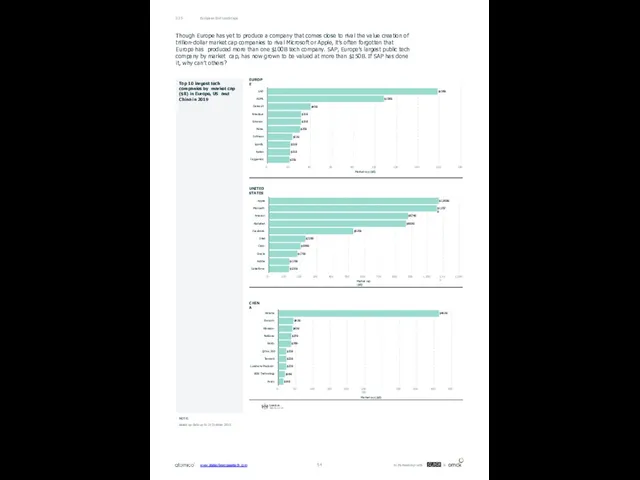
European Exit Landscape
03.5
Though Europe has yet to produce a company that
European Exit Landscape
03.5
Though Europe has yet to produce a company that
trillion-dollar market cap companies to rival Microsoft or Apple, it’s often forgotten that Europe has produced more than one $100B tech company. SAP, Europe’s largest public tech company by market cap, has now grown to be valued at more than $150B. If SAP has done it, why can’t others?
$158B
$108B
$40B
$31B
$31B
$30B
$23B
$21B
$21B
$20B
SAP
ASML
Dassault
Amadeus
Ericsson
Nokia
Infineon
Spotify
Ayden
Capgemini
0
20
40
60
80
100
Market cap ($B)
120
140
160
180
$1,068B
$1,057B
$874B
$863B
$530B
$228B
$198B
$179B
$129B
$126B
Apple
Microsoft
Amazon
Alphabet
Facebook
Intel
Cisco
Oracle
Adobe
Salesforce
0
100
200
300
400
500
600
Market cap ($B)
700
800
900
1,000
1,100
1,200
$463B
$43B
$40B
$37B
$36B
$22B
$22B
$22B
$18B
$14B
Alibaba
Foxconn
Hikvision
NetEase
Baidu
Qihoo 360
Tencent
Luxshare Precision
BOE Technology
Avary
0
50
100
150
200
250 300
Market cap ($B)
350
400
450
500
Top 10 largest tech companies by market cap ($B) in Europe, US and China in 2019
NOTE:
Based up data up to 21 October 2019.
EUROPE
UNITED STATES
CHINA
www.stateofeuropeantech.com
In Partnership with
&
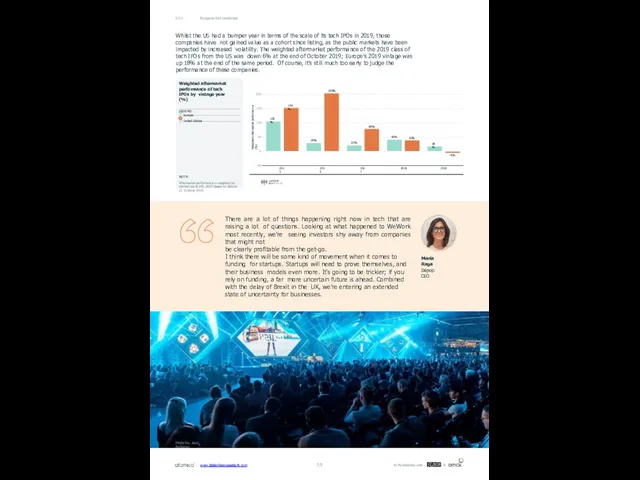
European Exit Landscape
03.5
Whilst the US had a bumper year in terms
European Exit Landscape
03.5
Whilst the US had a bumper year in terms
Weighted aftermarket performance (%)
106%
30%
22%
42%
18%
154%
205%
80%
40%
-6%
2015
2016
2017
2018
2019
-50
0
50
100
150
200
Weighted aftermarket performance of tech IPOs by vintage year (%)
LEGEND
Europe United States
NOTE:
Aftermarket performance is weighted by market cap at IPO. 2019 based on data to 21 October 2019.
There are a lot of things happening right now in tech that are raising a lot of questions. Looking at what happened to WeWork most recently, we’re seeing investors shy away from companies that might not
be clearly profitable from the get-go.
I think there will be some kind of movement when it comes to funding for startups. Startups will need to prove themselves, and their business models even more. It’s going to be trickier; if you rely on funding, a far more uncertain future is ahead. Combined with the delay of Brexit in the UK, we’re entering an extended state of uncertainty for businesses.
Maria Raga
Depop CEO
Photo by: Jussi Railainen
www.stateofeuropeantech.com
In Partnership with
&
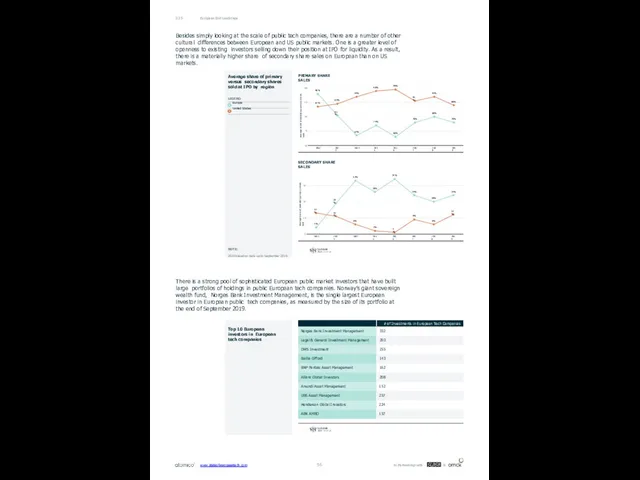
European Exit Landscape
03.5
Besides simply looking at the scale of public tech
European Exit Landscape
03.5
Besides simply looking at the scale of public tech
Average share of secondary/primary shares sold
96%
81%
67%
74%
66%
76%
80%
76%
87%
89%
94%
98%
99%
91%
94%
88%
2012
2013
2014
2015
2016
2017
2018
2019
60
70
80
90
100
Average share of secondary/primary shares sold
4%
19%
33%
26%
34%
24%
20%
24%
13%
11%
6%
2%
1%
9%
6%
12%
2012
2013
2014
2015
2016
2017
2018
2019
0
10
20
30
Average share of primary versus secondary shares sold at IPO by region
LEGEND
Europe United States
NOTE:
2019 based on data up to September 2019.
PRIMARY SHARE SALES
SECONDARY SHARE SALES
There is a strong pool of sophisticated European public market investors that have built large portfolios of holdings in public European tech companies. Norway’s giant sovereign wealth fund, Norges Bank Investment Management, is the single largest European investor in European public tech companies, as measured by the size of its portfolio at the end of September 2019.
Top 10 European investors in European tech companies
www.stateofeuropeantech.com
In Partnership with
&
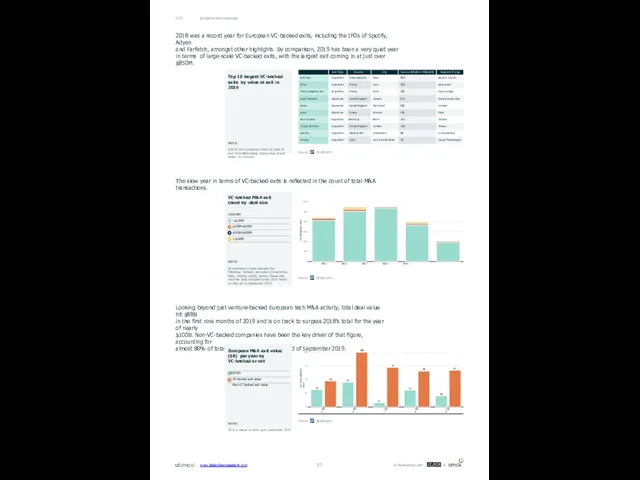
European Exit Landscape
03.5
2018 was a record year for European VC-backed exits,
European Exit Landscape
03.5
2018 was a record year for European VC-backed exits,
and Farfetch, amongst other highlights. By comparison, 2019 has been a very quiet year in terms of large-scale VC-backed exits, with the largest exit coming in at just over $850M.
Top 10 largest VC-backed exits by value at exit in 2019
NOTE:
EUR to USD conversion taken by date of exit from Bloomberg; Graze value at exit based on rumours.
The slow year in terms of VC-backed exits is reflected in the count of total M&A transactions.
Looking beyond just venture-backed European tech M&A activity, total deal value hit $88B
in the first nine months of 2019 and is on track to surpass 2018’s total for the year of nearly
$100B. Non-VC-backed companies have been the key driver of that figure, accounting for
almost 80% of total deal value up until the end of September 2019.
VC-backed exit count
2015 2016 2017 2018 2019
0
100
200
300
400
500
600
Exit value ($B)/exit count
32
45
8
31
20
48
100
72
66
67
2015
2016
2017
2018
2019
0
25
50
75
100
VC-backed M&A exit count by deal size
LEGEND
<$100M
$100M-$250M
$250M-$500M
>$500M
NOTE:
All Dealroom.co data excludes the following: biotech, secondary transactions, debt, lending capital, grants. Please also note the data excludes Israel. 2019 based on data up to September 2019.
European M&A exit value ($B) per year by VC-backed or not
LEGEND
VC-backed exit value
Non-VC backed exit value
NOTE:
2019 is based on data up to September 2019.
www.stateofeuropeantech.com
In Partnership with
&
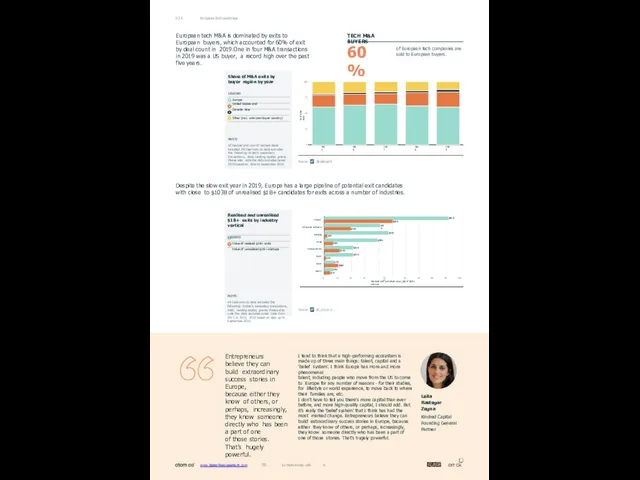
www.stateofeuropeantech.com 58 In Partnership with &
European Exit Landscape
03.5
% of M&A exits
2015
2016
2017
2018
2019
0
25
50
75
100
Share of M&A exits
www.stateofeuropeantech.com 58 In Partnership with &
European Exit Landscape
03.5
% of M&A exits
2015
2016
2017
2018
2019
0
25
50
75
100
Share of M&A exits
LEGEND
Europe
United States and Canada Asia
Other (incl. unknown buyer country)
NOTE:
VC-backed and non-VC backed deals included. All Dealroom.co data excludes the following: biotech, secondary transactions, debt, lending capital, grants. Please also note the data excludes Israel. 2019 based on data to September 2019.
European tech M&A is dominated by exits to European buyers, which accounted for 60% of exit by deal count in 2019.One in four M&A transactions in 2019 was a US buyer, a record high over the past five years.
of European tech companies are sold to European buyers.
TECH M&A BUYERS
60%
Despite the slow exit year in 2019, Europe has a large pipeline of potential exit candidates with close to $103B of unrealised $1B+ candidates for exits across a number of industries.
Realised and unrealised value ($B) of $1B+ startups
$91B
$41B
$47B
$39B
$21B
$21B
$7B
$6B
$50B
$19B
$2B
$6B
$11B
$1B
$10B
$4B
Fintech
Enterprise software
Gaming
Food
Transportation
Music
Travel
Health
0
10
20
30 40 50 60
70
80
90
100
Realised and unrealised $1B+ exits by industry vertical
LEGEND
Value of realised $1B+ exits
Value of unrealised $1B+ startups
NOTE:
All Dealroom.co data excludes the following: biotech, secondary transactions, debt, lending capital, grants. Please also note the data excludes Israel. Data from 2013 to 2019; 2019 based on data up to September 2019.
Entrepreneurs believe they can build extraordinary success stories in Europe,
because either they know of others, or perhaps, increasingly, they know someone directly who has been a part of one
of those stories. That’s hugely powerful.
I tend to think that a high-performing ecosystem is made up of three main things: talent, capital and a ‘belief system’. I think Europe has more and more phenomenal
talent, including people who move from the US to come to Europe for any number of reasons - for their studies, for lifestyle or world experience, to move back to where their families are, etc.
I don’t have to tell you there’s more capital than ever before, and more high-quality capital, I should add. But it’s really the ‘belief system’ that I think has had the most marked change. Entrepreneurs believe they can build extraordinary success stories in Europe, because either they know of others, or perhaps, increasingly, they know someone directly who has been a part of one of those stories. That’s hugely powerful.
Leila Rastegar Zegna
Kindred Capital Founding General Partner
59
In Partnership with
&
www.stateofeuropeantech.com
04
Investors
What is the definition of a European tech investor?
As
59
In Partnership with
&
www.stateofeuropeantech.com
04
Investors
What is the definition of a European tech investor?
As
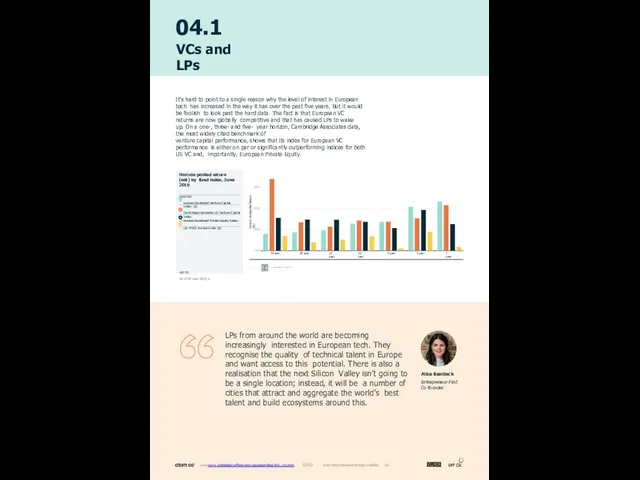
wwwwww..ssttatateeooffeueurroopepeaanntteecchh..ccoomm 6060 IInn PPaarrttnneerrsshhiipp wwiitthh &&
04.1
VCs and LPs
It’s hard to point to a single
wwwwww..ssttatateeooffeueurroopepeaanntteecchh..ccoomm 6060 IInn PPaarrttnneerrsshhiipp wwiitthh &&
04.1
VCs and LPs
It’s hard to point to a single
venture capital performance, shows that its index for European VC performance is either on par or significantly outperforming indices for both US VC and, importantly, European Private Equity.
Horizon Pooled Net Return (%)
25 year
20 year
15 year
10 year
5 year
3 year
1 year
0.0
10.0
20.0
30.0
Horizon pooled return (net) by fund index, June 2019
LEGEND
Europe Developed Venture Capital Index ($)
Cambridge Associates US Venture Capital Index
Europe Developed Private Equity Index ($) MSCI Europe Index ($)
NOTE:
As of 30 June 2019, $
LPs from around the world are becoming increasingly interested in European tech. They recognise the quality of technical talent in Europe and want access to this potential. There is also a realisation that the next Silicon Valley isn’t going to be a single location; instead, it will be a number of cities that attract and aggregate the world’s best talent and build ecosystems around this.
Alice Bentinck
Entrepreneur First Co-founder
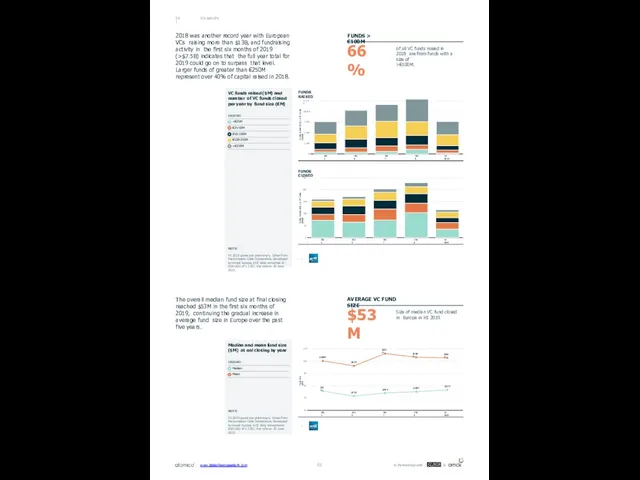
VCs and LPs
04.1
2018 was another record year with European VCs raising
VCs and LPs
04.1
2018 was another record year with European VCs raising
The overall median fund size at final closing reached $53M in the first six months of 2019, continuing the gradual increase in average fund size in Europe over the past five years.
of all VC funds raised in 2018 are from funds with a size of
>€100M.
Size of median VC fund closed in Europe in H1 2019
FUNDS > €100M
AVERAGE VC FUND SIZE
66%
$53M
Funds raised ($M) / # of funds closed
2015
2016
2017
2018
H1 2019
0
2,500
5,000
7,500
10,000
12,500
Fund size ($M)
$51M
$43M
$48M
$50M
$53M
$100M
$92M
$112M
$106M
$105M
2015
2016
2017
2018
H1 2019
20
40
60
80
100
120
Funds raised ($M) / # of funds closed
2015
2016
2017
2018
H1 2019
0
50
100
150
200
250
Median and mean fund size ($M) at nal closing by year
LEGEND
Median
Mean
VC funds raised ($M) and number of VC funds closed per year by fund size (€M)
LEGEND
<€25M
€25-50M
€50-100M
€100-250M
>€250M
NOTE:
H1 2019 gures are preliminary. Taken from the European Data Cooperative, developed by Invest Europe. EDC data converted at EUR:USD of 1.1367, the rate on 30 June 2019.
NOTE:
H1 2019 gures are preliminary. Taken from the European Data Cooperative, developed by Invest Europe. EDC data converted at EUR:USD of 1.1367, the rate on 30 June 2019.
FUNDS CLOSED
FUNDS RAISED
www.stateofeuropeantech.com
In Partnership with
&
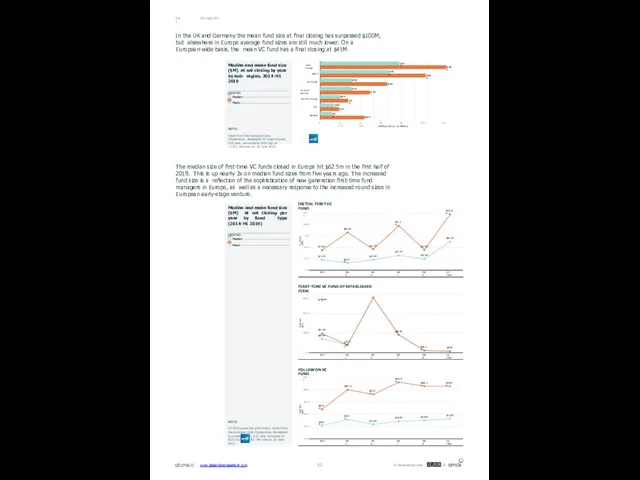
VCs and LPs
04.1
The median size of first-time VC funds closed in
VCs and LPs
04.1
The median size of first-time VC funds closed in
Fund size ($M)
$22.7M
$15.9M
$22.9M
$32.5M
$24.6M
$62.5M
$43.5M
$82.6M
$45.7M
$97.3M
$44.6M
$122.0M
2014
2015
2016
2017
2018
H1 2019
0.0
25.0
50.0
75.0
100.0
125.0
Fund size ($M)
$97.3M
$69.9M
$3490..10M
$90.9M
$10.2M
$6.9M
2014
2015
2016
2017
2018
H1 2019
0.0
100.0
200.0
Fund size ($M)
$41.6M
$51.2M
$43.3M
$48.3M
$49.9M
$52.6M
$67.8M
$99.7M
$92.1M
$112.0M
$105.5M
$105.4M
2014
2015
2016
2017
2018
H1 2019
20.0
40.0
60.0
80.0
100.0
120.0
Median and mean fund size ($M) at nal closing per year by fund type (2014-H1 2019)
LEGEND
Median Mean
NOTE:
H1 2019 gures are preliminary. Taken from the European Data Cooperative, developed by Invest Europe. EDC data converted at EUR:USD of 1.1367, the rate on 30 June 2019.
FIRST-TIME VC FUND OF ESTABLISHED FIRM
300.0 $280.9M
FOLLOW ON VC FUND
INITIAL FIRST VC FUND
In the UK and Germany the mean fund size at final closing has surpassed $100M, but elsewhere in Europe average fund sizes are still much lower. On a European-wide basis, the mean VC fund has a final closing at $45M.
$117M
$101M
$46M
$45M
$28M
$20M
$17M
$186M
$156M
$98M
$73M
$41M
$27M
UK & Ireland
DACH
All Europe
France & Benelux
Southern Europe
CEE
Nordics
$65M
0 20 40 60 80 100 120 140 160 180 200
Fund size ($M) at nal closing
Median and mean fund size ($M) at nal closing by year by sub- region, 2014-H1 2019
LEGEND
Median Mean
NOTE:
Taken from the European Data Cooperative, developed by Invest Europe. EDC data converted at EUR:USD of 1.1367, the rate on 30 June 2019.
www.stateofeuropeantech.com
In Partnership with
&
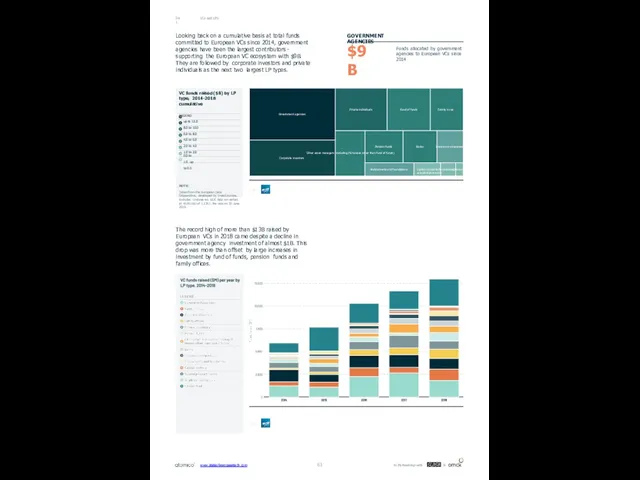
VCs and LPs
04.1
Looking back on a cumulative basis at total funds
VCs and LPs
04.1
Looking back on a cumulative basis at total funds
The record high of more than $13B raised by European VCs in 2018 came despite a decline in government agency investment of almost $1B. This drop was more than offset by large increases in investment by fund of funds, pension funds and family offices.
Funds allocated by government agencies to European VCs since 2014
GOVERNMENT AGENCIES
$9B
Government agencies
Fund of funds
Corporate investors
Family o ces
Private individuals
Other asset managers
(including PE houses ot
Pension funds
her than fund of funds)
Banks
Insurance companies
Endowments and foundations
Capital markeStoAsvceardeeigmniwc einaslthitufutinodns
VC funds raised ($B) by LP type, 2014-2018 cumulative
LEGEND
up to 12.0
8.0 to 10.0
6.0 to 8.0
4.0 to 6.0
2.0 to 4.0
1.0 to 2.0
0.0 to 1.0 up to 0.0
NOTE:
Taken from the European Data Cooperative, developed by Invest Europe. Excludes Unclassi ed. EDC data converted at EUR:USD of 1.1367, the rate on 30 June 2019.
www.stateofeuropeantech.com
In Partnership with
&
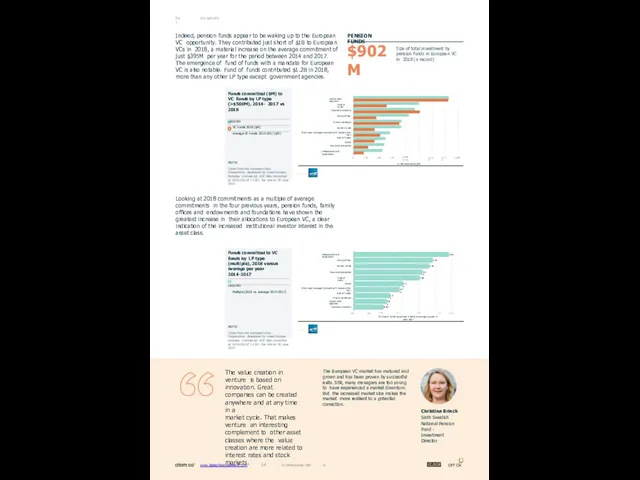
www.stateofeuropeantech.com 64 In Partnership with &
VCs and LPs
04.1
Indeed, pension funds appear to be waking
www.stateofeuropeantech.com 64 In Partnership with &
VCs and LPs
04.1
Indeed, pension funds appear to be waking
Looking at 2018 commitments as a multiple of average commitments in the four previous years, pension funds, family offices and endowments and foundations have shown the greatest increase in their allocations to European VC, a clear indication of the increased institutional investor interest in the asset class.
Size of total investment by pension funds in European VC in 2018 (a record)
PENSION FUNDS
$902M
Government agencies
Fund of funds
Corporate investors
Family offices
Private individuals
Pension funds
Other asset managers (including PE houses other than
fund of funds)
Banks
Insurance companies
Endowments and foundations
0
2,000
250
500
750
1,000 1,250
Funds committed ($M)
1,500
1,750
2.9x
2.4x
2.3x
2.1x
2.0x
1.5x
1.4x
1.1x
1.0x
0.9x
Endowments and foundations
Family offices
Pension funds
Insurance companies
Fund of funds
Banks
Other asset managers (including PE houses other than
fund of funds)
Private individuals
Government agencies
Corporate investors
0.0
0.5
1.0 1.5 2.0 2.5
Multiple of funds committed in 2018 vs average per year in 2014-2017
3.0
Funds committed ($M) to VC funds by LP type (>$500M), 2014- 2017 vs 2018
LEGEND
VC Funds 2018 ($M)
Average VC Funds 2014-2017 ($M)
NOTE:
Taken from the European Data Cooperative, developed by Invest Europe. Excludes Unclassi ed. EDC data converted at EUR:USD of 1.1367, the rate on 30 June 2019.
Funds committed to VC funds by LP type (multiple), 2018 versus average per year 2014-2017
LEGEND
Multiple (2018 vs. average 2014-2017)
NOTE:
Taken from the European Data Cooperative, developed by Invest Europe. Excludes Unclassi ed. EDC data converted at EUR:USD of 1.1367, the rate on 30 June 2019.
The value creation in venture is based on innovation. Great companies can be created anywhere and at any time in a
market cycle. That makes venture an interesting complement to other asset classes where the value creation are more related to interest rates and stock markets.
The European VC market has matured and grown and has been proven by successful exits. Still, many managers are too young to have experienced a market downturn. But the increased market size makes the market more resilient to a potential correction.
Christina Brinck Sixth Swedish National Pension
Fund - Investment Director
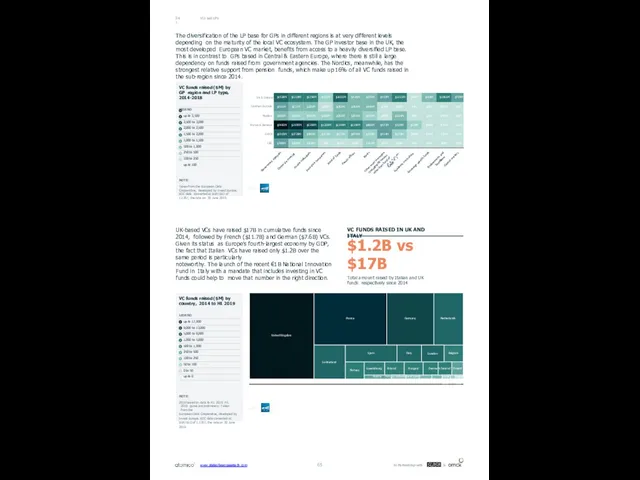
VCs and LPs
04.1
The diversification of the LP base for GPs in
VCs and LPs
04.1
The diversification of the LP base for GPs in
Government agencies
or
Corporate invest s
Private individuals
Insurance companies
Fund of funds
Family offices
Banks
Other asset managers
(including PE houses
other than fund of
fPuenndsi)on funds
Academic institutions
Sovereign wealth funds
da
Endowments and
foun tions
Capital markets
CEE
DACH
France & Benelux
Nordics
Southern Europe
UK & Ireland
VC funds raised ($M) by GP region and LP type, 2014-2018
LEGEND
up to 3,500
2,500 to 3,000
2,000 to 2,500
1,500 to 2,000
1,000 to 1,500
500 to 1,000
250 to 500
100 to 250
up to 100
NOTE:
Taken from the European Data Cooperative, developed by Invest Europe. EDC data converted at EUR:USD of 1.1367, the rate on 30 June 2019.
UK-based VCs have raised $17B in cumulative funds since 2014, followed by French ($11.7B) and German ($7.6B) VCs. Given its status as Europe’s fourth-largest economy by GDP, the fact that Italian VCs have raised only $1.2B over the same period is particularly
noteworthy. The launch of the recent €1B National Innovation Fund in Italy with a mandate that includes investing in VC funds could help to move that number in the right direction.
VC FUNDS RAISED IN UK AND ITALY
$1.2B vs $17B
Total amount raised by Italian and UK funds respectively since 2014
Belgium
France
Germany
Hungary Denmark Ireland
Italy
Luxembourg Finland
Netherlands
Norway
Poland
Austria Portugal LEitshtuoaniiCazech RepublGicreeLceaRt
Spain
Sweden
Switzerland
voima aBnuialgUSakrler
oiaravbianiakeia
United Kingdom
VC funds raised ($M) by country, 2014 to H1 2019
LEGEND
up to 17,000
9,000 to 13,000
5,000 to 9,000
1,000 to 5,000
500 to 1,000
250 to 500
100 to 250
50 to 100
0 to 50
up to 0
NOTE:
2019 based on data to H1 2019. H1 2019 gures are preliminary. Taken from the
European Data Cooperative, developed by Invest Europe. EDC data converted at EUR:USD of 1.1367, the rate on 30 June 2019.
www.stateofeuropeantech.com
In Partnership with
&
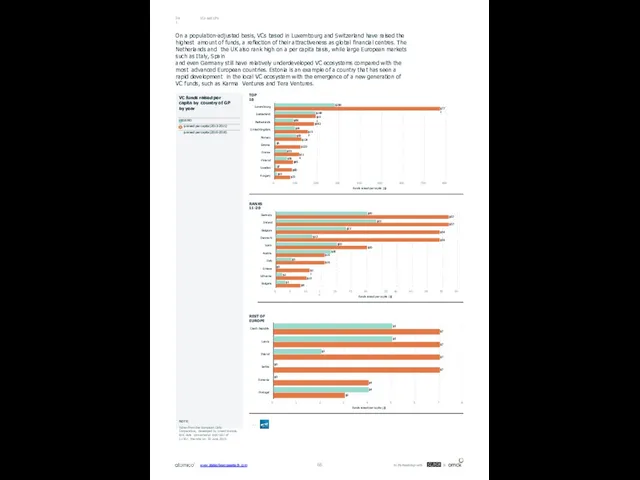
$30
$33
$23
$12
$20
$5
$0
$2
$3
$57
$57
$54
$54
$30
$18
$16
$16
$11
$10
Germany
Ireland
Belgium
Denmark
Spain
Austria
Italy
Greece
Lithuania
Bulgaria
0
5
$8
10
15
20
25
30 35
Funds raised per capita ($)
40
45
50
55
60
VCs and LPs
04.1
On a population-adjusted basis, VCs
$30
$33
$23
$12
$20
$5
$0
$2
$3
$57
$57
$54
$54
$30
$18
$16
$16
$11
$10
Germany
Ireland
Belgium
Denmark
Spain
Austria
Italy
Greece
Lithuania
Bulgaria
0
5
$8
10
15
20
25
30 35
Funds raised per capita ($)
40
45
50
55
60
VCs and LPs
04.1
On a population-adjusted basis, VCs
and even Germany still have relatively underdeveloped VC ecosystems compared with the most advanced European countries. Estonia is an example of a country that has seen a rapid development in the local VC ecosystem with the emergence of a new generation of VC funds, such as Karma Ventures and Tera Ventures.
$280
$86
$94
$5
$55
$7
$10
$771
$189
$191
$183
$153
$99
$124
$120
$114
$56
$85
$80
Luxembourg
Switzerland
Netherlands
United Kingdom
Norway
Estonia
France
Finland
Sweden
Hungary
0
$72
100
200
300
400 500
Funds raised per capita ($)
600
700
800
$5
$5
$2
$0
$0
$4
$7
$7
$7
$7
$4
$3
Czech Republic
Latvia
Poland
Serbia
Romania
Portugal
0
1
2
3
4
Funds raised per capita ($)
5
6
7
8
VC funds raised per capita by country of GP by year
LEGEND
$ raised per capita (2013-2015)
$ raised per capita (2016-2018)
NOTE:
Taken from the European Data Cooperative, developed by Invest Europe. EDC data converted at EUR:USD of 1.1367, the rate on 30 June 2019.
TOP 10
RANKS 11-20
REST OF EUROPE
www.stateofeuropeantech.com
In Partnership with
&
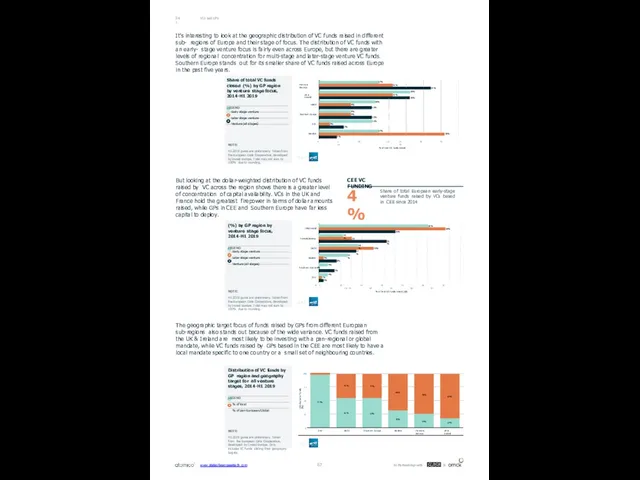
VCs and LPs
04.1
It’s interesting to look at the geographic distribution of
VCs and LPs
04.1
It’s interesting to look at the geographic distribution of
36%
France & Benelux
UK & Ireland
DACH
Southern Europe
CEE
Nordics
5%
0 5 10 15
20 25 30 35 40
% of total VC funds closed
Share of total VC funds closed (%) by GP region by venture stage focus, 2014-H1 2019
LEGEND
Early stage venture Later stage venture Venture (all stages)
NOTE:
H1 2019 gures are preliminary. Taken from the European Data Cooperative, developed by Invest Europe. Total may not sum to 100% due to rounding.
But looking at the dollar-weighted distribution of VC funds raised by VC across the region shows there is a greater level of concentration of capital availability. VCs in the UK and France hold the greatest firepower in terms of dollar amounts raised, while GPs in CEE and Southern Europe have far less capital to deploy.
The geographic target focus of funds raised by GPs from different European sub-regions also stands out because of the wide variance. VC funds raised from the UK & Ireland are most likely to be investing with a pan-regional or global mandate, while VC funds raised by GPs based in the CEE are most likely to have a local mandate specific to one country or a small set of neighbouring countries.
Share of total European early-stage venture funds raised by VCs based in CEE since 2014
CEE VC FUNDING
4%
50%
11%
18%
13%
4%
4%
58%
15%
25%
2%
35%
31%
17%
8%
7%
1%
2%
UK&Ireland
France&Benelux
DACH
Nordics
Southern Europe 0%
CEE
Distribution of funds (%)
3%
CEE
DACH
Southern Europe
Nordics
France & Benelux
UK & Ireland
0
25
50
75
100
0 5 10 15 20 25 30 35 40 45 50 55 60 65
% of total VC funds raised ($B)
(%) by GP region by venture stage focus, 2014-H1 2019
LEGEND
Early stage venture Later stage venture Venture (all stages)
NOTE:
H1 2019 gures are preliminary. Taken from the European Data Cooperative, developed by Invest Europe. Total may not sum to 100% due to rounding.
Distribution of VC funds by GP region and geography target for all venture stages, 2014-H1 2019
LEGEND
% of local
% of pan-European/Global
NOTE:
H1 2019 gures are preliminary. Taken from the European Data Cooperative, developed by Invest Europe. Only includes VC funds stating their geography targets.
www.stateofeuropeantech.com
In Partnership with
&
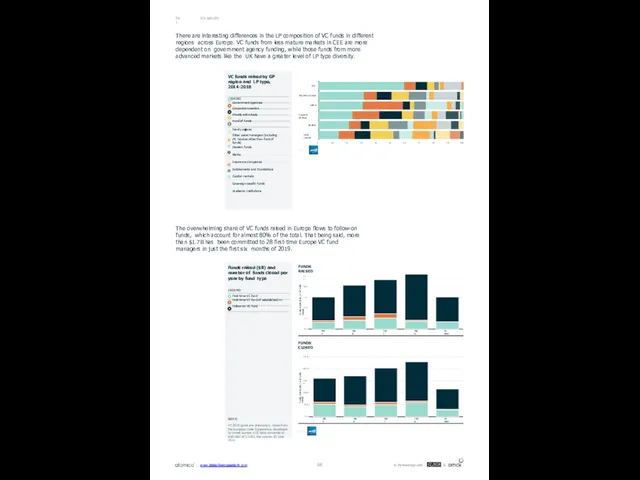
VCs and LPs
04.1
There are interesting differences in the LP composition of
VCs and LPs
04.1
There are interesting differences in the LP composition of
CEE
Southern Europe
DACH
France & Benelux
Nordics
UK & Ireland
0
10
20
30
40
50
60
70
80
90
100
VC funds raised by GP region and LP type, 2014-2018
LEGEND
Government agencies Corporate investors Private individuals Fund of funds
Family o�ces
Other asset managers (including PE houses other than fund of funds)
Pension funds Banks
Insurance companies Endowments and foundations Capital markets
Sovereign wealth funds Academic institutions
The overwhelming share of VC funds raised in Europe flows to follow-on funds, which account for almost 80% of the total. That being said, more than $1.7B has been committed to 28 first-time Europe VC fund managers in just the first six months of 2019.
Funds raised ($B) / # of funds closed
2015
2016
2017
2018
H1 2019
0.0
2.5
5.0
7.5
10.0
12.5
Funds raised ($B) / # of funds closed
2015
2016
2017
2018
H1 2019
0.0
50.0
100.0
150.0
200.0
250.0
Funds raised ($B) and number of funds closed per year by fund type
LEGEND
First-time VC fund
First-time VC fund of established rm Follow-on VC fund
NOTE:
H1 2019 gures are preliminary. Taken from the European Data Cooperative, developed by Invest Europe. EDC data converted at EUR:USD of 1.1367, the rate on 30 June 2019.
FUNDS CLOSED
FUNDS RAISED
www.stateofeuropeantech.com
In Partnership with
&
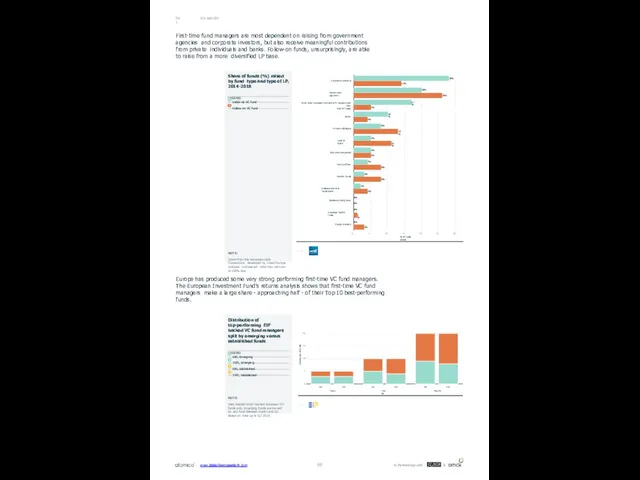
VCs and LPs
04.1
First-time fund managers are most dependent on raising from
VCs and LPs
04.1
First-time fund managers are most dependent on raising from
28%
20%
17%
10%
8%
5%
4%
3%
2%
0%
0%
14%
26%
5%
4%
13%
11%
5%
5%
8%
8%
4%
0%
0%
1%
3%
Corporate investors
Government agencies
Other asset managers (including PE houses other than
fund of funds)
Banks
Private individuals
Fund of funds
Insurance companies
Family offices
Pension funds
Endowments and foundations
Academic institutions
Sovereign wealth funds
Capital markets
0
5
10
15
% of funds raised
20
25
30
Share of funds (%) raised by fund type and type of LP, 2014-2018
LEGEND
Initial rst VC fund Follow on VC fund
NOTE:
Taken from the European Data Cooperative, developed by Invest Europe. Excludes Unclassi ed. Total may not sum to 100% due
Europe has produced some very strong performing first-time VC fund managers. The European Investment Fund’s returns analysis shows that first-time VC fund managers make a large share - approaching half - of their Top 10 best-performing funds.
Distribution of funds
IRR
IRR
IRR
TVPI
TVPI
TVPI
Top 5
Top 10
Top 20
0
5
10
15
20
Distribution of top-performing EIF backed VC fund managers split by emerging versus established funds
LEGEND
IRR, Emerging TVPI, Emerging IRR, Established TVPI, Established
NOTE:
Data relates to EIF-backed European ICT funds only. Emerging funds are de ned as any fund between Fund I and III. Based on data up to Q2 2019.
www.stateofeuropeantech.com
In Partnership with
&
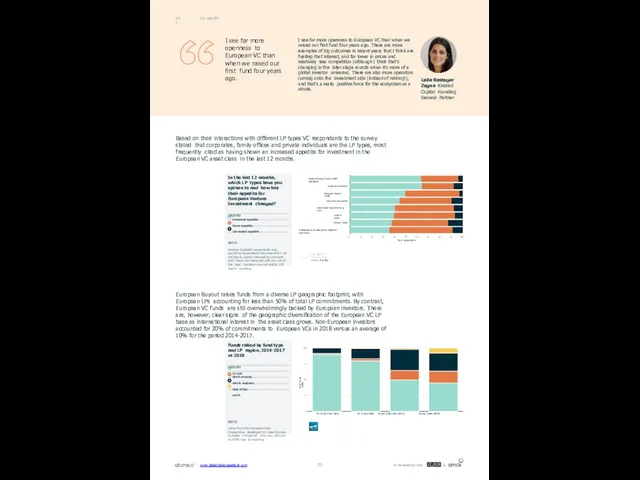
VCs and LPs
04.1
Based on their interactions with different LP types VC
VCs and LPs
04.1
Based on their interactions with different LP types VC
European Buyout raises funds from a diverse LP geographic footprint, with European LPs accounting for less than 50% of total LP commitments. By contrast, European VC funds are still overwhelmingly backed by European investors. There are, however, clear signs of the geographic diversification of the European VC LP base as international interest in the asset class grows. Non-European investors accounted for 20% of commitments to European VCs in 2018 versus an average of 10% for the period 2014-2017.
Family offices & Private HNW individuals
Corporate investors
Sovereign wealth Funds
Insurance companies
Government agencies (e.g. EIF)
Fund of funds
Pension funds
Endowments, foundations & fcademic institutions
0
10
20
30
40
50
% of respondents
60
70
80
90
100
% of funds raised
VC funds (2014-2017) VC funds (2018) Buyout funds (2014-2017) Buyout funds (2018)
0
25
50
75
100
I see far more openness to European VC than when we raised our first fund four years ago.
I see far more openness to European VC than when we raised our first fund four years ago. There are more examples of big outcomes in recent years that I think are fuelling that interest, and far lower in-prices and relatively less competition (although I think that’s changing in the later stage rounds when it’s more of a global investor universe). There are also more operators coming onto the investment side (instead of retiring!), and that’s a really positive force for the ecosystem as a whole.
Leila Rastegar Zegna Kindred Capital Founding General Partner
In the last 12 months, which LP types have you spoken to and how has their appetite for European Venture Investment changed?
LEGEND
Increased appetite Same appetite Decreased appetite
NOTE:
Venture Capitalist respondents only, excluding respondents that answered 'I do not feel su ciently informed to comment' and 'I have not interacted with any LPs of this type'. Numbers may not add to 100 due to rounding.
Funds raised by fund type and LP region, 2014-2017 vs 2018
LEGEND
Europe
North America Asia & Australia Rest of the world
NOTE:
Taken from the European Data Cooperative, developed by Invest Europe. Excludes Unclassi ed. Total may not sum to 100% due to rounding.
www.stateofeuropeantech.com
In Partnership with
&
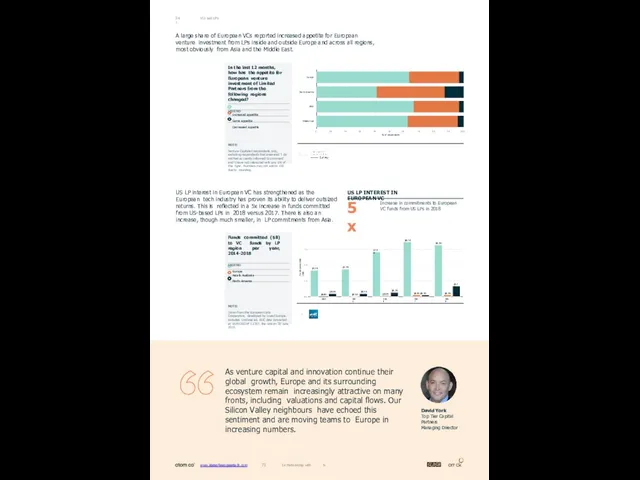
www.stateofeuropeantech.com 71 In Partnership with &
As venture capital and innovation continue their global growth,
www.stateofeuropeantech.com 71 In Partnership with &
As venture capital and innovation continue their global growth,
David York
Top Tier Capital Partners Managing Director
VCs and LPs
04.1
A large share of European VCs reported increased appetite for European venture investment from LPs inside and outside Europe and across all regions, most obviously from Asia and the Middle East.
Europe
North America
Asia
Middle East
0
10
20
30
40
50 60
% of respondents
70
80
90
100
In the last 12 months, how has the appetite for European venture investment of Limited Partners from the following regions changed?
LEGEND
Increased appetite Same appetite Decreased appetite
NOTE:
Venture Capitalist respondents only, excluding respondents that answered 'I do not feel su ciently informed to comment' and 'I have not interacted with any LPs of this type'. Numbers may not add to 100 due to rounding.
US LP interest in European VC has strengthened as the European tech industry has proven its ability to deliver outsized returns. This is reflected in a 5x increase in funds committed from US-based LPs in 2018 versus 2017. There is also an increase, though much smaller, in LP commitments from Asia.
Increase in commitments to European VC funds from US LPs in 2018
US LP INTEREST IN EUROPEAN VC
5x
Funds committed ($B)
$4.2B
$4.4B
$7.1B
$8.7B
$8.2B
$0.0B
$0.1B
$0.2B
$0.3B
$0.5B
$0.5B
$0.7B
$0.3B $0.3B
$1.7B
2014
2015
2016
2017
2018
0.0
2.5
5.0
7.5
Funds committed ($B) to VC funds by LP region per year, 2014-2018
LEGEND
Europe
Asia & Australia North America
NOTE:
Taken from the European Data Cooperative, developed by Invest Europe. Excludes Unclassi ed. EDC data converted at EUR:USD of 1.1367, the rate on 30 June 2019.
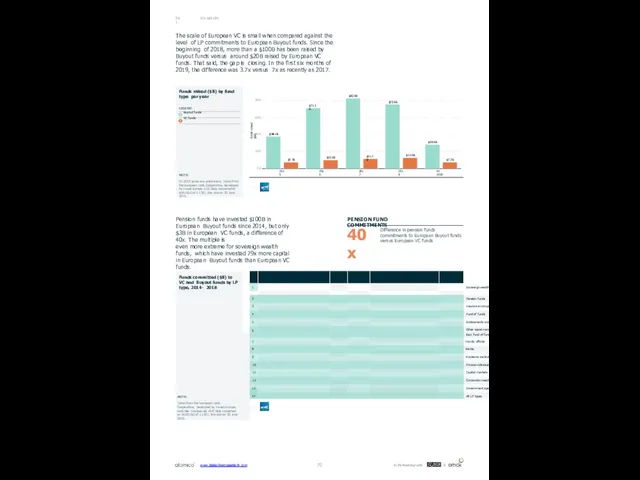
VCs and LPs
04.1
The scale of European VC is small when compared
VCs and LPs
04.1
The scale of European VC is small when compared
Funds raised ($B)
$38.1B
$71.2B
$82.6B
$75.6B
$28.6B
$7.7B
$10.3B
$11.7B
$13.0B
$7.7B
2015
2016
2017
2018
H1 2019
0.0
20.0
40.0
60.0
80.0
Funds raised ($B) by fund type per year
LEGEND
Buyout funds VC funds
NOTE:
H1 2019 gures are preliminary. Taken from the European Data Cooperative, developed by Invest Europe. EDC data converted at EUR:USD of 1.1367, the rate on 30 June 2019.
Pension funds have invested $100B in European Buyout funds since 2014, but only $3B in European VC funds, a difference of 40x. The multiple is
even more extreme for sovereign wealth funds, which have invested 79x more capital in European Buyout funds than European VC funds.
Difference in pension funds commitments to European Buyout funds versus European VC funds
PENSION FUND COMMITMENTS
40x
www.stateofeuropeantech.com
In Partnership with
&
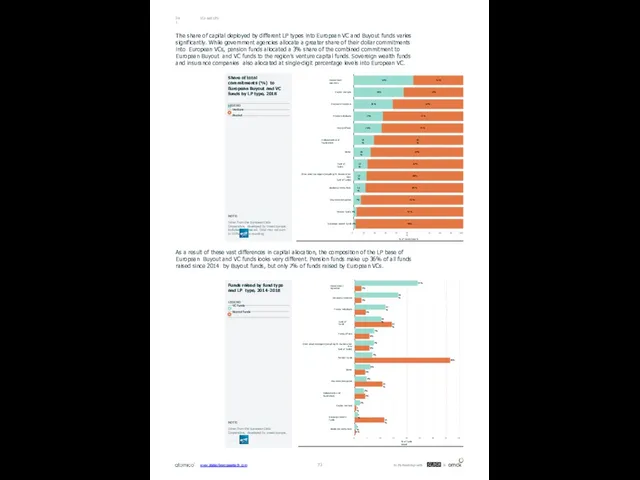
VCs and LPs
04.1
The share of capital deployed by different LP types
VCs and LPs
04.1
The share of capital deployed by different LP types
As a result of these vast differences in capital allocation, the composition of the LP base of European Buyout and VC funds looks very different. Pension funds make up 36% of all funds raised since 2014 by Buyout funds, but only 7% of funds raised by European VCs.
55%
46%
36%
27%
26%
19%
16%
13%
12%
11%
7%
45%
54%
64%
73%
74%
81%
84%
87%
88%
89%
93%
97%
98%
Government agencies
Capital markets
Corporate investors
Private individuals
Family offices
Endowments and foundations
Banks
Fund of funds
Other asset managers (including PE houses other than
fund of funds)
Academic institutions
Insurance companies
Pension funds 3%
Sovereign wealth funds 2%
0
10
20
30
40
50 60
% of commitments
70
80
90
100
24%
16%
12%
10%
7%
7%
7%
6%
4%
3%
2%
1%
1%
2%
2%
4%
14%
6%
6%
36%
4%
11%
4%
1%
11%
0%
Government agencies
Corporate investors
Private individuals
Fund of funds
Family offices
Other asset managers (including PE houses other than
fund of funds)
Pension funds
Banks
Insurance companies
Endowments and foundations
Capital markets
Sovereign wealth funds
Academic institutions
0
5
10
15
20
% of funds raised
25
30
35
40
Share of total commitments (%) to European Buyout and VC funds by LP type, 2018
LEGEND
Venture Buyout
NOTE:
Taken from the European Data Cooperative, developed by Invest Europe. Excludes Unclassi ed. Total may not sum to 100% due to rounding.
Funds raised by fund type and LP type, 2014-2018
LEGEND
VC funds Buyout funds
NOTE:
Taken from the European Data Cooperative, developed by Invest Europe.
www.stateofeuropeantech.com
In Partnership with
&
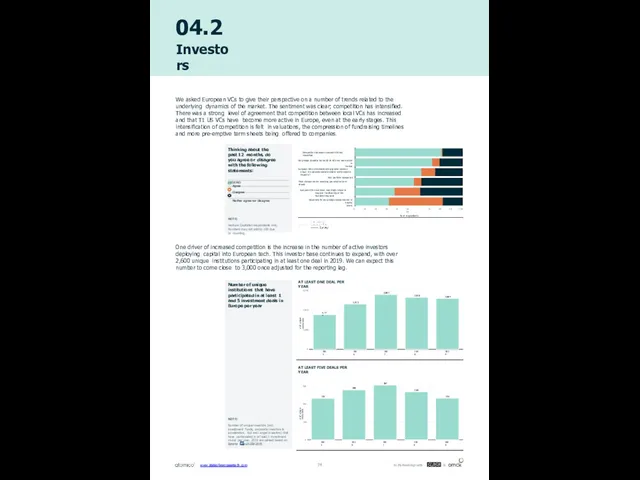
04.2
Investors
We asked European VCs to give their perspective on a number
04.2
Investors
We asked European VCs to give their perspective on a number
Competition between European VCs has intensified
Early-stage (Seed to Series B) US VCs are more active in
Europe
European VCs are demonstrating greater concern about the potential societal and/or environmental impact of
their portfolio companies
More companies are receiving pre-emptive term sheets
European VCs have taken meaningful steps to improve the diversity of the founders they back
Valuations for early-stage companies are at healthy
levels
0
10
20
30
40
50 60
% of respondents
70
80
90
100
Thinking about the past 12 months, do you agree or disagree with the following statements:
LEGEND
Agree Disagree
Neither agree nor disagree
NOTE:
Venture Capitalist respondents only. Numbers may not add to 100 due to rounding.
One driver of increased competition is the increase in the number of active investors deploying capital into European tech. This investor base continues to expand, with over 2,600 unique institutions participating in at least one deal in 2019. We can expect this number to come close to 3,000 once adjusted for the reporting lag.
# of unique institutions
1,774
2,323
2,802
2,656
2,604
2015
2016
2017
2018
2019
0
1,000
2,000
3,000
# of unique institutions
232
280
307
269
233
2015
2016
2017
2018
2019
0
100
200
300
Number of unique institutions that have participated in at least 1 and 5 investment deals in Europe per year
NOTE:
Number of unique investors (incl. investment funds, corporate investors & accelerators, but excl. angel investors) that have participated in at least 1 investment round per year. 2019 annualised based on data to September 2019.
AT LEAST FIVE DEALS PER YEAR
AT LEAST ONE DEAL PER YEAR
www.stateofeuropeantech.com
In Partnership with
&
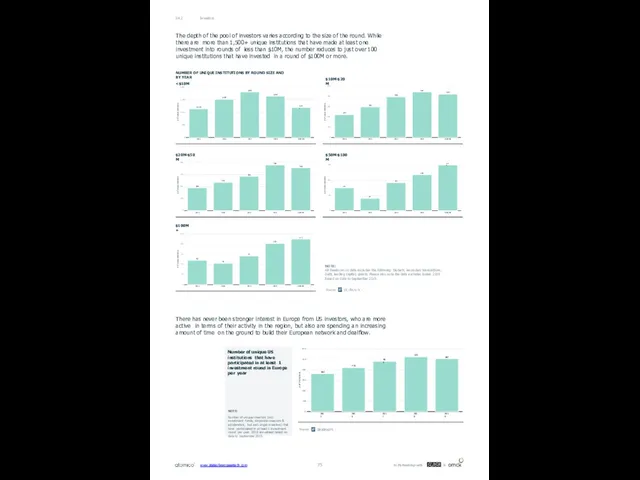
# of unique institutions
190
234
285
379
356
2015
2016
2017
2018
2019 9M
0
100
200
300
400
# of unique institutions
75
41
93
119
151
2015
2016
2017
2018
2019 9M
0
50
100
150
Investors
04.2
The depth of
# of unique institutions
190
234
285
379
356
2015
2016
2017
2018
2019 9M
0
100
200
300
400
# of unique institutions
75
41
93
119
151
2015
2016
2017
2018
2019 9M
0
50
100
150
Investors
04.2
The depth of
NUMBER OF UNIQUE INSTITUTIONS BY ROUND SIZE AND BY YEAR
<$10M
$20M-$50M
$100M+
$10M-$20M
$50M-$100M
# of unique institutions
1,140
1,520
1,813
1,644
1,191
2015
2016
2017
2018
2019 9M
0
500
1,000
1,500
2,000
# of unique institutions
60
53
71
102
113
2015
2016
2017
2018
2019 9M
0
25
50
75
100
125
# of unique institutions
224
300
398
447
426
2015
2016
2017
2018
2019 9M
0
100
200
300
400
500
NOTE:
All Dealroom.co data excludes the following: biotech, secondary transactions, debt, lending capital, grants. Please also note the data excludes Israel. 2019 based on data to September 2019.
There has never been stronger interest in Europe from US investors, who are more active in terms of their activity in the region, but also are spending an increasing amount of time on the ground to build their European network and dealflow.
# of institutions
363
www.stateofeuropeantech.com
In Partnership with
&
421
481
525
507
2015
2016
2017
2018
2019
0
100
200
300
400
500
600
Number of unique US institutions that have participated in at least 1 investment round in Europe per year
NOTE:
Number of unique investors (incl. investment funds, corporate investors & accelerators, but excl. angel investors) that have participated in at least 1 investment round per year. 2019 annualised based on data to September 2019.
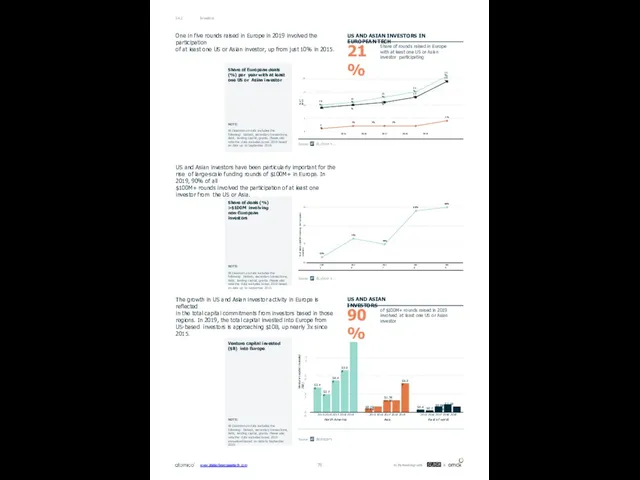
Investors
04.2
One in five rounds raised in Europe in 2019 involved the
Investors
04.2
One in five rounds raised in Europe in 2019 involved the
of at least one US or Asian investor, up from just 10% in 2015.
US and Asian investors have been particularly important for the rise of large-scale funding rounds of $100M+ in Europe. In 2019, 90% of all
$100M+ rounds involved the participation of at least one investor from the US or Asia.
The growth in US and Asian investor activity in Europe is reflected
in the total capital commitments from investors based in those regions. In 2019, the total capital invested into Europe from US-based investors is approaching $10B, up nearly 3x since 2015.
Share of rounds raised in Europe with at least one US or Asian investor participating
of $100M+ rounds raised in 2019 involved at least one US or Asian investor
US AND ASIAN INVESTORS IN EUROPEAN TECH
US AND ASIAN INVESTORS
21%
90%
% of deals
15%
21%
1%
2% 2% 2%
4%
10%
9%
11%
10%
13%
11%
13%
19%
0
5
10
15
20
% of deals >$100M involving non-European investors
63%
73%
70%
88%
90%
2015
2016
2017
2018
2019
60
70
80
90
2015 2016 2017 2018 2019
Share of European deals (%) per year with at least one US or Asian investor
NOTE:
All Dealroom.co data excludes the following: biotech, secondary transactions, debt, lending capital, grants. Please also note the data excludes Israel. 2019 based on data up to September 2019.
Share of deals (%) >$100M involving non-European investors
NOTE:
All Dealroom.co data excludes the following: biotech, secondary transactions, debt, lending capital, grants. Please also note the data excludes Israel. 2019 based on data up to September 2019.
Venture capital invested ($B) into Europe
NOTE:
All Dealroom.co data excludes the following: biotech, secondary transactions, debt, lending capital, grants. Please also note the data excludes Israel. 2019 annualised based on data to September 2019.
2015 2016 2017 2018 2019
North America
S3.4B
S2.5B
S4.4B
S5.8B
2015 2016 2017 2018 2019
Asia
S0.5B S0.8B
S1.7B S1.7B
S4.0B
2015 2016 2017 2018 2019
Rest of world
S0.4B
S0.3B
S0.8B S1.1B S0.8B
7.5
5.0
2.5
0.0
Venture capital invested (SB)
www.stateofeuropeantech.com
In Partnership with
&
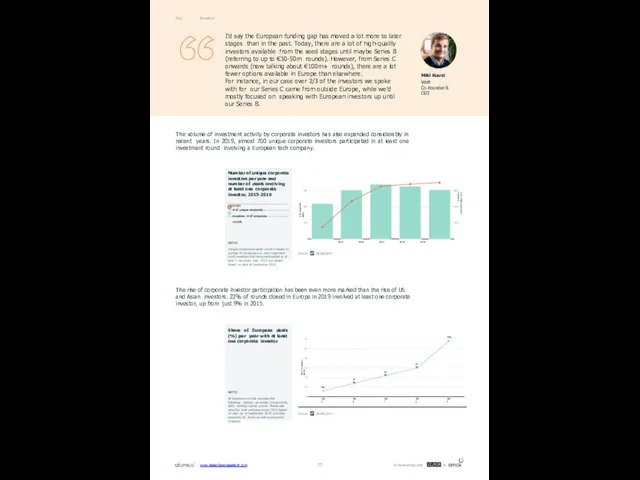
Investors
04.2
The volume of investment activity by corporate investors has also expanded
Investors
04.2
The volume of investment activity by corporate investors has also expanded
The rise of corporate investor participation has been even more marked than the rise of US and Asian investors. 22% of rounds closed in Europe in 2019 involved at least one corporate investor, up from just 9% in 2015.
# of corporate deals
# of unique corporate investors
250
500
750
400
500
600
% of European deals
9%
11%
13%
15%
22%
2015
2016
2017
2018
2019
8
10
13
15
18
20
23
0 300
2015 2016 2017 2018 2019
Number of unique corporate investors per year and number of deals involving at least one corporate investor, 2015-2019
LEGEND
# of unique corporate investors # of corporate rounds
NOTE:
Unique corporate investor count is based on number of corporate (i.e. non investment fund) investors that have participated in at least 1 round per year. 2019 annualised based on data to September 2019.
Share of European deals (%) per year with at least one corporate investor
NOTE:
All Dealroom.co data excludes the following: biotech, secondary transactions, debt, lending capital, grants. Please also note the data excludes Israel. 2019 based on data up to September 2019. Includes corporate VC funds as well as corporate investors.
I’d say the European funding gap has moved a lot more to later stages than in the past. Today, there are a lot of high-quality investors available from the seed stages until maybe Series B (referring to up to €30-50m rounds). However, from Series C onwards (now talking about €100m+ rounds), there are a lot fewer options available in Europe than elsewhere.
For instance, in our case over 2/3 of the investors we spoke with for our Series C came from outside Europe, while we’d mostly focused on speaking with European investors up until our Series B.
Miki Kuusi
Wolt
Co-Founder & CEO
www.stateofeuropeantech.com
In Partnership with
&
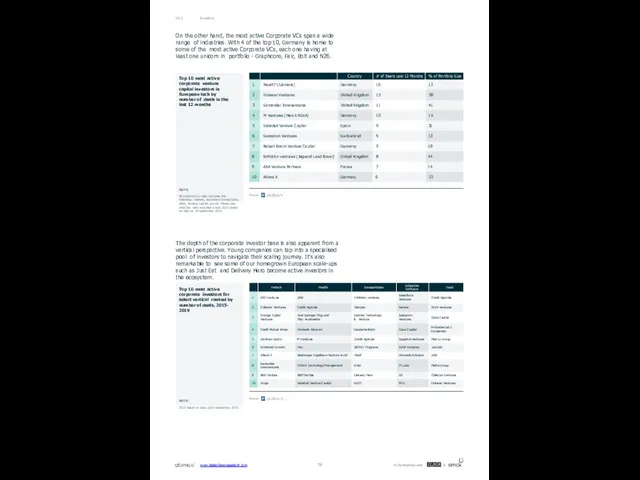
Investors
04.2
On the other hand, the most active Corporate VCs span a
Investors
04.2
On the other hand, the most active Corporate VCs span a
The depth of the corporate investor base is also apparent from a vertical perspective. Young companies can tap into a specialised pool of investors to navigate their scaling journey. It’s also remarkable to see some of our homegrown European scale-ups such as Just Eat and Delivery Hero become active investors in the ecosystem.
Top 10 most active corporate investors for select vertical ranked by number of deals, 2015- 2019
NOTE:
2019 based on data up to September 2019.
Top 10 most active corporate venture capital investors in European tech by number of deals in the last 12 months
NOTE:
All Dealroom.co data excludes the following: biotech, secondary transactions, debt, lending capital, grants. Please also note the data excludes Israel. 2019 based on data as of September 2019.
www.stateofeuropeantech.com
In Partnership with
&
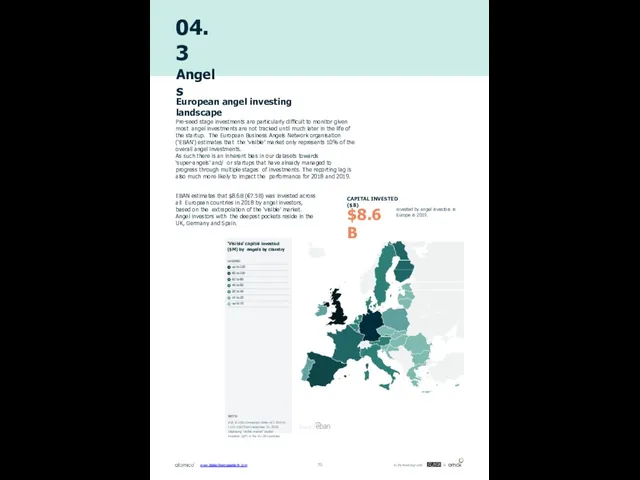
04.3
Angels
European angel investing landscape
EBAN estimates that $8.6B (€7.5B) was invested across
04.3
Angels
European angel investing landscape
EBAN estimates that $8.6B (€7.5B) was invested across
Pre-seed stage investments are particularly difficult to monitor given most angel investments are not tracked until much later in the life of the startup. The European Business Angels Network organisation (‘EBAN’) estimates that the ‘visible’ market only represents 10% of the overall angel investments.
As such there is an inherent bias in our datasets towards ‘super-angels’ and/ or startups that have already managed to progress through multiple stages of investments. The reporting lag is also much more likely to impact the performance for 2018 and 2019.
invested by angel investors in Europe in 2019.
CAPITAL INVESTED ($B)
$8.6B
'Visible' capital invested ($M) by angels by country
LEGEND
up to 120
80 to 100
60 to 80
40 to 60
20 to 40
10 to 20
up to 10
NOTE:
EUR to USD conversion taken at 1 EUR to
1.145 USD from December 31, 2018. Displaying 'visible market' capital invested ($M) in the EU-28 countries.
www.stateofeuropeantech.com
In Partnership with
&
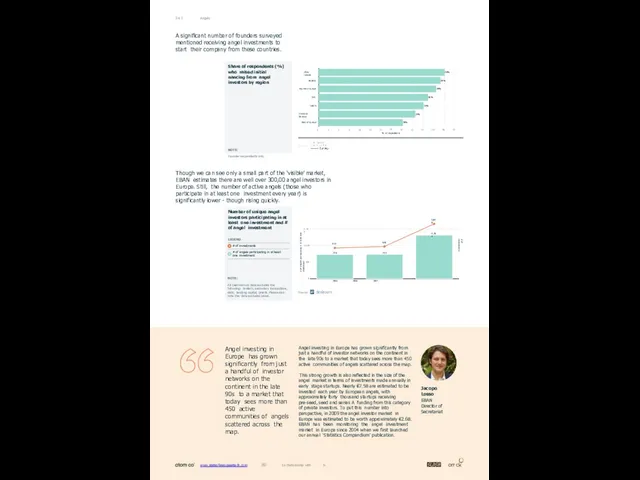
www.stateofeuropeantech.com 80 In Partnership with &
Angels
04.3
A significant number of founders surveyed mentioned receiving angel
www.stateofeuropeantech.com 80 In Partnership with &
Angels
04.3
A significant number of founders surveyed mentioned receiving angel
Though we can see only a small part of the ‘visible’ market, EBAN estimates there are well over 300,00 angel investors in Europe. Still, the number of active angels (those who participate in at least one investment every year) is significantly lower - though rising quickly.
30%
29%
28%
26%
25%
23%
20%
UK & Ireland
Nordics
Southern Europe
CEE
DACH
France & Benelux
Rest of Europe
0
3
5
8
10
13
15
18
% of respondents
20
23
25
28
30
33
# of angels participating in at least one investment
# of investments
923
970
1,648
726
733
1,314
2015 2016 2017
0
500
1,000
1,500
Share of respondents (%) who raised initial nancing from angel investors by region
NOTE:
Founder respondents only.
Number of unique angel investors participating in at least one investment and # of angel investment
LEGEND
# of investments
# of angels participating in at least one investment
NOTE:
All Dealroom.co data excludes the following: biotech, secondary transactions, debt, lending capital, grants. Please also note the data excludes Israel.
Angel investing in Europe has grown significantly from just a handful of investor networks on the continent in the late 90s to a market that today sees more than 450 active communities of angels scattered across the map.
Angel investing in Europe has grown significantly from just a handful of investor networks on the continent in the late 90s to a market that today sees more than 450 active communities of angels scattered across the map.
This strong growth is also reflected in the size of the angel market in terms of investments made annually in early stage startups. Nearly €7.5B are estimated to be invested each year by European angels, with approximately forty thousand startups receiving pre-seed, seed and series A funding from this category of private investors. To put this number into perspective, in 2009 the angel investor market in Europe was estimated to be worth approximately €2.6B.
EBAN has been monitoring the angel investment market in Europe since 2004 when we first launched our annual ‘Statistics Compendium’ publication.
Jacopo Losso
EBAN
Director of Secretariat
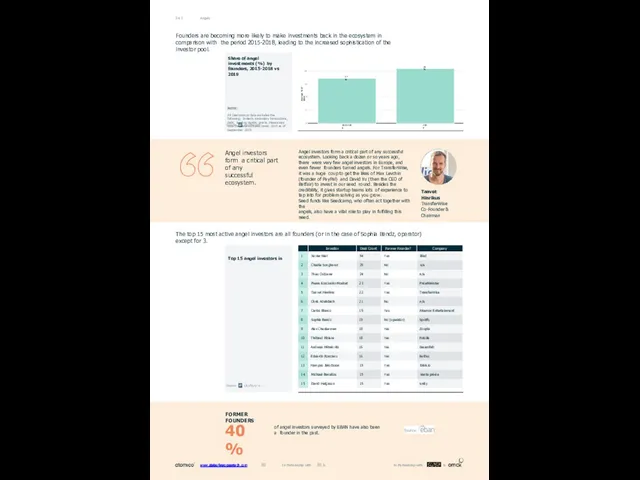
Angels
04.3
Founders are becoming more likely to make investments back in the
Angels
04.3
Founders are becoming more likely to make investments back in the
Average % of deals
17%
21%
2015-2018
2019
0
5
10
15
20
The top 15 most active angel investors are all founders (or in the case of Sophia Bendz, operator) except for 3.
Top 15 angel investors in Europe by deal count, 2015-2019
Share of angel investments (%) by founders, 2015-2018 vs 2019
NOTE:
All Dealroom.co data excludes the following: biotech, secondary transactions, debt, lending capital, grants. Please also note the data excludes Israel. 2019 as of September 2019.
Angel investors form a critical part of any
successful ecosystem.
Angel investors form a critical part of any successful ecosystem. Looking back a dozen or so years ago, there were very few angel investors in Europe, and even fewer founders turned angels. For TransferWise, it was a huge coup to get the likes of Max Levchin (founder of PayPal) and David Yu (then the CEO of Betfair) to invest in our seed round. Besides the credibility, it gives startup teams lots of experience to tap into for problem solving as you grow.
Seed funds like Seedcamp, who often act together with the
angels, also have a vital role to play in fulfilling this need.
Taavet Hinrikus TransferWise Co-Founder & Chairman
FORMER FOUNDERS
of angel investors surveyed by EBAN have also been a founder in the past.
40%
www.stateofeuropeantech.com 81 In Partnership with &
www.stateofeuropeantech.com
In Partnership with
&
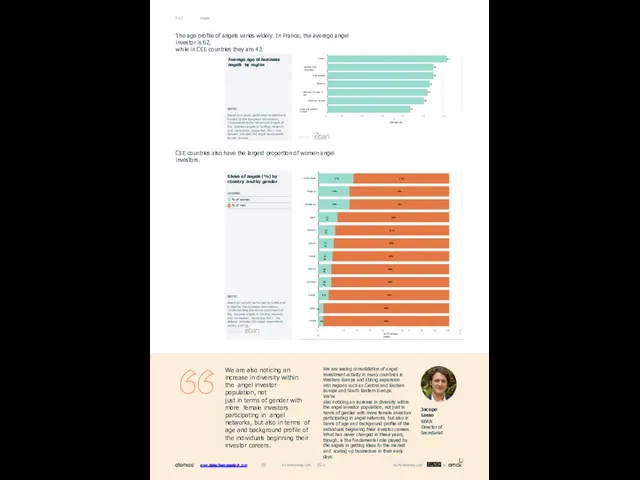
Angels
04.3
The age profile of angels varies widely. In France, the average
Angels
04.3
The age profile of angels varies widely. In France, the average
while in CEE countries they are 43.
CEE countries also have the largest proportion of women angel investors.
62
55
55
53
52
50
43
France
Austria and Germany
Switzerland
Benelux
Northern Europe + UK
Southern Europe
Central & Eastern Europe
27%
24%
24%
15%
13%
12%
11%
10%
10%
8%
4%
73%
76%
76%
85%
87%
88%
89%
90%
90%
92%
96%
96%
Switzerland
Bulgaria
Macedonia
Spain
Slovenia
Cyprus
Finland
Ukraine
Slovakia
Croatia
Latvia 4%
Ireland
0 10
20
30
40
50 60
% of business angels
70
80
90
100
110
0 10 20 30 40 50 60 70
Average age
Average age of business angels by region
NOTE:
Based on a study performed by EBAN and funded by the European commission, 'Understanding the nature and impact of the business angels in funding research and innovation', November 2017. The dataset includes 592 angel respondents across Europe.
Share of angels (%) by country and by gender
LEGEND
% of women
% of men
NOTE:
Based on a study performed by EBAN and funded by the European commission, 'Understanding the nature and impact of the business angels in funding research and innovation', November 2017. The dataset includes 592 angel respondents across Europe.
We are also noticing an increase in diversity within the angel investor population, not
just in terms of gender with more female investors participating in angel networks, but also in terms of age and background profile of the individuals beginning their investor careers.
We are seeing consolidation of angel investment activity in many countries in Western Europe and strong expansion into regions such as Central and Eastern Europe and South Eastern Europe. We’re
also noticing an increase in diversity within the angel investor population, not just in terms of gender with more female investors participating in angel networks, but also in terms of age and background profile of the individuals beginning their investor careers. What has never changed in these years, though, is the fundamental role played by the angels in getting ideas to the market and scaling up businesses in their early days.
Jacopo Losso
EBAN
Director of Secretariat
www.stateofeuropeantech.com 81 In Partnership with &
www.stateofeuropeantech.com
In Partnership with
&
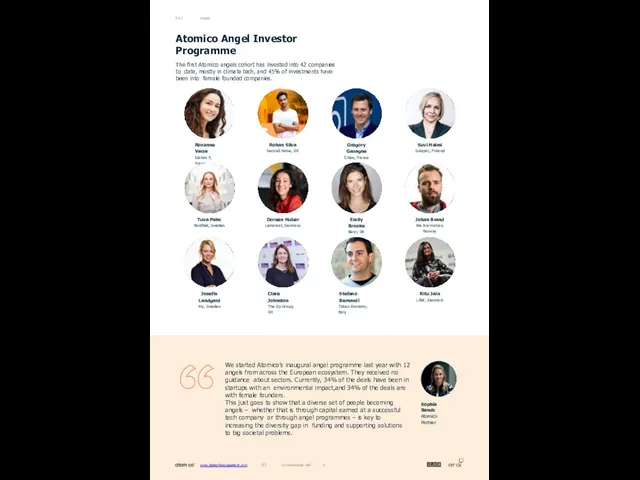
www.stateofeuropeantech.com 83 In Partnership with &
Angels
04.3
Roxanne Varza
Station F, France
Tuva Palm
NordNet, Sweden
Josefin Landgard
Kry, Sweden
Gregory Gazagne
Criteo,
www.stateofeuropeantech.com 83 In Partnership with &
Angels
04.3
Roxanne Varza
Station F, France
Tuva Palm
NordNet, Sweden
Josefin Landgard
Kry, Sweden
Gregory Gazagne
Criteo,
Emily Brooke
Beryl, UK
Stefano Bernardi
Token Economy, Italy
Rohan Silva
Second Home, UK
Doreen Huber
Lemoncat, Germany
Clare Johnston
The Up Group, UK
Suvi Haimi
Sulapac, Finland
Johan Brand
We Are Human, Norway
Ritu Jain
LifeX, Denmark
Atomico Angel Investor Programme
The first Atomico angels cohort has invested into 42 companies to date, mostly in climate tech, and 45% of investments have been into female founded companies.
We started Atomico’s inaugural angel programme last year with 12 angels from across the European ecosystem. They received no guidance about sectors. Currently, 34% of the deals have been in startups with an environmental impact,and 34% of the deals are with female founders.
This just goes to show that a diverse set of people becoming angels – whether that is through capital earned at a successful tech company or through angel programmes – is key to increasing the diversity gap in funding and supporting solutions to big societal problems.
Sophia Bendz Atomico Partner
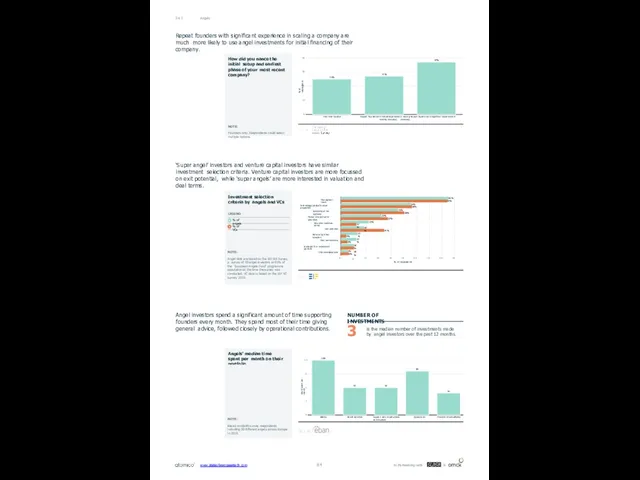
Angels
04.3
Repeat founders with significant experience in scaling a company are much
Angels
04.3
Repeat founders with significant experience in scaling a company are much
‘Super angel’ investors and venture capital investors have similar investment selection criteria. Venture capital investors are more focussed on exit potential, while ‘super angels’ are more interested in valuation and deal terms.
Angel investors spend a significant amount of time supporting founders every month. They spend most of their time giving general advice, followed closely by operational contributions.
% of respondents
25%
27%
37%
First-time founder
Repeat founder with limited experience in scaling Repeat founder with significant experience in scaling company company
0
10
20
30
40
85%
55%
45%
32%
22%
18%
13%
12%
84%
56%
50%
37%
12%
34%
4%
5%
10%
10%
Managment team
Technology/product's value proposition
Scalability of the business
Market size (actual or potential)
Valuation and deal terms
Exit potential
Referral by other investors
Past performance
Strategic fit in investment portfolio
ESG considerations
0
5%
6%
10
20
30
40
50 60
% of respondents
70
80
90
hours spent per month
10h
5h
5h
8h
4h
Advice
Board activities
Support with introductions Operational contributions
Financial intermediation
0
3
5
8
10
Investment selection criteria by angels and VCs
LEGEND
% of angels
% of VCs
Angels' median time spent per month on their portfolio
How did you nance the initial setup and earliest phase of your most recent company?
NOTE:
Founders only. Respondents could select multiple options.
NOTE:
Angel data are based on the EIF BA Survey, a survey of 60 angel investors or 65% of the ‘European Angels Fund’ programme population at the time the survey was conducted. VC data is based on the EIF VC Survey 2019.
NOTE:
Based on EBAN survey respondents including 90 different angels across Europe in 2019.
is the median number of investments made by angel investors over the past 12 months.
NUMBER OF INVESTMENTS
3
www.stateofeuropeantech.com
In Partnership with
&
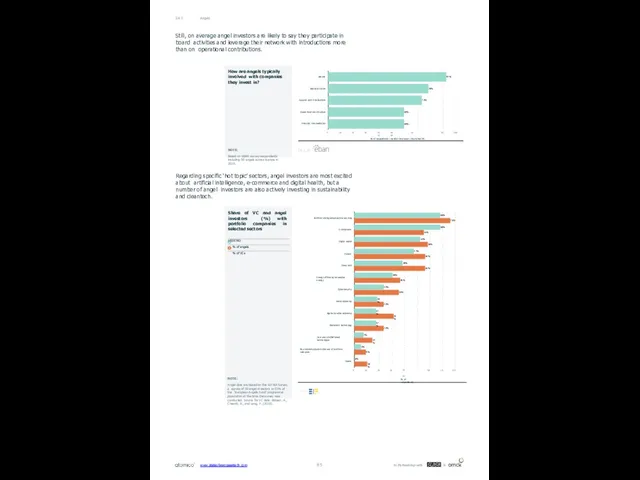
Angels
04.3
Still, on average angel investors are likely to say they participate
Angels
04.3
Still, on average angel investors are likely to say they participate
Regarding specific ‘hot topic’ sectors, angel investors are most excited about artificial intelligence, e-commerce and digital health, but a number of angel investors are also actively investing in sustainability and cleantech.
92%
78%
73%
59%
59%
Advice
Board activities
Support with introductions
Operational contributions
Financial intermediation
0
10
20
30
40 50 60 70 80
% of respondents / median time spent (hours/month)
90
100
68%
68%
52%
47%
38%
30%
23%
18%
17%
17%
7%
5%
0%
76%
55%
58%
56%
56%
36%
35%
23%
31%
23%
14%
9%
10%
Artificial intelligence/machine learning
E-commerce
Digital health
Fintech
Deep tech
Energy efficiency/renewable energy
Cybersecurity
Social economy
Agriculture/bio-economy
Blockchain technology
Dual use (civi/defense) technologies
Blue economy/sustainable use of maritime resources
Space
0
10
20
30
40 50
% of respondents
60
70
80
How are angels typically involved with companies they invest in?
NOTE:
Based on EBAN survey respondents including 90 angels across Europe in 2019.
Share of VC and angel investors (%) with portfolio companies in selected sectors
LEGEND
% of angels
% of VCs
NOTE:
Angel data are based on the EIF BA Survey, a survey of 60 angel investors or 65% of the ‘European Angels Fund’ programme population at the time the survey was conducted. Source for VC data: Botsari, A., Crisanti, A., and Lang, F. (2019).
www.stateofeuropeantech.com
In Partnership with
&
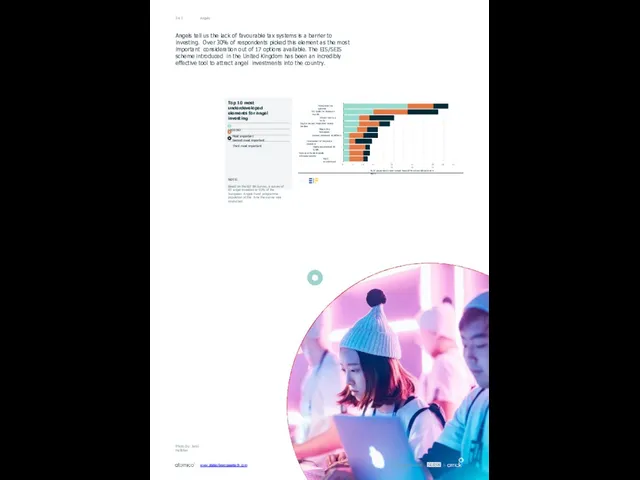
Angels
04.3
Angels tell us the lack of favourable tax systems is a
Angels
04.3
Angels tell us the lack of favourable tax systems is a
Favourable tax systems
VC funds for follow-on rounds
Vibrant start-up hubs
Capital market integration across borders
Regulatory framework
General economic conditions
Involvement of corporate investors
Highly experienced VC funds
Cultural attitude towards entrepreneurship
R&D environment
0
5
10
15 20 25 30 35 40 45
% of respondents who ranked these different considerations in top 3
50
55
Top 10 most underdeveloped elements for angel investing
LEGEND
Most important
Second most important Third most important
NOTE:
Based on the EIF BA Survey, a survey of 60 angel investors or 65% of the ‘European Angels Fund’ programme population at the time the survey was conducted.
Photo by: Jussi Hellsten
www.stateofeuropeantech.com
In Partnership with
&
05
Diversity & Inclusion
Does European tech still lack diversity and inclusion?
Despiteincreasedawarenessalackofdiversity,theproblemremains entrenched.
05
Diversity & Inclusion
Does European tech still lack diversity and inclusion?
Despiteincreasedawarenessalackofdiversity,theproblemremains entrenched.
www.stateofeuropeantech.com
In Partnership with
&
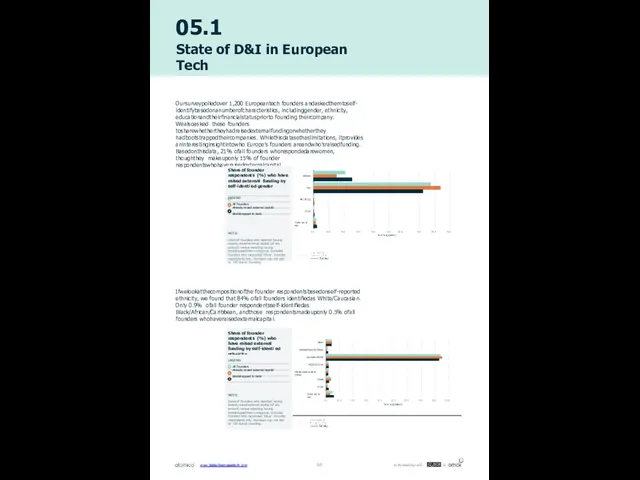
Share of founder respondents (%) who have raised external funding by
Share of founder respondents (%) who have raised external funding by
LEGEND
All founders
Already raised external capital Bootstrapped to date
Asian
Black/African/Caribbean
Caucasian/White
Hispanic/Latinx
Middle Eastern/North African
Mixed
Other
Prefer not to say
0.0
10.0
20.0
30.0
40.0
50.0 60.0
% of respondents
70.0
80.0
90.0
05.1
State of D&I in European Tech
Oursurveypolledover 1,200 Europeantech founders andaskedthemtoself- identifybasedonanumberofcharacteristics, includinggender, ethnicity, educationandtheirfinancialstatuspriorto founding theircompany. Wealsoasked these founders tosharewhethertheyhadraisedexternalfundingorwhetherthey hadbootstrappedtheircompanies. Whilethisdatasethaslimitations, itprovides aninterestinginsightintowho Europe’s founders areandwho’sraisedfunding.
Basedonthisdata, 21% ofall founders whorespondedarewomen, thoughthey makeuponly 15% of founder respondentswhohaveraisedexternalcapital.
Ifwelookatthecompositionofthe founder respondentsbasedonself-reported ethnicity, we found that 84% ofall founders identifiedas White/Caucasian. Only 0.9% ofall founder respondentsself-identifiedas Black/African/Caribbean, andthose respondentsmadeuponly 0.5% ofall founders whohaveraisedexternalcapital.
NOTE:
Share of founders who reported having already raised external capital (of any amount) versus reporting having bootstrapped their companies. Excludes founders who responded 'Other'. Founder respondents only. Numbers may not add to 100 due to rounding.
Women
Men
Non-Binary
Other
Prefer not to say
0.0
10.0
20.0
30.0
40.0
50.0 60.0
% of respondents
70.0
80.0
90.0
Share of founder respondents (%) who have raised external funding by self-identi ed gender
LEGEND
All founders
Already raised external capital Bootstrapped to date
NOTE:
Share of founders who reported having already raised external capital (of any amount) versus reporting having bootstrapped their companies. Excludes founders who responded 'Other'. Founder respondents only. Numbers may not add to 100 due to rounding.
www.stateofeuropeantech.com
In Partnership with
&
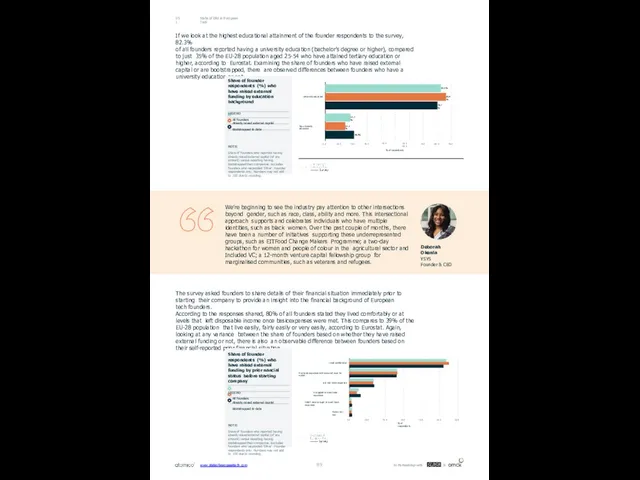
State of D&I in European Tech
05.1
If we look at the highest
State of D&I in European Tech
05.1
If we look at the highest
of all founders reported having a university education (bachelor’s degree or higher), compared to just 35% of the EU-28 population aged 25-54 who have attained tertiary education or higher, according to Eurostat. Examining the share of founders who have raised external capital or are bootstrapped, there are observed differences between founders who have a university education or not.
The survey asked founders to share details of their financial situation immediately prior to starting their company to provide an insight into the financial background of European tech founders.
According to the responses shared, 80% of all founders stated they lived comfortably or at levels that left disposable income once basicexpenses were met. This compares to 39% of the EU-28 population that live easily, fairly easily or very easily, according to Eurostat. Again, looking at any variance between the share of founders based on whether they have raised external funding or not, there is also an observable difference between founders based on their self-reported prior financial situation.
We’re beginning to see the industry pay attention to other intersections beyond gender, such as race, class, ability and more. This intersectional approach supports and celebrates individuals who have multiple identities, such as black women. Over the past couple of months, there have been a number of initiatives supporting these underrepresented groups, such as EITFood Change Makers Programme; a two-day hackathon for women and people of colour in the agricultural sector and Included VC; a 12-month venture capital fellowship group for marginalised communities, such as veterans and refugees.
Deborah Okenla
YSYS
Founder & CEO
Share of founder respondents (%) who have raised external funding by education background
LEGEND
All founders
Already raised external capital Bootstrapped to date
NOTE:
Share of founders who reported having already raised external capital (of any amount) versus reporting having bootstrapped their companies. Excludes founders who responded 'Other'. Founder respondents only. Numbers may not add to 100 due to rounding.
82.3%
17.7%
85.9%
14.1%
79.7%
20.3%
University educated
No university education
0.0
10.0
20.0
30.0
40.0 50.0 60.0
% of respondents
70.0
80.0
90.0
Lived comfortably
Met basic expenses with some left over for extras
Just met basic expenses
Struggled to meet basic expenses
Didn't have enough to meet basic expenses
Rather not say
0.0
10.0
20.0
30.0
% of respondents
40.0
50.0
60.0
Share of founder respondents (%) who have raised external funding by prior nancial status before starting company
LEGEND
All founders
Already raised external capital Bootstrapped to date
NOTE:
Share of founders who reported having already raised external capital (of any amount) versus reporting having bootstrapped their companies. Excludes founders who responded 'Other'. Founder respondents only. Numbers may not add to 100 due to rounding.
www.stateofeuropeantech.com
In Partnership with
&
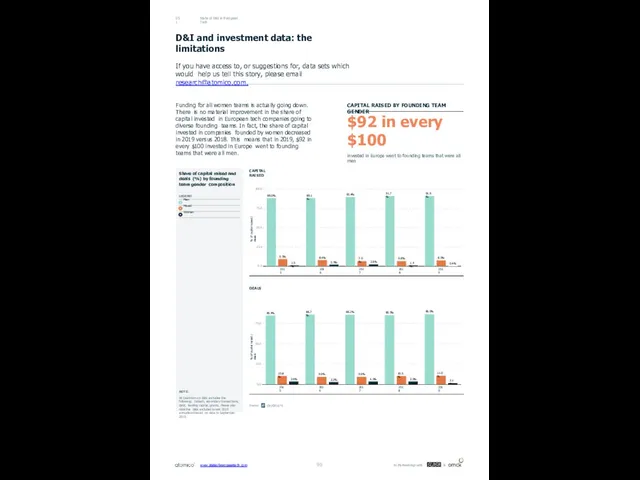
CAPITAL RAISED
% of capital raised / deals
85.4%
86.7%
86.2%
85.5%
86.9%
10.8%
9.9%
9.9%
10.6%
11.0%
3.9%
3.3%
4.0%
3.9%
2.1%
2015
2016
2017
2018
2019
0.0
25.0
50.0
75.0
D&I and investment data: the
CAPITAL RAISED
% of capital raised / deals
85.4%
86.7%
86.2%
85.5%
86.9%
10.8%
9.9%
9.9%
10.6%
11.0%
3.9%
3.3%
4.0%
3.9%
2.1%
2015
2016
2017
2018
2019
0.0
25.0
50.0
75.0
D&I and investment data: the
If you have access to, or suggestions for, data sets which would help us tell this story, please email research@atomico.com.
State of D&I in European Tech
05.1
Funding for all women teams is actually going down. There is no material improvement in the share of capital invested in European tech companies going to diverse founding teams. In fact, the share of capital invested in companies founded by women decreased in 2019 versus 2018. This means that in 2019, $92 in every $100 invested in Europe went to founding teams that were all men.
CAPITAL RAISED BY FOUNDING TEAM GENDER
$92 in every $100
invested in Europe went to founding teams that were all men
% of capital raised / deals
89.0%
89.1%
90.4%
91.7%
91.6%
9.5%
8.4%
7.0%
6.8%
8.0%
1.5%
2.5%
2.6%
1.4%
0.4%
2015
2016
2017
2018
2019
0.0
25.0
50.0
75.0
100.0
DEALS
Share of capital raised and deals (%) by founding team gender composition
LEGEND
Men Mixed Women
NOTE:
All Dealroom.co data excludes the following: biotech, secondary transactions, debt, lending capital, grants. Please also note the data excludes Israel. 2019 annualised based on data to September 2019.
www.stateofeuropeantech.com
In Partnership with
&
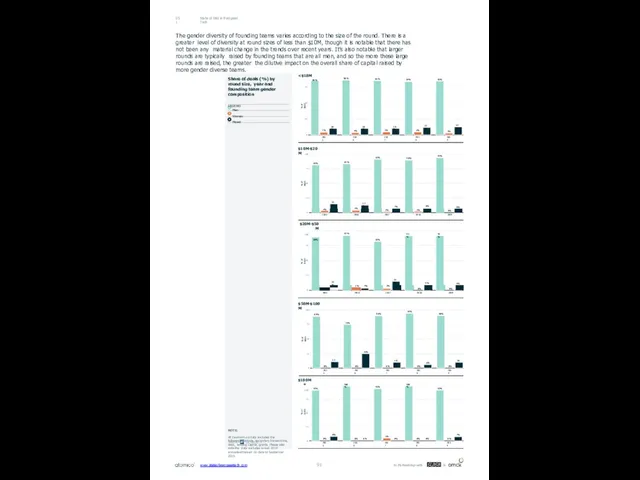
% of deals
86%
85%
84%
85%
4%
4%
4%
5%
3%
10%
10%
10%
12%
13%
2015
2016
2017
2018
2019
0
25
50
75
% of deals
82%
84%
92%
90%
94%
4%
15%
13%
7%
8%
6%
0
25
50
75
100
$10M-$20M
% of deals
92%
82%
91%
91%
11%
15%
9%
9%
0
25
50
75
$20M-$50M
100
89%
<$10M
86%
State of D&I in European
% of deals
86%
85%
84%
85%
4%
4%
4%
5%
3%
10%
10%
10%
12%
13%
2015
2016
2017
2018
2019
0
25
50
75
% of deals
82%
84%
92%
90%
94%
4%
15%
13%
7%
8%
6%
0
25
50
75
100
$10M-$20M
% of deals
92%
82%
91%
91%
11%
15%
9%
9%
0
25
50
75
$20M-$50M
100
89%
<$10M
86%
State of D&I in European
05.1
The gender diversity of founding teams varies according to the size of the round. There is a greater level of diversity at round sizes of less than $10M, though it is notable that there has not been any material change in the trends over recent years. It’s also notable that larger rounds are typically raised by founding teams that are all men, and so the more these large rounds are raised, the greater the dilutive impact on the overall share of capital raised by more gender diverse teams.
Share of deals (%) by round size, year and founding team gender composition
LEGEND
Men Women Mixed
NOTE:
All Dealroom.co data excludes the following: biotech, secondary transactions, debt, lending capital, grants. Please also note the data excludes Israel. 2019 annualised based on data to September 2019.
% of deals
92%
100%
95%
100%
93%
0%
0%
5%
0%
0%
8%
0%
0%
0%
7%
2015
2016
2017
2018
2019
0
25
50
75
$100M+
100
% of deals
89%
www.stateofeuropeantech.com
In Partnership with
&
75%
90%
94%
90%
0%
0%
0%
0%
0%
11%
25%
10%
6%
10%
2015
2016
2017
2018
2019
0
25
50
75
100
$50M-$100M
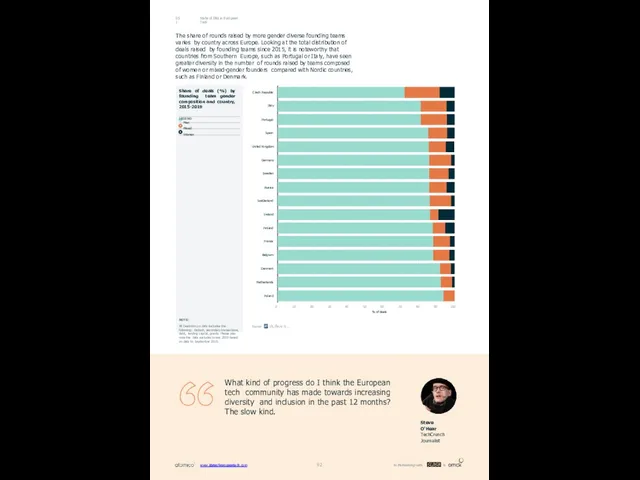
Czech Republic
Italy
Portugal
Spain
United Kingdom
Germany
Sweden
Russia
Switzerland
Ireland
Finland
France
Belgium
Denmark
Netherlands
Poland
0
10
20
30
40
50
60
% of deals
70
80
90
100
State of D&I in European Tech
05.1
The share
Czech Republic
Italy
Portugal
Spain
United Kingdom
Germany
Sweden
Russia
Switzerland
Ireland
Finland
France
Belgium
Denmark
Netherlands
Poland
0
10
20
30
40
50
60
% of deals
70
80
90
100
State of D&I in European Tech
05.1
The share
Share of deals (%) by founding team gender composition and country, 2015-2019
LEGEND
Men Mixed Women
NOTE:
All Dealroom.co data excludes the following: biotech, secondary transactions, debt, lending capital, grants. Please also note the data excludes Israel. 2019 based on data to September 2019.
What kind of progress do I think the European tech community has made towards increasing diversity and inclusion in the past 12 months? The slow kind.
Steve O'Hear TechCrunch Journalist
www.stateofeuropeantech.com
In Partnership with
&
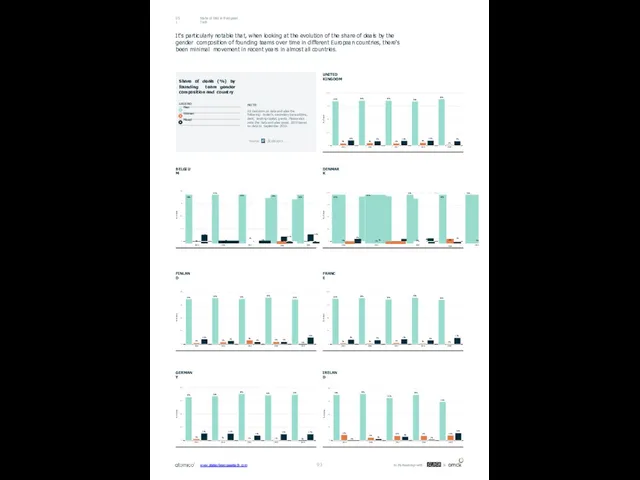
State of D&I in European Tech
05.1
It's particularly notable that, when looking
State of D&I in European Tech
05.1
It's particularly notable that, when looking
BELGIUM
DENMARK
FRANCE
FINLAND
% of deals
93%
0
25
50
75
100
% of deals
87%
89%
87%
90%
86%
3%
4%
8%
5%
0%
10%
7%
5%
5%
14%
2015
2016
2017
2018
2019
0
25
50
75
100
% of deals
88%
89%
87%
90%
86%
3%
2%
3%
2%
2%
9%
9%
10%
8%
13%
2015
2016
2017
2018
2019
0
25
50
75
100
% of deals
0
25
50
75
100
TASET: UNITED KINGDOM
% of deals
85%
86%
86%
85%
89%
5%
5%
5%
6%
2%
10%
9%
10%
10%
9%
2015
2016
2017
2018
2019
0
25
50
75
100
UNITED KINGDOM
Share of deals (%) by founding team gender composition and country
LEGEND
Men Women Mixed
NOTE:
All Dealroom.co data excludes the following: biotech, secondary transactions, debt, lending capital, grants. Please also note the data excludes Israel. 2019 based on data to September 2019.
% of deals
83%
85%
89%
87%
87%
3%
2%
1%
1%
0%
14%
14%
10%
13%
13%
2015
2016
2017
2018
2019
0
25
50
75
100
% of deals
88%
www.stateofeuropeantech.com
In Partnership with
&
90%
83%
88%
75%
12%
6%
10%
9%
10%
0%
4%
8%
2%
15%
2015
2016
2017
2018
2019
0
25
50
75
100
IRELAND
GERMANY

www.stateofeuropeantech.com
In Partnership with
&
www.stateofeuropeantech.com
In Partnership with
&
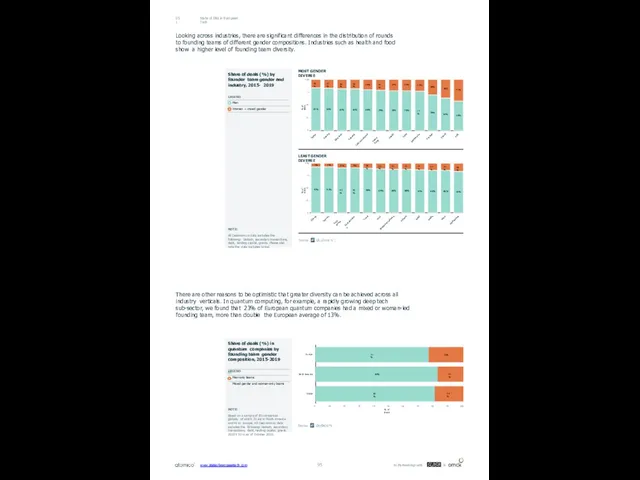
Share of deals (%) by founder team gender and industry, 2015-
Share of deals (%) by founder team gender and industry, 2015-
LEGEND
Men
Women + mixed gender
NOTE:
All Dealroom.co data excludes the following: biotech, secondary transactions, debt, lending capital, grants. Please also note the data excludes Israel.
% of deals
84%
83%
82%
82%
80%
79%
78%
78%
77%
70%
64%
58%
16%
17%
18%
18%
20%
21%
22%
22%
23%
30%
36%
42%
Sports
Gaming
Education
Robotics
Jobs recruitment
Home living
Health
Food
Ecommerce
Fashion
Dating
Kids
0
25
50
75
100
% of deals
93%
93%
91%
91%
90%
89%
88%
88%
87%
86%
86%
84%
7%
7%
9%
9%
10%
11%
12%
12%
13%
14%
14%
16%
Energy
Security
Real estate
Transportation
Travel
SaaS
Enterprise software
Fintech
Legal
Media
Music
Marketplace
0
25
50
75
100
State of D&I in European Tech
05.1
Looking across industries, there are significant differences in the distribution of rounds
to founding teams of different gender compositions. Industries such as health and food show a higher level of founding team diversity.
There are other reasons to be optimistic that greater diversity can be achieved across all industry verticals. In quantum computing, for example, a rapidly growing deep tech sub-sector, we found that 23% of European quantum companies had a mixed or woman-led founding team, more than double the European average of 13%.
Share of deals (%) in quantum companies by founding team gender composition, 2015-2019
LEGEND
Men-only teams
Mixed gender and women-only teams
NOTE:
Based on a sample of 85 companies globally of which 35 are in North America and 44 in Europe. All Dealroom.co data excludes the following: biotech, secondary transactions, debt, lending capital, grants. 2019 YTD is as of October 2019.
77%
83%
81%
23%
17%
19%
Europe
North America
Global
0
10
20
30
40
50
% of deals
60
70
80
90
100
LEAST GENDER DIVERSE
MOST GENDER DIVERSE
www.stateofeuropeantech.com
In Partnership with
&
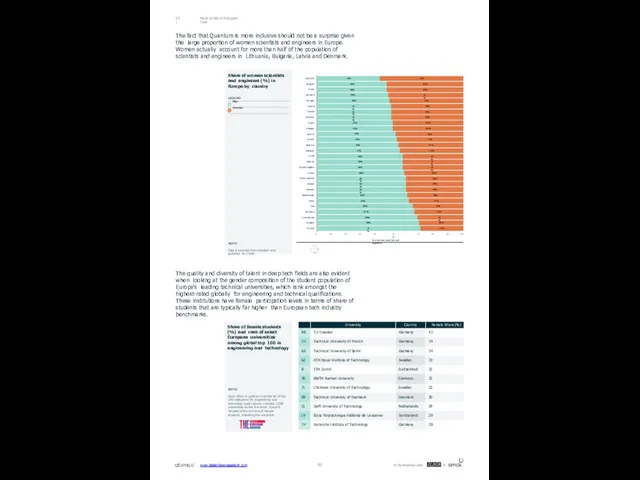
State of D&I in European Tech
05.1
The fact that Quantum is more
State of D&I in European Tech
05.1
The fact that Quantum is more
The quality and diversity of talent in deep tech fields are also evident when looking at the gender composition of the student population of Europe's leading technical universities, which rank amongst the highest-rated globally for engineering and technical qualifications. These institutions have female participation levels in terms of share of students that are typically far higher than European tech industry benchmarks.
Share of women scientists and engineers (%) in Europe by country
LEGEND
Men Women
NOTE:
Data is sourced from Eurostat and gathered by CERN.
43%
48%
48%
49%
50%
51%
51%
51%
52%
52%
54%
55%
56%
57%
59%
59%
59%
60%
61%
61%
61%
62%
63%
66%
67%
69%
70%
71%
57%
52%
52%
51%
50%
49%
49%
49%
48%
48%
46%
45%
44%
43%
41%
41%
41%
40%
39%
39%
39%
38%
37%
34%
33%
31%
30%
29%
Lithuania
Bulgaria
Latvia
Denmark
Portugal
Ireland
Poland
Romania
Spain
Sweden
Austria
Croatia
Belgium
Slovenia
EU-28
Estonia
United Kingdom
France
Czech republic
Greece
Slovakia
Netherlands
Malta
Italy
Germany
Luxembourg
Hungary
Finland
0
10
20
30
40 50 60
% of women scientists and engineers
70
80
90
100
Share of female students (%) and rank of select European universities among global top 100 in engineering and technology
NOTE:
Rank refers to position in global list of top 100 institutions for engineering and technology quali cations. Includes 1,008 universities across the world. Share of females refers to share of female students attending the university.
www.stateofeuropeantech.com
In Partnership with
&
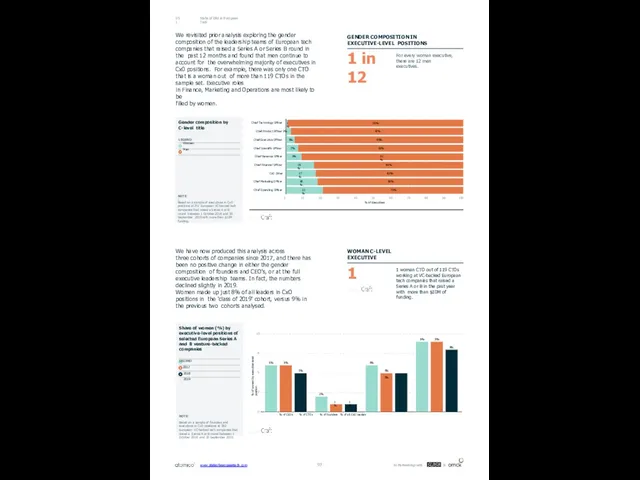
We revisited prior analysis exploring the gender composition of the leadership
We revisited prior analysis exploring the gender composition of the leadership
in Finance, Marketing and Operations are most likely to be
filled by women.
For every woman executive, there are 12 men executives.
1 woman CTO out of 119 CTOs working at VC-backed European tech companies that raised a Series A or B in the past year with more than $10M of funding.
GENDER COMPOSITION IN EXECUTIVE-LEVEL POSITIONS
WOMAN C-LEVEL EXECUTIVE
1 in 12
1
State of D&I in European Tech
05.1
We have now produced this analysis across
three cohorts of companies since 2017, and there has been no positive change in either the gender composition of founders and CEO's, or at the full executive leadership teams. In fact, the numbers declined slightly in 2019.
Women made up just 8% of all leaders in CxO positions in the 'class of 2019' cohort, versus 9% in the previous two cohorts analysed.
Gender composition by C-level title
LEGEND
Women Men
NOTE:
Based on a sample of executives in CxO positions at 251 European VC-backed tech companies that raised a Series A or B round between 1 October 2018 and 30 September 2019 with more than $10M funding.
1%
5%
7%
9%
16%
17%
18%
21%
99%
97%
95%
93%
91%
84%
83%
82%
79%
Chief Technology Officer
Chief Product Officer 3%
Chief Executive Officer
Chief Scientific Officer
Chief Revenue Officer
Chief Financial Officer
CxO Other
Chief Marketing Officer
Chief Operating Officer
0
10
20
30
40
50
% of Executives
60
70
80
90
100
Share of women (%) by executive-level positions of selected European Series A and B venture-backed companies
LEGEND
2017
2018
2019
NOTE:
Based on a sample of founders and executives in CxO positions at 382 European VC-backed tech companies that raised a Series A or B round between 1 October 2018 and 30 September 2019.
% of women by executive-level position
6%
2%
6%
9%
6%
1%
9%
5%
1%
5% 5%
8%
% of CEOs % of CTOs % of founders % of all CxO leaders
0
3
5
8
10
www.stateofeuropeantech.com
In Partnership with
&
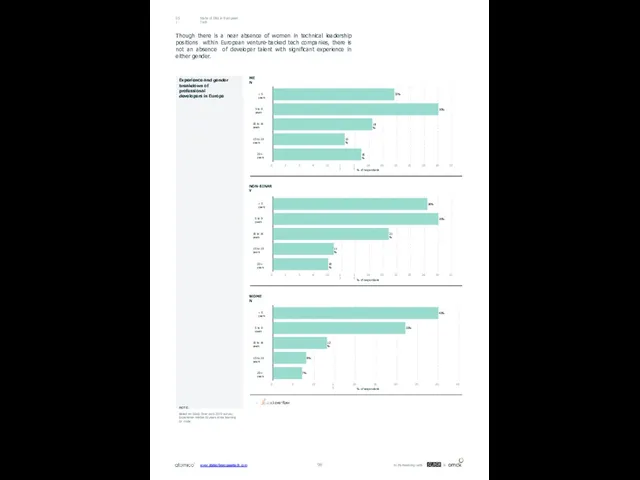
22%
30%
18%
13%
16%
< 5 years
5 to 9 years
10 to 14 years
15 to 19
22%
30%
18%
13%
16%
< 5 years
5 to 9 years
10 to 14 years
15 to 19
20+ years
0
3
5
8
10
13
15
18
% of respondents
20
23
25
28
30
33
Though there is a near absence of women in technical leadership positions within European venture-backed tech companies, there is not an absence of developer talent with significant experience in either gender.
State of D&I in European Tech
05.1
28%
30%
21%
11%
10%
< 5 years
5 to 9 years
10 to 14 years
15 to 19 years
20+ years
0
3
5
8
10
13
15
18
% of respondents
20
23
25
28
30
33
NON-BINARY
40%
32%
13%
8%
7%
< 5 years
5 to 9 years
10 to 14 years
15 to 19 years
20+ years
0
5
10
15
20
25
% of respondents
30
35
40
45
WOMEN
Experience and gender breakdown of professional developers in Europe
NOTE:
Based on Stack Over ow's 2019 survey. Experience relates to years since learning to code.
MEN
www.stateofeuropeantech.com
In Partnership with
&
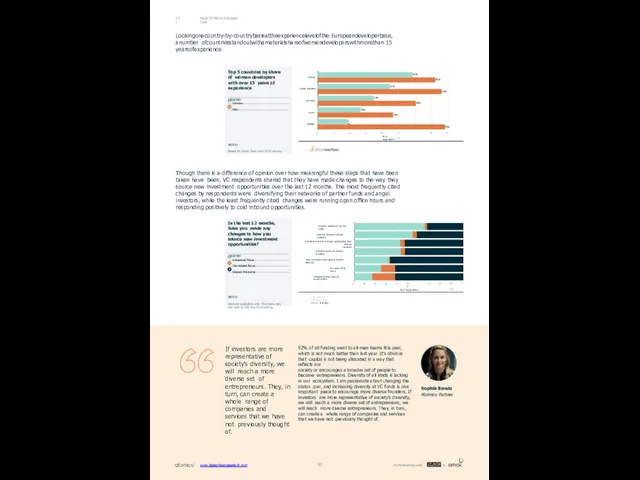
If investors are more representative of society's diversity, we will reach
If investors are more representative of society's diversity, we will reach
92% of all funding went to all-men teams this year, which is not much better than last year. It’s obvious that capital is not being allocated in a way that reflects our
society or encourages a broader set of people to become entrepreneurs. Diversity of all kinds is lacking in our ecosystem. I am passionate about changing the status quo, and increasing diversity at VC funds is one important piece to encourage more diverse founders. If investors are more representative of society's diversity, we will reach a more diverse set of entrepreneurs, we will reach more diverse entrepreneurs. They, in turn, can create a whole range of companies and services that we have not previously thought of.
Sophia Bendz
Atomico Partner
State of D&I in European Tech
05.1
Lookingonacountry-by-countrybasisattheexperiencelevelofthe Europeandeveloperbase, anumber ofcountriesstandoutwithamaterialshareofwomendeveloperswithmorethan 15 yearsofexperience.
Though there is a difference of opinion over how meaningful these steps that have been taken have been, VC respondents shared that they have made changes to the way they source new investment opportunities over the last 12 months. The most frequently cited changes by respondents were diversifying their networks of partner funds and angel investors, while the least frequently cited changes were running open office hours and responding positively to cold inbound opportunities.
Top 5 countries by share of women developers with over 15 years of experience
LEGEND
Women Men
NOTE:
Based on Stack Over ow's 2019 survey.
% of respondents
29%
22%
17%
13%
9%
36%
38%
30%
23%
39%
Finland
United Kingdom
Germany
France
Sweden
0
5
10
15
20
25 30
35
40
Diversify network of partner funds
Diversify network of angel investors
Attend events with stronger participation from diverse
founders
Organise events for diverse founders
Focus on sectors with greater founder diversity
Run open office hours
Respond to cold inbound opportunities
0
10
20
30
40
50 60
% of respondents
70
80
90 100
In the last 12 months, have you made any changes to how you source new investment opportunities?
LEGEND
Increased focus Decreased focus Stayed the same
NOTE:
Venture capitalists only. Numbers may not add to 100 due to rounding.
www.stateofeuropeantech.com
In Partnership with
&
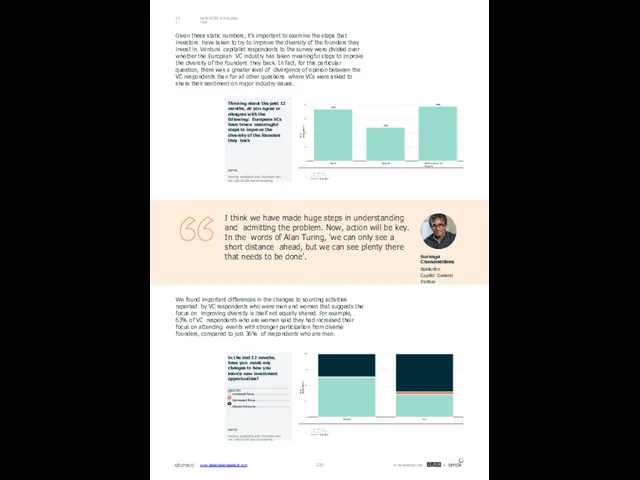
State of D&I in European Tech
05.1
Given these static numbers, it's important
State of D&I in European Tech
05.1
Given these static numbers, it's important
We found important differences in the changes to sourcing activities reported by VC respondents who were men and women that suggests the focus on improving diversity is itself not equally shared. For example, 63% of VC respondents who are women said they had increased their focus on attending events with stronger participation from diverse founders, compared to just 36% of respondents who are men.
I think we have made huge steps in understanding and admitting the problem. Now, action will be key. In the words of Alan Turing, 'we can only see a short distance ahead, but we can see plenty there that needs to be done'.
Suranga Chandratillake
Balderton Capital General Partner
Thinking about the past 12 months, do you agree or disagree with the following: European VCs have taken meaningful steps to improve the diversity of the founders they back
NOTE:
Venture capitalists only. Numbers may not add to 100 due to rounding.
% of respondents
37%
24%
39%
Agree
Disagree
Neither agree nor disagree
0
10
20
30
40
In the last 12 months, have you made any changes to how you source new investment opportunities?
LEGEND
Increased focus Decreased focus Stayed the same
NOTE:
Venture capitalists only. Numbers may not add to 100 due to rounding.
% of respondents
Women
Men
0
25
50
75
100
www.stateofeuropeantech.com
In Partnership with
&
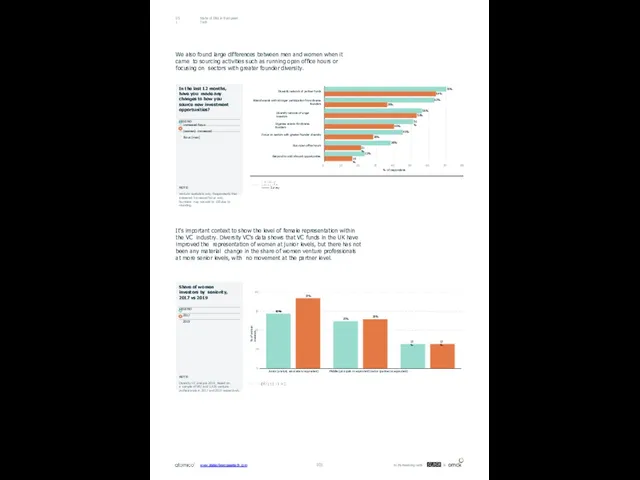
State of D&I in European Tech
05.1
We also found large differences between
State of D&I in European Tech
05.1
We also found large differences between
It's important context to show the level of female representation within the VC industry. Diversity VC's data shows that VC funds in the UK have improved the representation of women at junior levels, but there has not been any material change in the share of women venture professionals at more senior levels, with no movement at the partner level.
70%
63%
56%
51%
45%
38%
23%
64%
36%
53%
40%
28%
21%
16%
Diversify network of partner funds
Attend events with stronger participation from diverse
founders
Diversify network of angel investors
Organise events for diverse founders
Focus on sectors with greater founder diversity
Run open office hours
Respond to cold inbound opportunities
0
10
20
30
40
% of respondents
50
60
70
80
In the last 12 months, have you made any changes to how you source new investment opportunities?
LEGEND
Increased focus (women) Increased focus (men)
NOTE:
Venture capitalists only. Respondents that answered 'Increased focus' only. Numbers may not add to 100 due to rounding.
% of woman investors
29%
25%
13%
37%
26%
13%
Junior (analyst, associate or equivalent) Middle (principals or equivalent) Senior (partner or equivalent)
0
10
20
30
40
www.stateofeuropeantech.com
In Partnership with
&
Share of women investors by seniority, 2017 vs 2019
LEGEND
2017
2019
NOTE:
Diversity VC analysis 2019. Based on a sample of 987 and 1,436 venture
professionals in 2017 and 2019 respectively.
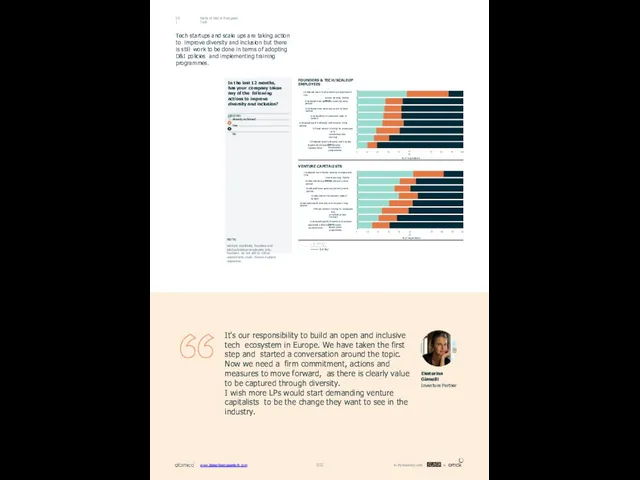
In the last 12 months, has your company taken any of
In the last 12 months, has your company taken any of
LEGEND
Already actioned Yes
No
NOTE:
Venture capitalists, founders and startup/scaleup employees only. Numbers do not add to 100 as respondents could choose multiple responses.
Introduced more flexible working arrangements (e.g.
remote working, flexible hours
Introduced more generous maternity leave policies
Introduced more generous paternity leave policies
Introduced anti-harassment code of conduct
Introduced specific diversity and inclusion hiring policies
Offered relevant training for employees (e.g.
unconscious bias training)
Introduced specific diversity and inclusion talent
development programmes
Appointed a diversity & inclusion representative
0
10
20
30
40
50 60
% of respondents
70
80
90
100
Introduced more generous maternity leave policies
Introduced more generous paternity leave policies
Introduced anti-harassment code of conduct
Introduced specific diversity and inclusion hiring policies
Offered relevant training for employees (e.g.
unconscious bias training)
Introduced specific diversity and inclusion talent
development programmes
Appointed a diversity & inclusion representative
0
10
20
30
40
50 60
% of respondents
70
80
90
10
State of D&I in European Tech
05.1
Tech startups and scale ups are taking action to improve diversity and inclusion but there is still work to be done in terms of adopting D&I policies and implementing training programmes.
VENTURE CAPITALISTS
Introduced more flexible working arrangements (e.g.
remote working, flexible hours
FOUNDERS & TECH/SCALEUP EMPLOYEES
Ekaterina Gianelli
Inventure Partner
It's our responsibility to build an open and inclusive tech ecosystem in Europe. We have taken the first step and started a conversation around the topic. Now we need a firm commitment, actions and measures to move forward, as there is clearly value to be captured through diversity.
I wish more LPs would start demanding venture capitalists to be the change they want to see in the industry.
www.stateofeuropeantech.com
In Partnership with
&
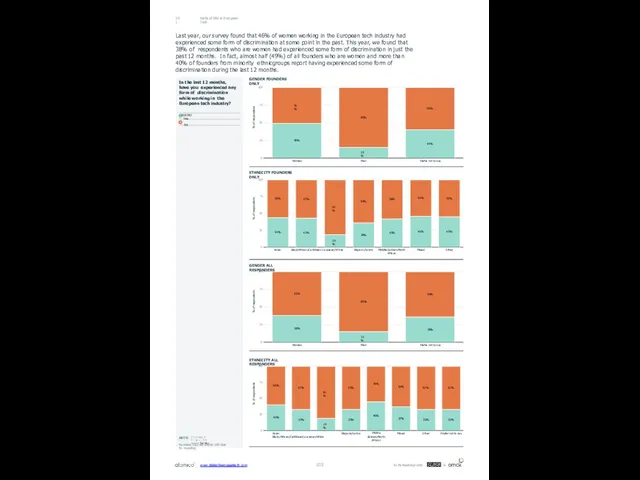
In the last 12 months, have you experienced any form of
In the last 12 months, have you experienced any form of
LEGEND
Yes No
NOTE:
Numbers may not add to 100 due to rounding.
% of respondents
49%
15%
40%
51%
85%
60%
Women
Men
Prefer not to say
0
25
50
75
100
Last year, our survey found that 46% of women working in the European tech industry had experienced some form of discrimination at some point in the past. This year, we found that 38% of respondents who are women had experienced some form of discrimination in just the past 12 months. In fact, almost half (49%) of all founders who are women and more than 40% of founders from minority ethnicgroups report having experienced some form of discrimination during the last 12 months.
% of respondents
40%
33%
19%
33%
45%
37%
33%
33%
60%
67%
81%
67%
55%
63%
67%
67%
Asian Black/African/CaribbeanCaucasian/White
Hispanic/Latinx
Middle Eastern/North African
Mixed
Other
Prefer not to say
0
25
50
75
100
ETHNICITY ALL RESPONDERS
% of respondents
44%
43%
19%
36%
42%
46%
45%
56%
57%
81%
64%
58%
54%
55%
Asian
Black/African/Caribbean Caucasian/White
Hispanic/Latinx
Middle Eastern/North African
Mixed
Other
0
25
50
75
100
ETHNICITY FOUNDERS ONLY
% of respondents
38%
15%
36%
62%
85%
64%
Women
Men
Prefer not to say
0
25
50
75
100
GENDER ALL RESPONDERS
GENDER FOUNDERS ONLY
State of D&I in European Tech
05.1
www.stateofeuropeantech.com
In Partnership with
&
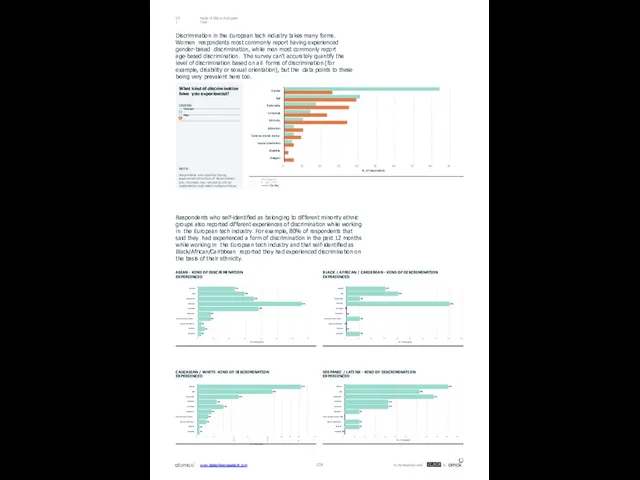
State of D&I in European Tech
05.1
Discrimination in the European tech industry
State of D&I in European Tech
05.1
Discrimination in the European tech industry
What kind of discrimination have you experienced?
LEGEND
Women Men
NOTE:
Respondents who reported having experienced some form of discrimination only. Numbers may not add to 100 as respondents could select multiple choices.
Gender
Age
Nationality
Language
Ethnicity
Education
Socio-economic status
Sexual orientation
Disability
Religion
0
10
20
30
40
50
% of respondents
60
70
80
90
Respondents who self-identified as belonging to different minority ethnic groups also reported different experiences of discrimination while working in the European tech industry. For example, 80% of respondents that said they had experienced a form of discrimination in the past 12 months while working in the European tech industry and that self-identified as Black/African/Caribbean reported they had experienced discrimination on the basis of their ethnicity.
ASIAN - KIND OF DISCRIMINATION EXPERIENCED
23%
29%
35%
65%
38%
8%
8%
2%
4%
2%
Gender
Age
Nationality
Ethnicity
Language
Education
Socio-economic status
Sexual orientation
Religion
Disability
0
10
20
30
40
% of respondents
50
60
70
CAUCASIAN / WHITE -KIND OF DISCRIMINATION EXPERIENCED
BLACK / AFRICAN / CARIBBEAN - KIND OF DISCRIMINATION EXPERIENCED
% of respondents
30%
40%
10%
80%
10%
10%
Gender
Age
Nationality
Ethnicity
Language 0%
0%
Education
Socio-economic status
Sexual orientation 0%
0%
Religion
Disability
0
10
20
30
40
50
60
70
80
90
61%
44%
24%
11%
15%
8%
6%
5%
1%
1%
Gender
Age
Nationality
Ethnicity
Language
Education
Socio-economic status
Sexual orientation
Religion
Disability
0
5
10 15 20 25
30 35 40 45
% of respondents
50
55
60 65
70
HISPANIC / LATINX - KIND OF DISCRIMINATION EXPERIENCED
% of respondents
50%
www.stateofeuropeantech.com
In Partnership with
&
36%
43%
21%
21%
7%
7%
7%
Gender
Age
Nationality
Ethnicity
Language
Education
Socio-economic status 0%
Sexual orientation
Religion
Disability 0%
0
5
10
15
20
25
30 35
40
45
50
55

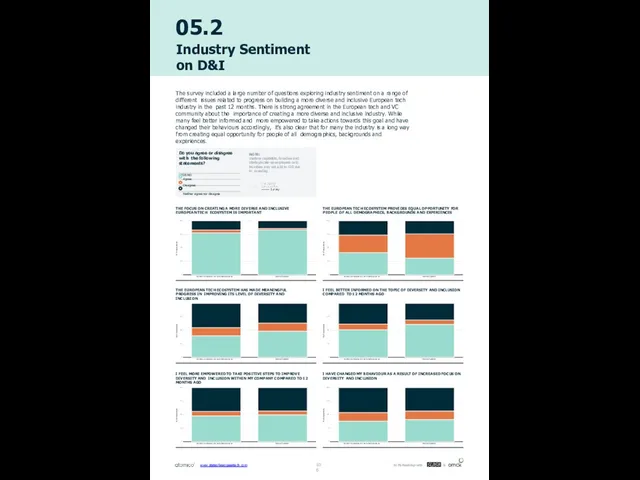
05.1 State of D&I in European Tech
05.2
Industry Sentiment on D&I
I FEEL BETTER
05.1 State of D&I in European Tech
05.2
Industry Sentiment on D&I
I FEEL BETTER
THE EUROPEAN TECH ECOSYSTEM HAS MADE MEANINGFUL PROGRESS IN IMPROVING ITS LEVEL OF DIVERSITY AND INCLUSION
THE EUROPEAN TECH ECOSYSTEM PROVIDES EQUAL OPPORTUNITY FOR PEOPLE OF ALL DEMOGRAPHICS, BACKGROUNDS AND EXPERIENCES
THE FOCUS ON CREATING A MORE DIVERSE AND INCLUSIVE EUROPEAN TECH ECOSYSTEM IS IMPORTANT
I HAVE CHANGED MY BEHAVIOUR AS A RESULT OF INCREASED FOCUS ON DIVERSITY AND INCLUSION
I FEEL MORE EMPOWERED TO TAKE POSITIVE STEPS TO IMPROVE DIVERSITY AND INCLUSION WITHIN MY COMPANY COMPARED TO 12 MONTHS AGO
The survey included a large number of questions exploring industry sentiment on a range of different issues related to progress on building a more diverse and inclusive European tech industry in the past 12 months. There is strong agreement in the European tech and VC community about the importance of creating a more diverse and inclusive industry. While many feel better informed and more empowered to take actions towards this goal and have changed their behaviours accordingly, it's also clear that for many the industry is a long way from creating equal opportunity for people of all demographics, backgrounds and experiences.
% of respondents
Founder or employee at a tech startup/scale-up
Venture Capitalist
0
25
50
75
100
% of respondents
Founder or employee at a tech startup/scale-up
Venture Capitalist
0
25
50
75
% of respondents
Founder or employee at a tech startup/scale-up
Venture Capitalist
0
25
50
75
100
% of respondents
Founder or employee at a tech startup/scale-up
Venture Capitalist
0
25
50
75
100
% of respondents
Founder or employee at a tech startup/scale-up
Venture Capitalist
0
25
50
75
% of respondents
Founder or employee at a tech startup/scale-up
Venture Capitalist
0
25
50
75
100
Do you agree or disagree with the following statements?
LEGEND
Agree Disagree
Neither agree nor disagree
NOTE:
Venture capitalists, founders and startup/scale-up employees only. Numbers may not add to 100 due to rounding.
106
www.stateofeuropeantech.com
In Partnership with
&

In Partnership with
&
www.stateofeuropeantech.com
In Partnership with
&
www.stateofeuropeantech.com
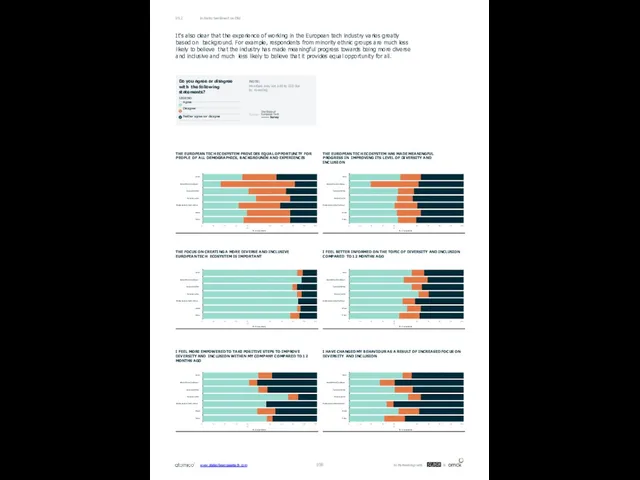
Asian
Black/African/Caribbean
Caucasian/White
Hispanic/Latinx
Middle Eastern/North African
Mixed
Other
0
10
20
30
40 50
% of respondents
60
70
80
90
100
Asian
Black/African/Caribbean
Caucasian/White
Hispanic/Latinx
Middle Eastern/North African
Mixed
Other
0
10
20
30
40 50
% of respondents
60
70
80
90
100
Asian
Black/African/Caribbean
Caucasian/White
Hispanic/Latinx
Middle Eastern/North African
Mixed
Other
0
10
20
30
40 50
%
Asian
Black/African/Caribbean
Caucasian/White
Hispanic/Latinx
Middle Eastern/North African
Mixed
Other
0
10
20
30
40 50
% of respondents
60
70
80
90
100
Asian
Black/African/Caribbean
Caucasian/White
Hispanic/Latinx
Middle Eastern/North African
Mixed
Other
0
10
20
30
40 50
% of respondents
60
70
80
90
100
Asian
Black/African/Caribbean
Caucasian/White
Hispanic/Latinx
Middle Eastern/North African
Mixed
Other
0
10
20
30
40 50
%
60
70
80
90
100
Asian
Black/African/Caribbean
Caucasian/White
Hispanic/Latinx
Middle Eastern/North African
Mixed
Other
0
10
20
30
40 50
% of respondents
60
70
80
90
100
Asian
Black/African/Caribbean
Caucasian/White
Hispanic/Latinx
Middle Eastern/North African
Mixed
Other
0
10
20
30
40 50
% of respondents
60
70
80
90
100
Asian
Black/African/Caribbean
Caucasian/White
Hispanic/Latinx
Middle Eastern/North African
Mixed
Other
0
10
20
30
40 50
% of respondents
60
70
80
90
100
I FEEL BETTER INFORMED ON THE TOPIC OF DIVERSITY AND INCLUSION COMPARED TO 12 MONTHS AGO
THE FOCUS ON CREATING A MORE DIVERSE AND INCLUSIVE EUROPEAN TECH ECOSYSTEM IS IMPORTANT
THE EUROPEAN TECH ECOSYSTEM HAS MADE MEANINGFUL PROGRESS IN IMPROVING ITS LEVEL OF DIVERSITY AND INCLUSION
THE EUROPEAN TECH ECOSYSTEM PROVIDES EQUAL OPPORTUNITY FOR PEOPLE OF ALL DEMOGRAPHICS, BACKGROUNDS AND EXPERIENCES
I HAVE CHANGED MY BEHAVIOUR AS A RESULT OF INCREASED FOCUS ON DIVERSITY AND INCLUSION
I FEEL MORE EMPOWERED TO TAKE POSITIVE STEPS TO IMPROVE DIVERSITY AND INCLUSION WITHIN MY COMPANY COMPARED TO 12 MONTHS AGO
It's also clear that the experience of working in the European tech industry varies greatly based on background. For example, respondents from minority ethnic groups are much less likely to believe that the industry has made meaningful progress towards being more diverse and inclusive and much less likely to believe that it provides equal opportunity for all.
Industry Sentiment on D&I
05.2
Do you agree or disagree with the following statements?
www.stateofeuropeantech.com
In Partnership with
&
LEGEND
Agree Disagree
Neither agree nor disagree
NOTE:
Numbers may not add to 100 due to rounding.
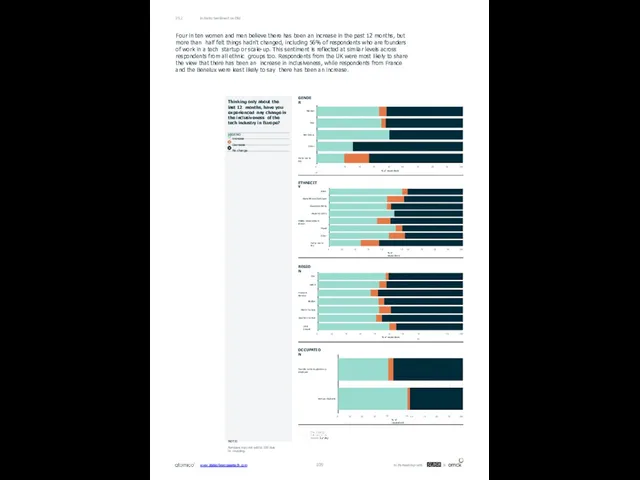
Founder or startup/scale-up employee
Venture Capitalist
0
10
20
30
40 50
% of respondents
60
70
80
90
100
Asian
Black/African/Caribbean
Caucasian/White
Hispanic/Latinx
Middle Eastern/North African
Mixed
Other
Prefer not to
Founder or startup/scale-up employee
Venture Capitalist
0
10
20
30
40 50
% of respondents
60
70
80
90
100
Asian
Black/African/Caribbean
Caucasian/White
Hispanic/Latinx
Middle Eastern/North African
Mixed
Other
Prefer not to
0
10
20
30
40 50
% of respondents
60
70
80
90
100
Women
Men
Non-binary
Other
Prefer not to say
0 10
20
30
40
50 60
% of respondents
70
80
90
100
Industry Sentiment on D&I
05.2
Four in ten women and men believe there has been an increase in the past 12 months, but more than half felt things hadn't changed, including 56% of respondents who are founders of work in a tech startup or scale-up. This sentiment is reflected at similar levels across respondents from all ethnic groups too. Respondents from the UK were most likely to share the view that there has been an increase in inclusiveness, while respondents from France and the Benelux were least likely to say there has been an increase.
ETHNICITY
REGION
CEE
DACH
France & Benelux
Nordics
Rest of Europe
Southern Europe
UK & Ireland
0
10
20
30
40
50 60
% of respondents
70 80
90
100
OCCUPATION
GENDER
Thinking only about the last 12 months, have you experienced any change in the inclusiveness of the tech industry in Europe?
LEGEND
Increase Decrease No change
NOTE:
Numbers may not add to 100 due to rounding.
www.stateofeuropeantech.com
In Partnership with
&
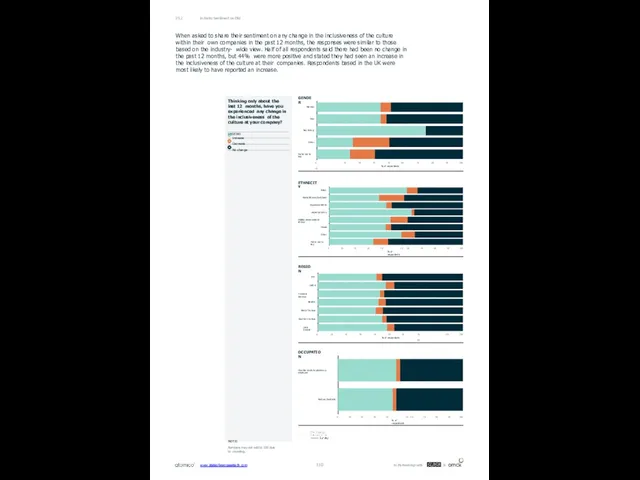
Industry Sentiment on D&I
05.2
When asked to share their sentiment on any
Industry Sentiment on D&I
05.2
When asked to share their sentiment on any
Founder or startup/scale-up employee
Venture Capitalist
0
10
20
30
40 50
% of respondents
60
70
80
90
100
Asian
Black/African/Caribbean
Caucasian/White
Hispanic/Latinx
Middle Eastern/North African
Mixed
Other
Prefer not to say
0
10
20
30
40 50
% of respondents
60
70
80
90
100
Women
Men
Non-binary
Other
Prefer not to say
0 10
20
30
40
50 60
% of respondents
70
80
90
100
ETHNICITY
REGION
CEE
DACH
France & Benelux
Nordics
Rest of Europe
Southern Europe
UK & Ireland
0
10
20
30
40
50 60
% of respondents
70 80
90
100
OCCUPATION
GENDER
Thinking only about the last 12 months, have you experienced any change in the inclusiveness of the culture at your company?
LEGEND
Increase Decrease No change
NOTE:
Numbers may not add to 100 due to rounding.
www.stateofeuropeantech.com
In Partnership with
&
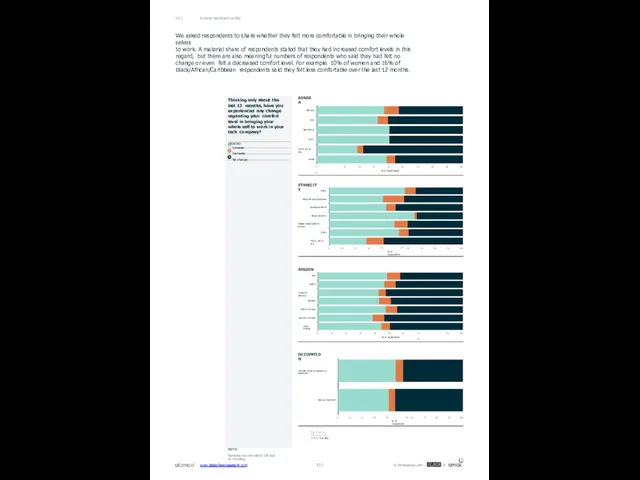
Industry Sentiment on D&I
05.2
We asked respondents to share whether they felt
Industry Sentiment on D&I
05.2
We asked respondents to share whether they felt
to work. A material share of respondents stated that they had increased comfort levels in this regard, but there are also meaningful numbers of respondents who said they had felt no change or even felt a decreased comfort level. For example. 10% of women and 16% of Black/African/Caribbean respondents said they felt less comfortable over the last 12 months.
Founder or startup/scale-up employee
Venture Capitalist
0
10
20
30
40 50
% of respondents
60
70
80
90
100
Asian
Black/African/Caribbean
Caucasian/White
Hispanic/Latinx
Middle Eastern/North African
Other
Prefer not to say
0
10
20
30
40 50
% of respondents
60
70
80
90
100
Women
Men
Non-binary
Other
Prefer not to say
Mixed
0 10
20
30
40
50 60
% of respondents
70
80
90
100
ETHNICITY
REGION
CEE
DACH
France & Benelux
Nordics
Rest of Europe
Southern Europe
UK & Ireland
0
10
20
30
40
50 60
% of respondents
70 80
90
100
OCCUPATION
GENDER
Thinking only about the last 12 months, have you experienced any change regarding your comfort level in bringing your whole self to work in your tech company?
LEGEND
Increase Decrease No change
NOTE:
Numbers may not add to 100 due to rounding.
www.stateofeuropeantech.com
In Partnership with
&
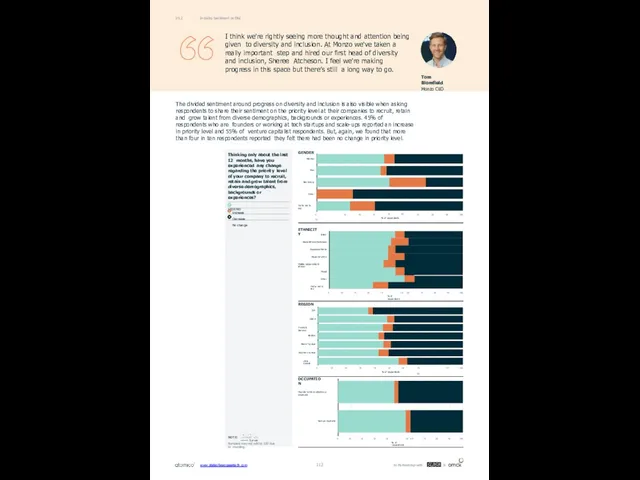
Industry Sentiment on D&I
05.2
I think we're rightly seeing more thought and
Industry Sentiment on D&I
05.2
I think we're rightly seeing more thought and
Tom Blomfield
Monzo CEO
The divided sentiment around progress on diversity and inclusion is also visible when asking respondents to share their sentiment on the priority level at their companies to recruit, retain and grow talent from diverse demographics, backgrounds or experiences. 45% of respondents who are founders or working at tech startups and scale-ups reported an increase in priority level and 55% of venture capitalist respondents. But, again, we found that more than four in ten respondents reported they felt there had been no change in priority level.
Founder or startup/scale-up employee
Venture Capitalist
0
10
20
30
40 50
% of respondents
60
70
80
90
100
Asian
Black/African/Caribbean
Caucasian/White
Hispanic/Latinx
Middle Eastern/North African
Mixed
Other
Prefer not to say
0
10
20
30
40 50
% of respondents
60
70
80
90
100
Men
Non-binary
Other
Prefer not to say
0 10
20
30
40
50 60
% of respondents
70
80
90
100
ETHNICITY
REGION
CEE
DACH
France & Benelux
Nordics
Rest of Europe
Southern Europe
UK & Ireland
0
10
20
30
40
50 60
% of respondents
70 80
90
100
OCCUPATION
GENDER
Women
Thinking only about the last 12 months, have you experienced any change regarding the priority level of your company to recruit, retain and grow talent from diverse demographics, backgrounds or experiences?
LEGEND
Increase Decrease No change
NOTE:
Numbers may not add to 100 due to rounding.
www.stateofeuropeantech.com
In Partnership with
&
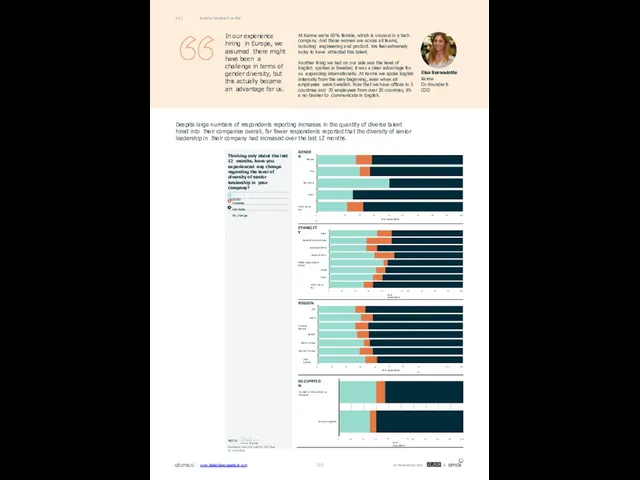
Industry Sentiment on D&I
05.2
In our experience hiring in Europe, we assumed
Industry Sentiment on D&I
05.2
In our experience hiring in Europe, we assumed
At Karma we're 60% female, which is unusual in a tech company. And those women are across all teams, including engineering and product. We feel extremely lucky to have attracted this talent.
Another thing we had on our side was the level of English spoken in Sweden; it was a clear advantage for us expanding internationally. At Karma we spoke English internally from the very beginning, even when all employees were Swedish. Now that we have offices in 3 countries and 70 employees from over 20 countries, it's a no-brainer to communicate in English.
Elsa Bernadotte
Karma
Co-Founder & COO
Despite large numbers of respondents reporting increases in the quantity of diverse talent hired into their companies overall, far fewer respondents reported that the diversity of senior leadership in their company had increased over the last 12 months.
Founder or startup/scale-up employee
Venture Capitalist
0
10
20
30
40 50
% of respondents
60
70
80
90
100
Asian
Black/African/Caribbean
Caucasian/White
Hispanic/Latinx
Middle Eastern/North African
Mixed
Other
Prefer not to say
0
10
20
30
40 50
% of respondents
60
70
80
90
100
Women
Men
Non-binary
Other
Prefer not to say
0 10
20
30
40
50 60
% of respondents
70
80
90
100
ETHNICITY
DACH
France & Benelux
Nordics
Rest of Europe
Southern Europe
UK & Ireland
0
10
20
30
40
50 60
% of respondents
70 80
90
100
GENDER
Thinking only about the last 12 months, have you experienced any change regarding the level of diversity of senior leadership in your company?
LEGEND
Increase Decrease No change
NOTE:
Numbers may not add to 100 due to rounding.
www.stateofeuropeantech.com
In Partnership with
&
REGION
CEE
OCCUPATION
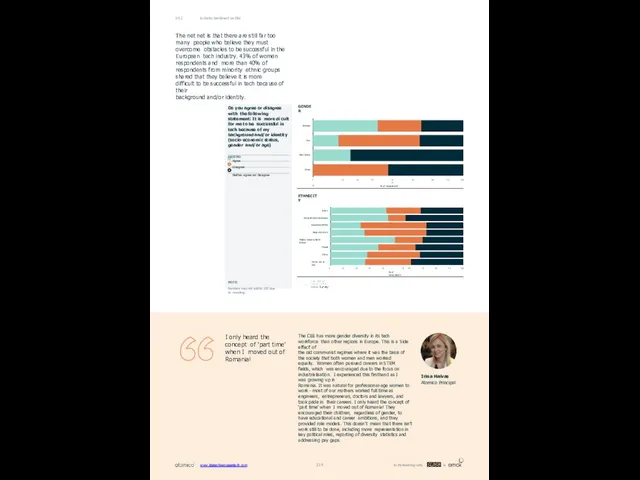
Asian
Black/African/Caribbean
Caucasian/White
Hispanic/Latinx
Middle Eastern/North African
Mixed
Other
Prefer not to say
0
10
20
30
40 50
% of respondents
60
70
80
90
100
Women
Men
Non-binary
Other
0 10
20
30
40 50 60 70
% of respondents
80
90
100
ETHNICITY
The net
Asian
Black/African/Caribbean
Caucasian/White
Hispanic/Latinx
Middle Eastern/North African
Mixed
Other
Prefer not to say
0
10
20
30
40 50
% of respondents
60
70
80
90
100
Women
Men
Non-binary
Other
0 10
20
30
40 50 60 70
% of respondents
80
90
100
ETHNICITY
The net
difficult to be successful in tech because of their
background and/or identity.
Irina Haivas
Atomico Principal
I only heard the concept of 'part time' when I moved out of Romania!
The CEE has more gender diversity in its tech workforce than other regions in Europe. This is a 'side effect' of
the old communist regimes where it was the basis of the society that both women and men worked equally. Women often pursued careers in STEM fields, which was encouraged due to the focus on industrialisation. I experienced this firsthand as I was growing up in
Romania. It was natural for professional-age women to work - most of our mothers worked full time as engineers, entrepreneurs, doctors and lawyers, and took pride in their careers. I only heard the concept of 'part time' when I moved out of Romania! They encouraged their children, regardless of gender, to have educational and career ambitions, and they provided role models. This doesn't mean that there isn't work still to be done, including more representation in key political roles, reporting of diversity statistics and addressing pay gaps.
GENDER
Do you agree or disagree with the following statement: It is more di cult for me to be successful in tech because of my background and/or identity (socio-economic status, gender and/or age)
LEGEND
Agree Disagree
Neither agree nor disagree
NOTE:
Numbers may not add to 100 due to rounding.
Industry Sentiment on D&I
www.stateofeuropeantech.com
In Partnership with
&
05.2
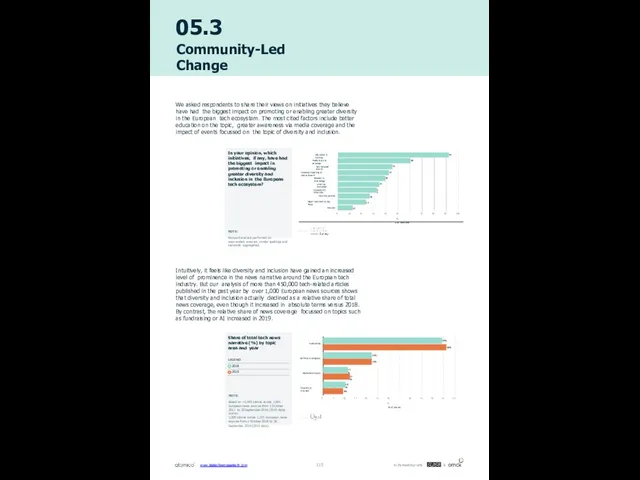
05.3
Community-Led Change
We asked respondents to share their views on initiatives they
05.3
Community-Led Change
We asked respondents to share their views on initiatives they
Intuitively, it feels like diversity and inclusion have gained an increased level of prominence in the news narrative around the European tech industry. But our analysis of more than 450,000 tech-related articles published in the past year by over 1,000 European news sources shows that diversity and inclusion actually declined as a relative share of total news coverage, even though it increased in absolute terms versus 2018. By contrast, the relative share of news coverage focussed on topics such as fundraising or AI increased in 2019.
92
Education & training
Media focus & coverage
D&I-focused events
Diversity reporting & measurement
Women in technology
#MeToo campaign
Diversity VC initiatives
Diversity policies
Equal treatment & pay focus
Inklusiiv
0
10
20
30
40
50 60
# of mentions
70
80
90
100
Share of total tech news narrative (%) by topic area and year
LEGEND
2018
2019
NOTE:
Based on ~5,460 stories across 1,094 European news sources from 1 October 2017 to 30 September 2018 (2018 data) and on
5,300 stories across 1,105 European news
sources from 1 October 2018 to 30
September 2019 (2019 data).
54%
22%
11%
10%
56%
22%
12%
9%
Fundraising
Artificial Intelligence
Blockchain/crypto
Diversity & inclusion
0
5
10
15
20
25
30 35
% of stories
40
45
50
55
60
In your opinion, which initiatives, if any, have had the biggest impact in promoting or enabling greater diversity and inclusion in the European tech ecosystem?
NOTE:
Keyword analysis performed on open-ended answers, similar spellings and keywords aggregated.
www.stateofeuropeantech.com
In Partnership with
&

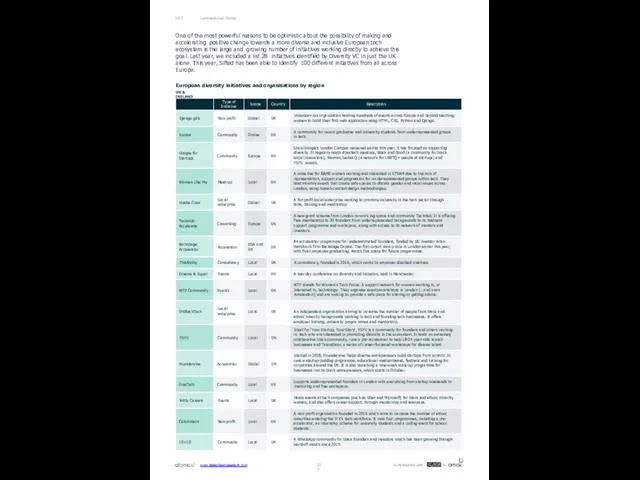
Community-Led Change
www.stateofeuropeantech.com
In Partnership with
&
05.3
UK & IRELAND
One of the most powerful reasons
Community-Led Change
www.stateofeuropeantech.com
In Partnership with
&
05.3
UK & IRELAND
One of the most powerful reasons
European diversity initiatives and organisations by region
n
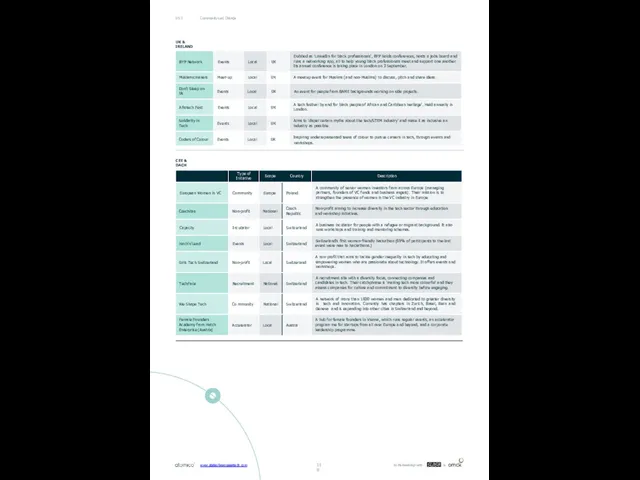
CEE & DACH
Community-Led Change
05.3
UK & IRELAND
www.stateofeuropeantech.com
In Partnership with
&
CEE & DACH
Community-Led Change
05.3
UK & IRELAND
www.stateofeuropeantech.com
In Partnership with
&
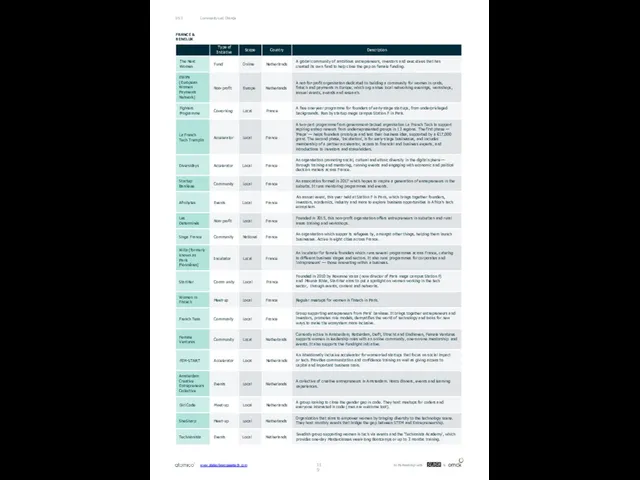
FRANCE & BENELUX
www.stateofeuropeantech.com
In Partnership with
&
Community-Led Change
05.3
FRANCE & BENELUX
www.stateofeuropeantech.com
In Partnership with
&
Community-Led Change
05.3
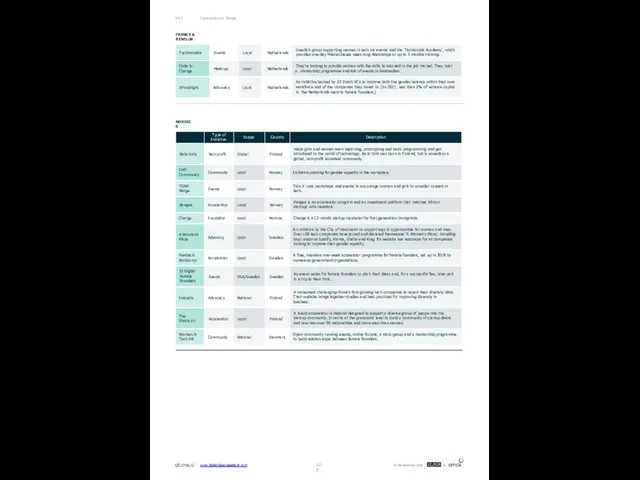
FRANCE & BENELUX
NORDICS
Community-Led Change
05.3
120
www.stateofeuropeantech.com
In Partnership with
&
FRANCE & BENELUX
NORDICS
Community-Led Change
05.3
120
www.stateofeuropeantech.com
In Partnership with
&
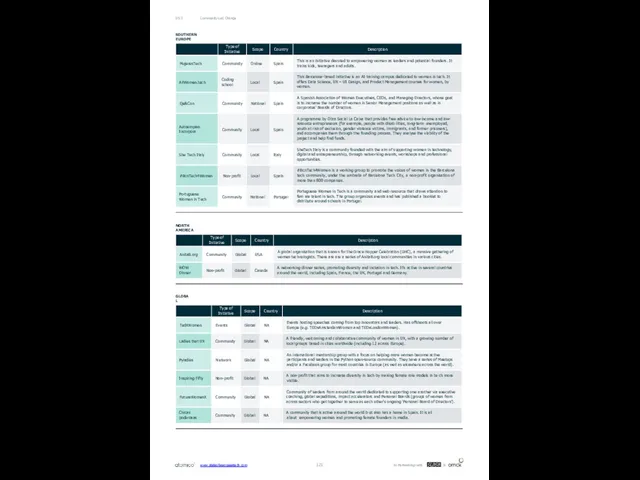
SOUTHERN EUROPE
NORTH AMERICA
GLOBAL
Community-Led Change
www.stateofeuropeantech.com
In Partnership with
&
05.3
SOUTHERN EUROPE
NORTH AMERICA
GLOBAL
Community-Led Change
www.stateofeuropeantech.com
In Partnership with
&
05.3
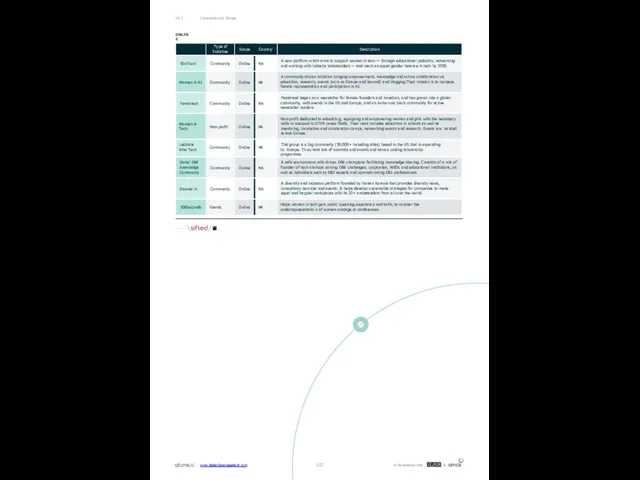
ONLINE
Community-Led Change
05.3
www.stateofeuropeantech.com
In Partnership with
&
ONLINE
Community-Led Change
05.3
www.stateofeuropeantech.com
In Partnership with
&
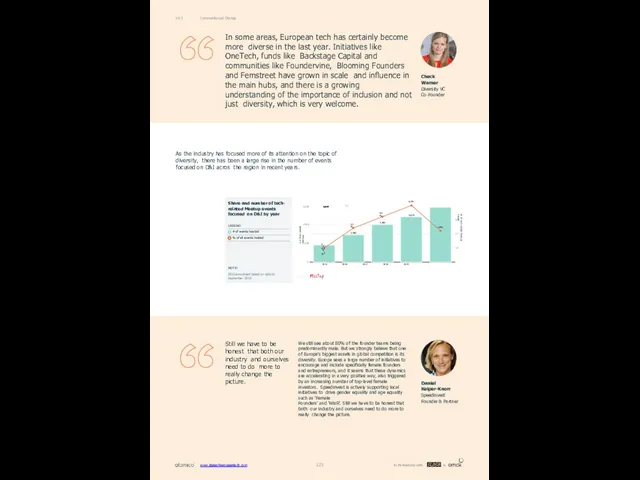
In some areas, European tech has certainly become more diverse in
In some areas, European tech has certainly become more diverse in
Check Warner Diversity VC Co-Founder
Community-Led Change
05.3
As the industry has focused more of its attention on the topic of diversity, there has been a large rise in the number of events focused on D&I acros the region in recent years.
Still we have to be honest that both our industry and ourselves need to do more to really change the picture.
We still see about 80% of the founder teams being predominantly male. But we strongly believe that one of Europe's biggest assets in global competition is its diversity. Europe sees a large number of initiatives to encourage and include specifically female founders and entrepreneurs, and it seems that these dynamics are accelerating in a very positive way, also triggered by an increasing number of top-level female investors. Speedinvest is actively supporting local initiatives to drive gender equality and age equality such as 'Female
Founders' and 'WisR'. Still we have to be honest that both our industry and ourselves need to do more to really change the picture.
Daniel Keiper-Knorr Speedinvest Founder & Partner
# of tech-related Meetups
% of tech-related Meetups hosted
2,903
4,002
4,843
15,.801%5
5.7%
6.1%
5.6%
2015 2016 2017 2018 2019
2,000
4,000
0 4.5
5.0
5.5
6.0
6.5%
6,000 5,839 6.5
Share and number of tech- related Meetup events focused on D&I by year
LEGEND
# of events hosted
% of all events hosted
NOTE:
2019 annualised based on data to September 2019.
www.stateofeuropeantech.com
In Partnership with
&
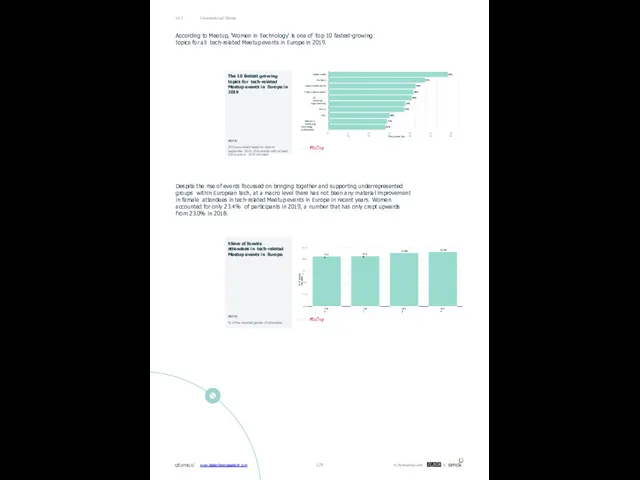
Community-Led Change
05.3
According to Meetup, 'Women in Technology' is one of Top
Community-Led Change
05.3
According to Meetup, 'Women in Technology' is one of Top
Despite the rise of events focussed on bringing together and supporting underrepresented groups within European tech, at a macro level there has not been any material improvement in female attendees in tech-related Meetup events in Europe in recent years. Women accounted for only 23.4% of participants in 2019, a number that has only crept upwards from 23.0% in 2018.
55%
44%
40%
39%
38%
35%
35%
28%
27%
Digital media
Founders
Agile transformation
Product development
3D animation
Agile coaching
Scrum
SEO
Women in technology
Technology professionals
26%
0 5 10 15 20 25 30 35 40 45 50 55 60
YoY growth (%)
The 10 fastest growing topics for tech-related Meetup events in Europe in 2019
NOTE:
2019 annualised based on data to September 2019. Only events with at least 250 events in 2018 included.
% of female attendees
21.5%
21.6%
23.0%
23.4%
2016
2017
2018
2019
0.0
5.0
10.0
15.0
20.0
25.0
Share of female attendees in tech-related Meetup events in Europe
NOTE:
% of the reported gender of attendees.
www.stateofeuropeantech.com
In Partnership with
&
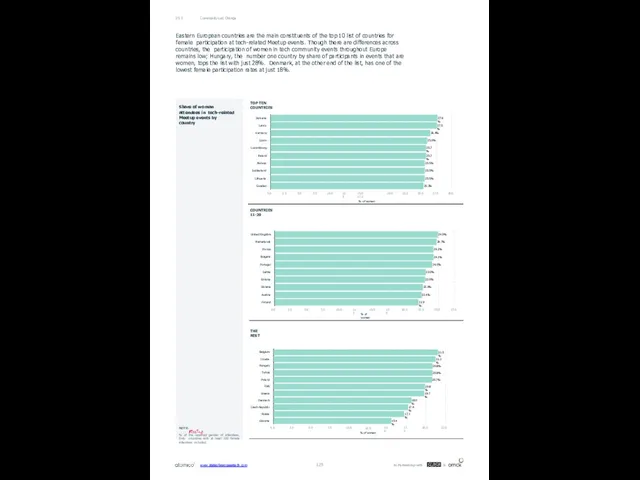
27.6%
27.5%
26.4%
25.9%
25.7%
25.7%
25.5%
25.5%
25.5%
25.3%
Romania
Latvia
Germany
Spain
Luxembourg
Ireland
Norway
Switzerland
Lithuania
Sweden
0.0
2.5
5.0
7.5
10.0
12.5
15.0 17.5
% of women
20.0
22.5
25.0
27.5
30.0
24.9%
24.7%
24.2%
24.2%
24.0%
23.0%
22.9%
22.6%
22.4%
21.9%
United Kingdom
Netherlands
France
Bulgaria
Portugal
Serbia
Estonia
Ukraine
Austria
Finland
0.0
2.5
5.0
7.5
10.0
12.5
15.0
% of women
17.5
20.0
22.5
25.0
27.5
Community-Led Change
05.3
COUNTRIES 11-20
THE REST
TOP TEN COUNTRIES
Eastern
Share of woman attendees in tech-related Meetup events by country
NOTE:
% of the reported gender of attendees. Only countries with at least 100 female attendees included.
21.5%
21.2%
20.8%
20.8%
20.7%
19.8%
19.7%
18.0%
17.6%
17.1%
15.4%
Belgium
Croatia
Hungary
Turkey
Poland
Italy
Greece
Denmark
Czech Republic
Russia
Slovenia
0.0
10.0
20.0
2.5
5.0
7.5
12.5
% of women
15.0
17.5
22.5
www.stateofeuropeantech.com
In Partnership with
&
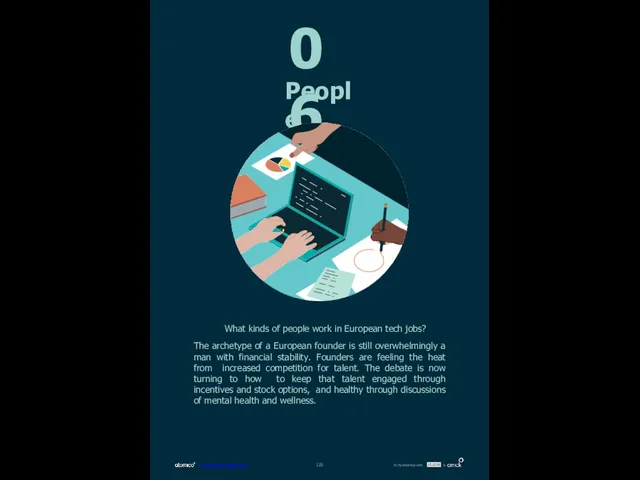
06
People
What kinds of people work in European tech jobs?
The archetype of
06
People
What kinds of people work in European tech jobs?
The archetype of
www.stateofeuropeantech.com
In Partnership with
&
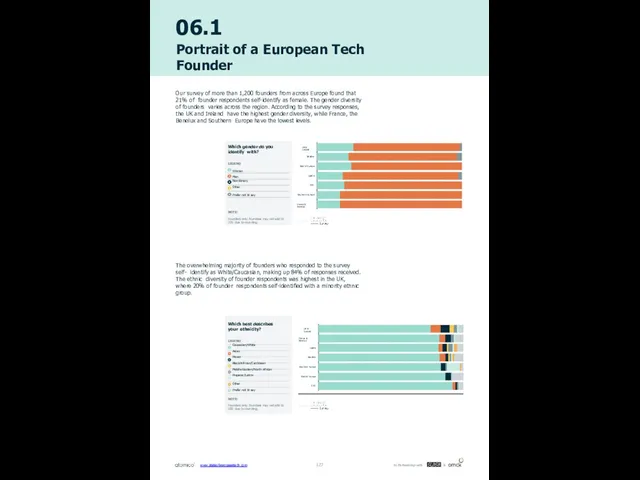
06.1
Portrait of a European Tech Founder
Our survey of more than 1,200
06.1
Portrait of a European Tech Founder
Our survey of more than 1,200
The overwhelming majority of founders who responded to the survey self- identify as White/Caucasian, making up 84% of responses received. The ethnic diversity of founder respondents was highest in the UK, where 20% of founder respondents self-identified with a minority ethnic group.
UK & Ireland
Nordics
Rest of Europe
DACH
CEE
Southern Europe
France & Benelux
UK & Ireland
France & Benelux
DACH
Nordics
Southern Europe
Rest of Europe
CEE
Which gender do you identify with?
LEGEND
Women
Men
Non-Binary Other
Prefer not to say
NOTE:
Founders only. Numbers may not add to 100 due to rounding.
Which best describes your ethnicity?
LEGEND
Caucasian/White Asian
Mixed Black/African/Caribbean Middle Eastern/North African Hispanic/Latinx
Other
Prefer not to say
NOTE:
Founders only. Numbers may not add to 100 due to rounding.
www.stateofeuropeantech.com
In Partnership with
&
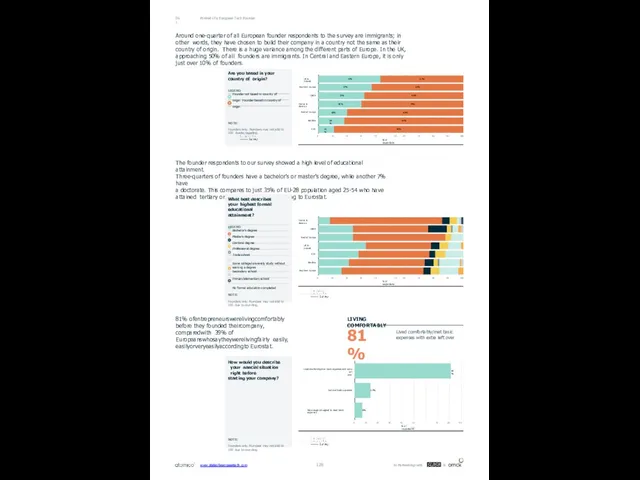
Portrait of a European Tech Founder
06.1
Around one-quarter of all European founder
Portrait of a European Tech Founder
06.1
Around one-quarter of all European founder
The founder respondents to our survey showed a high level of educational attainment.
Three-quarters of founders have a bachelor's or master's degree, while another 7% have
a doctorate. This compares to just 35% of EU-28 population aged 25-54 who have attained tertiary or higher education, according to Eurostat.
France & Benelux
DACH
Rest of Europe
UK & Ireland
CEE
Nordics
Southern Europe
0
10
20
30
40 50
% of respondents
60
70
80
90
100
What best describes your highest formal educational attainment?
LEGEND
Bachelor's degree Master's degree Doctoral degree Professional degree Trade school
Some college/university study without earning a degree
Secondary school Primary/elementary school
No formal education completed
NOTE:
Founders only. Numbers may not add to 100 due to rounding.
43%
37%
32%
30%
20%
18%
11%
57%
63%
68%
70%
80%
82%
89%
UK & Ireland
Southern Europe
DACH
France & Benelux
Rest of Europe
Nordics
CEE
0
10
20
30
40 50
% of respondents
60
70
80
90
100
Are you based in your country of origin?
LEGEND
Founder not based in country of origin Founder based in country of origin
NOTE:
Founders only. Numbers may not add to 100 due to rounding.
81% ofentrepreneurswerelivingcomfortably before they founded theircompany, comparedwith 39% of Europeanswhosaytheywerelivingfairly easily, easilyorveryeasilyaccordingto Eurostat.
Lived comfortably/met basic expenses with extra left over
LIVING COMFORTABLY
81%
% of respondents
81%
www.stateofeuropeantech.com
In Partnership with
&
13%
6%
Lived comfortably/met basic expenses with extra left
over
Just met basic expenses
Not enough/struggled to meet basic expenses
0
10
20
30
40
50 60
70
80
90
How would you describe your nancial situation right before
starting your company?
NOTE:
Founders only. Numbers may not add to 100 due to rounding.
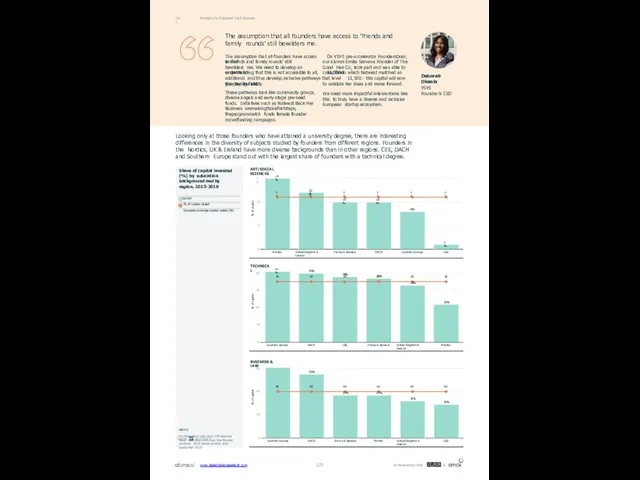
Looking only at those founders who have attained a university degree,
Looking only at those founders who have attained a university degree,
% of capital
15%
12%
10%
10%
8%
1%
11
11
11
11
11
11
Nordics
United Kingdom & Ireland
France & Benelux
DACH
Southern Europe
CEE
0
5
10
15
Portrait of a European Tech Founder
06.1
% of capital
41%
40%
38%
37%
33%
22%
35
35
35
35
35
35
Southern Europe
DACH
CEE
France & Benelux
United Kingdom & Ireland
Nordics
0
10
20
30
40
TECHNICAL
% of capital
55%
32%
29%
40
40
40
37%
40
37%
40
40
Southern Europe
DACH
France & Benelux
Nordics
United Kingdom & Ireland
CEE
0
20
40
60
BUSINESS & LAW
Share of capital invested (%) by education background and by region, 2015-2019
LEGEND
% of capital raised
European average capital raised (%)
NOTE:
Numbers don't add up to 100 because deals can have more than one founder involved. 2019 based on data up to September 2019.
ART/SOCIAL SCIENCES
to 'friends and family rounds' still bewilders me. We need to develop an empathetic
the playing field.
These pathways look like community groups, diverse angels and early-stage pre-seed funds. Initiatives such as Natwest Back Her Business aremakingthosefirststeps, theprogrammatch funds female founder crowdfunding campaigns.
Deborah Okenla
YSYS
Founder & CEO
The assumption that all founders have access to 'friends and family rounds' still bewilders me.
The assumption that all founders have access On YSYS pre-accelerator FoundersDoor, one of
www.stateofeuropeantech.com
In Partnership with
&
our alumni Emilia Servane Founder of The Good Hair Co, took part and was able to crowdfund
understanding that this is not accessible to all, £1,500 to which Natwest matched an additional and thus develop inclusive pathways that level £1,500 - this capital will now give her the ability
to validate her ideas and move forward.
We need more impactful interventions like this to truly have a diverse and inclusive European startup ecosystem.
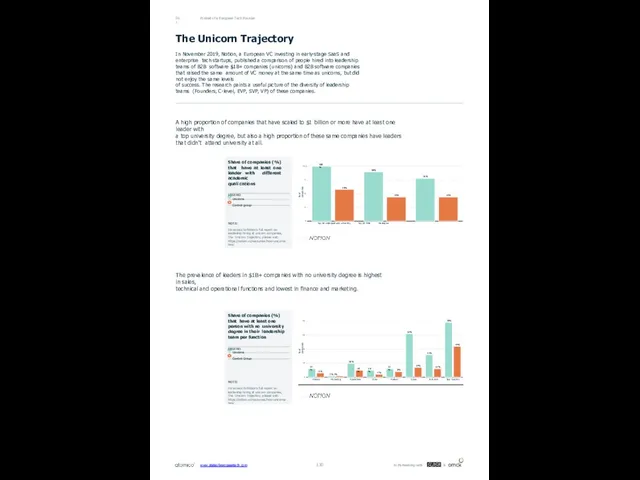
Portrait of a European Tech Founder
06.1
The Unicorn Trajectory
In November 2019, Notion,
Portrait of a European Tech Founder
06.1
The Unicorn Trajectory
In November 2019, Notion,
of success. The research paints a useful picture of the diversity of leadership teams (Founders, C-level, EVP, SVP, VP) of these companies.
A high proportion of companies that have scaled to $1 billion or more have at least one leader with
a top university degree, but also a high proportion of these same companies have leaders that didn't attend university at all.
The prevalence of leaders in $1B+ companies with no university degree is highest in sales,
technical and operational functions and lowest in finance and marketing.
% of companies
100%
90%
78%
58%
44%
44%
Top 50 undergraduate university Top 10 MBA No degree
0
25
50
75
100
% of companies
12%
20%
10%
12%
62%
32%
78%
6%
2% 2%
10%
4%
8%
14%
12%
44%
Finance
Marketing
Operations
Other
Product
Sales
Technical
Any function
0
20
40
60
80
Share of companies (%) that have at least one leader with different academic
quali cations
LEGEND
Unicorns Control group
NOTE:
For access to Notion's full report on leadership hiring at unicorn companies, The Unicorn Trajectory, please visit: https://notion.vc/resources/how-unicorns- hire/
Share of companies (%) that have at least one person with no university degree in their leadership team per function
LEGEND
Unicorns Control Group
NOTE:
For access to Notion's full report on leadership hiring at unicorn companies, The Unicorn Trajectory, please visit: https://notion.vc/resources/how-unicorns- hire/
www.stateofeuropeantech.com
In Partnership with
&
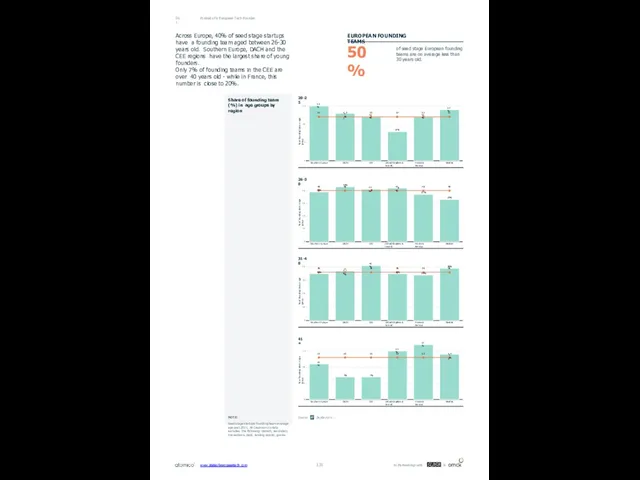
Portrait of a European Tech Founder
06.1
Across Europe, 40% of seed stage
Portrait of a European Tech Founder
06.1
Across Europe, 40% of seed stage
Only 7% of founding teams in the CEE are over 40 years old - while in France, this number is close to 20%.
of seed stage European founding teams are on average less than 30 years old.
EUROPEAN FOUNDING TEAMS
50%
% of founding team in age group
39%
43%
37%
33%
40
40
41%0
420%
40
40
Southern Europe
DACH
CEE
United Kingdom & Ireland
France & Benelux
Nordics
0
10
20
30
40
26-30
% of founding team in age group
41%
39%
36
35%
3376%
36
36
35%
36
34%
36
Southern Europe
DACH
CEE
United Kingdom & Ireland
France & Benelux
Nordics
0
10
20
30
40
31-40
% of founding team in age group
11%
7%
7%
15%
17%
13
13
13
13
13
1143%
Southern Europe
DACH
CEE
United Kingdom & Ireland
France & Benelux
Nordics
0
5
10
15
41+
Share of founding team (%) in age groups by region
NOTE:
Seed stage startups founding team average age post 2015. All Dealroom.co data excludes the following: biotech, secondary transactions, debt, lending capital, grants.
20-25
% of founding team in age group
15%
12%
8%
12%
14%
12
1132%
12
12
12
12
Southern Europe
DACH
CEE
United Kingdom & Ireland
France & Benelux
Nordics
0
5
10
15
www.stateofeuropeantech.com
In Partnership with
&
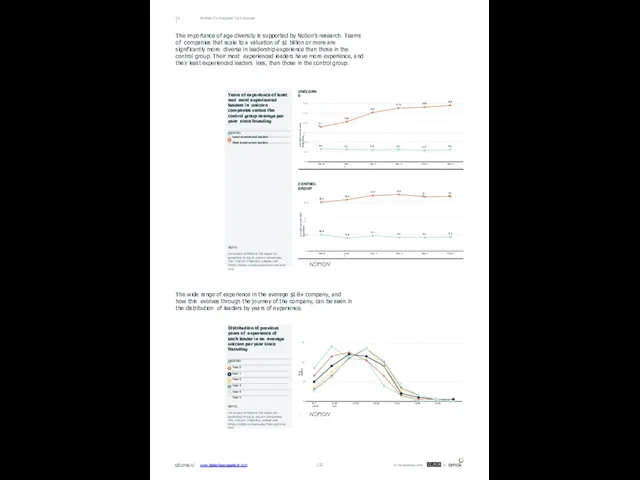
Portrait of a European Tech Founder
06.1
# of years of prior work
Portrait of a European Tech Founder
06.1
# of years of prior work
6.5
6.2
6.0
6.2
5.8
6.2
17.9
20.6
25.3
27.6
28.0
29.0
Year 0
Year 1
Year 2
Year 3
Year 4
Year 5
0.0
5.0
10.0
15.0
20.0
25.0
30.0
UNICORNS
Years of experience of least and most experienced leaders in unicorn companies versus the control group average per year since founding
LEGEND
Least experienced leaders Most experienced leaders
NOTE:
For access to Notion's full report on leadership hiring at unicorn companies, The Unicorn Trajectory, please visit: https://notion.vc/resources/how-unicorns- hire/
# of years of prior work experience
10.0
9.0
9.7
9.2
9.2
9.3
20.1
20.9
22.2
22.5
21.8
21.9
Year 0
Year 1
Year 2
Year 3
Year 4
Year 5
5.0
10.0
15.0
20.0
The importance of age diversity is supported by Notion's research. Teams of companies that scale to a valuation of $1 billion or more are significantly more diverse in leadership experience than those in the control group. Their most experienced leaders have more experience, and their least experienced leaders less, than those in the control group.
The wide range of experience in the average $1B+ company, and how this evolves through the journey of the company, can be seen in the distribution of leaders by years of experience.
% of leaders
0-5 6-10 11-15 16-20 21-25 26-30 31-35 36-40 40+
0
10
20
30
Distribution of previous years of experience of each leader in an average unicorn per year since founding
LEGEND
Year 0
Year 1
Year 2
Year 3
Year 4
Year 5
NOTE:
For access to Notion's full report on leadership hiring at unicorn companies, The Unicorn Trajectory, please visit: https://notion.vc/resources/how-unicorns- hire/
CONTROL GROUP
www.stateofeuropeantech.com
In Partnership with
&
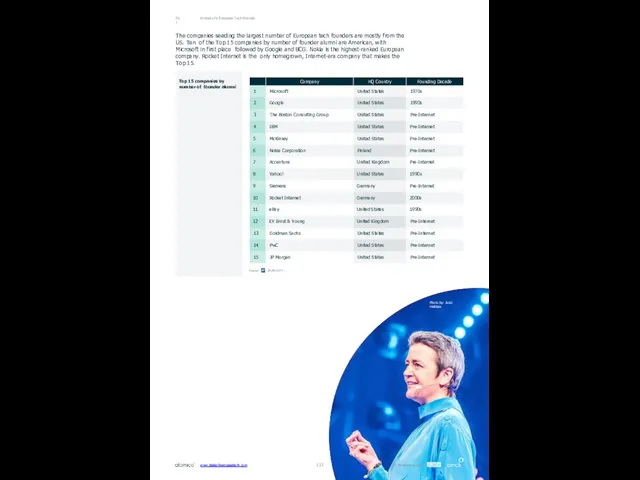
Portrait of a European Tech Founder
06.1
The companies seeding the largest number
Portrait of a European Tech Founder
06.1
The companies seeding the largest number
Top 15 companies by number of founder alumni
Photo by: Jussi Hellsten
www.stateofeuropeantech.com
In Partnership with
&
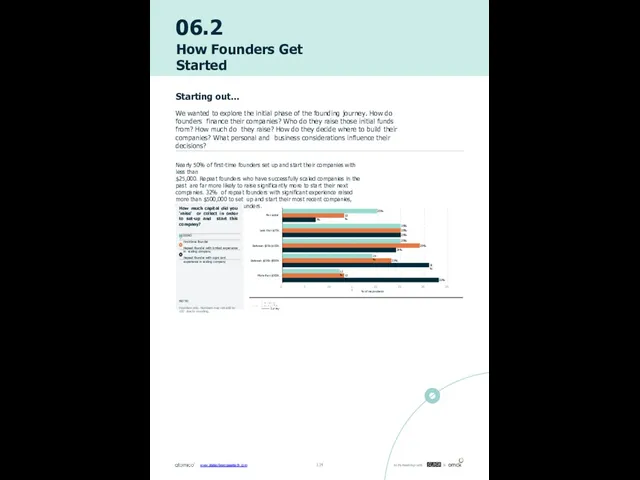
06.2
How Founders Get Started
Starting out...
We wanted to explore the initial phase
06.2
How Founders Get Started
Starting out...
We wanted to explore the initial phase
Nearly 50% of first-time founders set up and start their companies with less than
$25,000. Repeat founders who have successfully scaled companies in the past are far more likely to raise significantly more to start their next companies. 32% of repeat founders with significant experience raised more than $500,000 to set up and start their most recent companies, versus 12% of first-time founders.
20%
19%
12%
13%
29%
23%
13%
7%
25%
25%
25%
25%
24%
31%
33%
No capital
Less than $25k
Between $25k-$100k
Between $100k-$500k
More than $500k
0
5
10
15
20
% of respondents
25
30
35
How much capital did you 'raise' or collect in order to set-up and start this company?
LEGEND
First-time founder
Repeat founder with limited experience in scaling company
Repeat founder with signi cant experience in scaling company
NOTE:
Founders only. Numbers may not add to 100 due to rounding.
www.stateofeuropeantech.com
In Partnership with
&
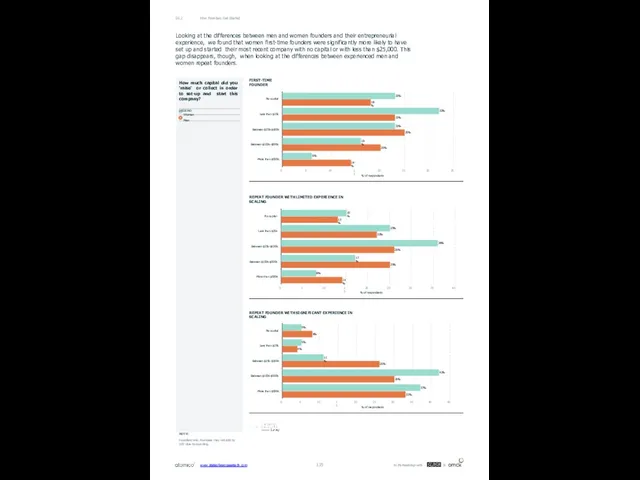
How Founders Get Started
06.2
15%
25%
36%
17%
8%
13%
22%
26%
25%
14%
No capital
Less than $25k
Between $25k-$100k
Between $100k-$500k
More than $500k
0
5
10
15
20
%
How Founders Get Started
06.2
15%
25%
36%
17%
8%
13%
22%
26%
25%
14%
No capital
Less than $25k
Between $25k-$100k
Between $100k-$500k
More than $500k
0
5
10
15
20
%
25
30
35
40
5%
5%
11%
42%
37%
8%
4%
26%
30%
33%
No capital
Less than $25k
Between $25k-$100k
Between $100k-$500k
More than $500k
0
5
10
15
20
25
% of respondents
30
35
40
45
23%
32%
23%
16%
6%
18%
23%
25%
20%
14%
No capital
Less than $25k
Between $25k-$100k
Between $100k-$500k
More than $500k
0
5
10
15
20
% of respondents
25
30
35
REPEAT FOUNDER WITH LIMITED EXPERIENCE IN SCALING
REPEAT FOUNDER WITH SIGNIFICANT EXPERIENCE IN SCALING
FIRST-TIME FOUNDER
How much capital did you 'raise' or collect in order to set-up and start this company?
LEGEND
Women Men
NOTE:
Founders only. Numbers may not add to 100 due to rounding.
Looking at the differences between men and women founders and their entrepreneurial experience, we found that women first-time founders were significantly more likely to have set up and started their most recent company with no capital or with less than $25,000. This gap disappears, though, when looking at the differences between experienced men and women repeat founders.
www.stateofeuropeantech.com
In Partnership with
&
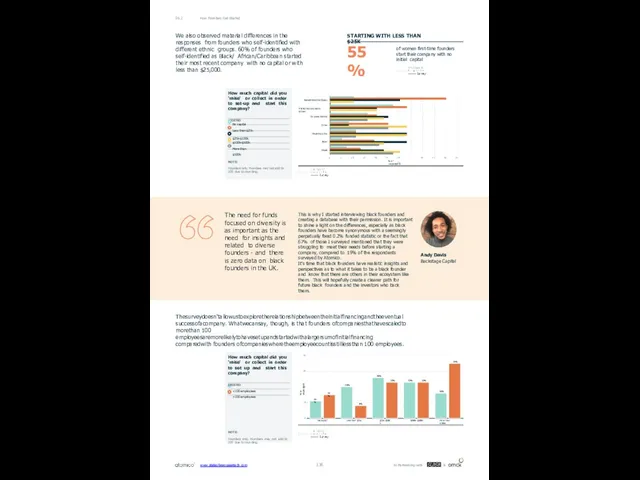
How Founders Get Started
06.2
We also observed material differences in the responses
How Founders Get Started
06.2
We also observed material differences in the responses
Thesurveydoesn'tallowustoexploretherelationshipbetweentheinitialfinancingandtheeventual successofacompany. Whatwecansay, though, is that founders ofcompaniesthathavescaledto morethan 100 employeesaremorelikelytohavesetupandstartedwithalargersumofinitialfinancing comparedwith founders ofcompanieswheretheemployeecountisstilllessthan 100 employees.
How much capital did you 'raise' or collect in order to set-up and start this company?
LEGEND
No capital Less than $25k
$25k-$100k
$100k-$500k More than $500k
% of respondents
Black/African/Caribbean
Middle Eastern/North African
Caucasian/White
Other
Hispanic/Latinx
Asian
Mixed
0
5
10
15
20
25
30 35
40
45
50
55
% of respondents
11%
20%
26%
23%
16%
15%
8%
23%
23%
35%
No capital
Less than $25k
$25k-$100k
$100k-$500k
More than $500k
0
10
20
30
40
NOTE:
Founders only. Numbers may not add to 100 due to rounding.
How much capital did you 'raise' or collect in order to set up and start this company?
LEGEND
<100 employees
>100 employees
NOTE:
Founders only. Numbers may not add to 100 due to rounding.
of women first-time founders start their company with no initial capital
STARTING WITH LESS THAN $25K
55%
The need for funds focused on diversity is as important as the need for insights and related to diverse founders - and there is zero data on black founders in the UK.
Andy Davis
Backstage Capital
This is why I started interviewing black founders and creating a database with their permission. It is important to shine a light on the differences, especially as black founders have become synonymous with a seemingly perpetually fixed 0.2% funded statistic or the fact that 67% of those I surveyed mentioned that they were struggling to meet their needs before starting a company, compared to 19% of the respondents surveyed by Atomico.
www.stateofeuropeantech.com
In Partnership with
&
It's time that black founders have realistic insights and perspectives as to what it takes to be a black founder and know that there are others in their ecosystem like them. This will hopefully create a clearer path for future black founders and the investors who back them.
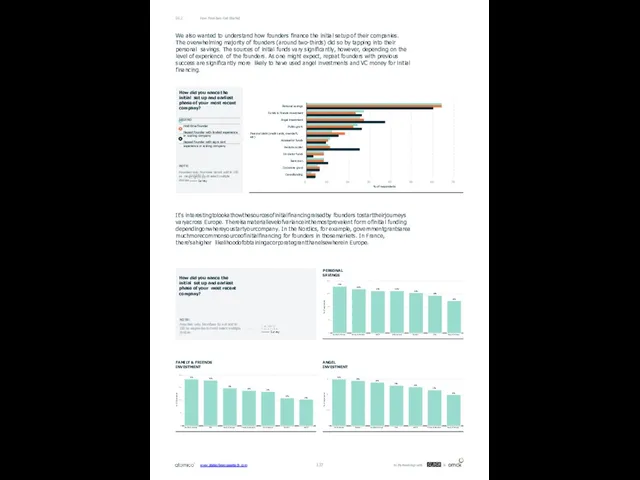
How Founders Get Started
06.2
We also wanted to understand how founders finance
How Founders Get Started
06.2
We also wanted to understand how founders finance
The overwhelming majority of founders (around two-thirds) did so by tapping into their personal savings. The sources of initial funds vary significantly, however, depending on the level of experience of the founders. As one might expect, repeat founders with previous success are significantly more likely to have used angel investments and VC money for initial financing.
It's interestingtolookathowthesourcesofinitialfinancingraisedby founders tostarttheirjourneys varyacross Europe. Thereisamateriallevelofvarianceinthemostprevalent form ofinitial funding dependingonwhereyoustartyourcompany. In the Nordics, for example, governmentgrantsarea muchmorecommonsourceofinitialfinancing for founders in thosemarkets. In France, there'sahigher likelihoodofobtainingacorporategrantthanelsewherein Europe.
Personal savings
Family & friends investment
Angel investment
Public grant
Personal debt (credit cards, overdraft, etc)
Accelerator funds
Venture capital
Incubator funds
Bank loan
Corporate grant
Crowdfunding
0
10
20
30
40
% of respondents
50
60
70
How did you nance the initial set up and earliest phase of your most recent company?
LEGEND
First-time founder
Repeat founder with limited experience in scaling company
Repeat founder with signi cant experience in scaling company
NOTE:
Founders only. Numbers do not add to 100 as respondents could select multiple choices.
% of respondents
72%
68%
65%
65%
62%
58%
50%
Southern Europe
France & Benelux
DACH
UK & Ireland
Nordics
CEE
Rest of Europe
0
20
40
60
80
% of respondents
37%
36%
30%
28%
27%
22%
21%
Southern Europe
CEE
Rest of Europe
France & Benelux
UK & Ireland
Nordics
DACH
0
10
20
30
40
% of respondents
30%
29%
28%
26%
25%
23%
20%
UK & Ireland
Nordics
Southern Europe
CEE
DACH
France & Benelux
Rest of Europe
0
10
20
30
PERSONAL SAVINGS
ANGEL INVESTMENT
FAMILY & FRIENDS INVESTMENT
How did you nance the initial set up and earliest phase of your most recent company?
www.stateofeuropeantech.com
In Partnership with
&
NOTE:
Founders only. Numbers do not add to 100 as respondents could select multiple choices.
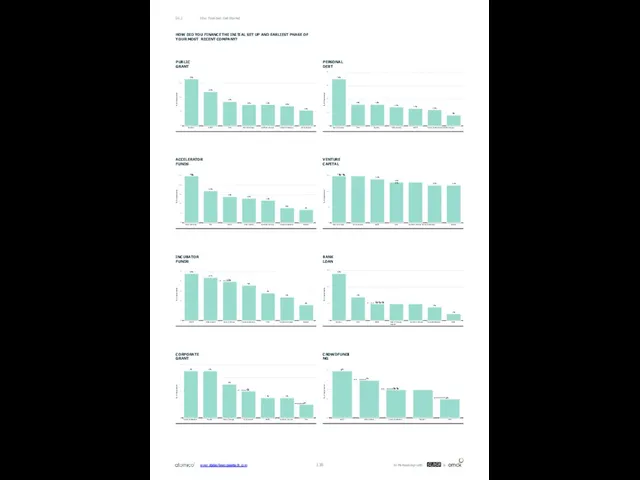
How Founders Get Started
06.2
% of respondents
33%
24%
17%
15%
15%
14%
11%
Nordics
DACH
CEE
Rest of Europe
Southern Europe
France & Benelux
UK
How Founders Get Started
06.2
% of respondents
33%
24%
17%
15%
15%
14%
11%
Nordics
DACH
CEE
Rest of Europe
Southern Europe
France & Benelux
UK
0
10
20
30
% of respondents
35%
16%
16%
14%
13%
12%
8%
Rest of Europe
CEE
Nordics
UK & Ireland
DACH
France & Benelux Southern Europe
0
10
20
30
40
PERSONAL DEBT
PUBLIC GRANT
HOW DID YOU FINANCE THE INITIAL SET UP AND EARLIEST PHASE OF YOUR MOST RECENT COMPANY?
% of respondents
25%
17%
14%
13%
12%
8%
7%
Rest of Europe
CEE
DACH
UK & Ireland
Southern Europe
France & Benelux
Nordics
0
5
10
15
20
25
% of respondents
15% 15%
14%
13% 13%
12%
12%
Rest of Europe
UK & Ireland
DACH
CEE
Southern Europe France & Benelux
Nordics
0
5
10
15
VENTURE CAPITAL
ACCELERATOR FUNDS
% of respondents
12%
11%
10%
9%
7%
6%
4%
DACH
UK & Ireland
Rest of Europe
France & Benelux
CEE
Southern Europe
Nordics
0
3
5
8
10
13
% of respondents
14%
7%
5% 5% 5%
4%
2%
Nordics
CEE
DACH
Rest of Europe Southern Europe France & Benelux UK & Ireland
0
5
10
15
BANK LOAN
INCUBATOR FUNDS
% of respondents
7%
7%
5%
4%
3%
3%
2%
France & Benelux
Nordics
Rest of Europe
UK & Ireland
DACH
Southern Europe
CEE
0
2
4
6
8
% of respondents
5%
www.stateofeuropeantech.com
In Partnership with
&
4%
3% 3%
2%
DACH
UK & Ireland
France & Benelux
Nordics
CEE
0
1
2
3
4
5
CROWDFUNDING
CORPORATE GRANT
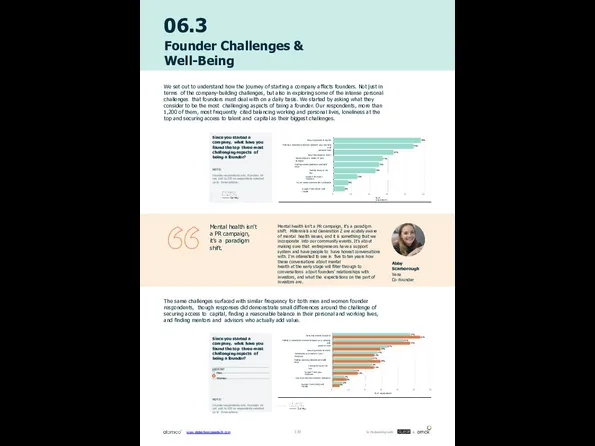
06.3
Founder Challenges & Well-Being
We set out to understand how the journey
06.3
Founder Challenges & Well-Being
We set out to understand how the journey
48%
44%
33%
Securing access to capital
Finding a reasonable balance between your working and
personal lives
Securing access to talent
Developing as a leader of your company
Finding mentors/advisors who add value
Feeling lonely at the top
Support from your investors
Future career/reconversion prospects
Support from family and friends
0
10
20
30
% of respondents
40
50
Since you started a company, what have you found the top three most challenging aspects of being a founder?
NOTE:
Founder respondents only. Numbers do not add to 100 as respondents selected up to three options.
Mental health isn’t
a PR campaign, it’s a paradigm shift.
Mental health isn’t a PR campaign, it's a paradigm shift. Millennials and Generation Z are acutely aware of mental health issues, and it is something that we incorporate into our community events. It’s about making sure that entrepreneurs have a support system and have people to have honest conversations with. I'm interested to see in five to ten years how these conversations about mental
health at the early stage will filter through to conversations about founders' relationships with investors, and what the expectations on the part of investors are.
Abby Scarborough
Yena
Co-Founder
The same challenges surfaced with similar frequency for both men and women founder respondents, though responses did demonstrate small differences around the challenge of securing access to capital, finding a reasonable balance in their personal and working lives, and finding mentors and advisors who actually add value.
47%
43%
33%
27%
24%
23%
53%
47%
29%
25%
29%
25%
Securing access to capital
Finding a reasonable balance between your working and
personal lives
Securing access to talent
Developing as a leader of your company
Finding mentors/advisors who add value
Feeling lonely at the top
Support from your investors
Future career/reconversion prospects
Support from family and friends
0
10
20
30
% of respondents
40
50
60
Since you started a company, what have you found the top three most challenging aspects of being a founder?
LEGEND
Men Women
NOTE:
Founder respondents only. Numbers do not add to 100 as respondents selected up to three options.
www.stateofeuropeantech.com
In Partnership with
&
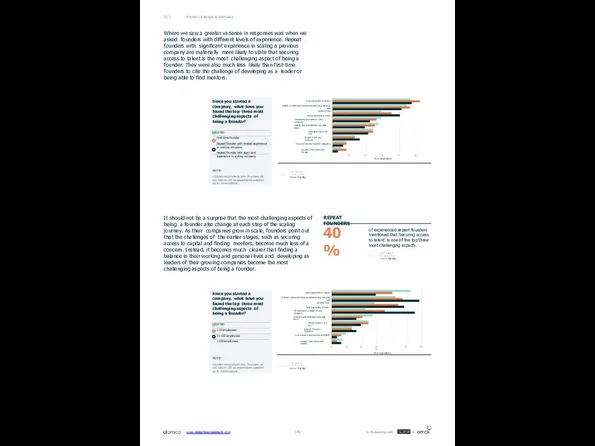
Founder Challenges & Well-Being
06.3
Where we saw a greater variance in responses
Founder Challenges & Well-Being
06.3
Where we saw a greater variance in responses
Securing access to capital
Finding a reasonable balance between your working and
personal lives
Securing access to talent
Developing as a leader of your company
Finding mentors/advisors that add value
Feeling lonely at the top
Support from your investors
Future career/reconversion prospects
Support from family and friends
0
10
20
30
% of respondents
40
50
Since you started a company, what have you found the top three most challenging aspects of being a founder?
LEGEND
First-time founder
Repeat founder with limited experience in scaling company
Repeat founder with signi cant experience in scaling company
NOTE:
Founder respondents only. Numbers do not add to 100 as respondents selected up to three options.
It should not be a surprise that the most challenging aspects of being a founder also change at each step of the scaling journey. As their companies grow in scale, founders point out that the challenges of the earlier stages, such as securing access to capital and finding mentors, become much less of a concern. Instead, it becomes much clearer that finding a balance in their working and personal lives and developing as leaders of their growing companies become the most challenging aspects of being a founder.
Securing access to capital
Finding a reasonable balance between your working and
personal lives
Securing access to talent
Developing as a leader of your company
Finding mentors/advisors who add value
Feeling lonely at the top
Support from your investors
Future career/reconversion prospects
Support from family and friends
0
10
20
30 40
% of respondents
50
60
Since you started a company, what have you found the top three most challenging aspects of being a founder?
LEGEND
<10 employees
11-100 employees
>100 employees
NOTE:
Founder respondents only. Numbers do not add to 100 as respondents selected up to three options.
of experienced repeat founders mentioned that 'securing access to talent' is one of the top three most challenging aspects.
REPEAT FOUNDERS
40%
www.stateofeuropeantech.com
In Partnership with
&
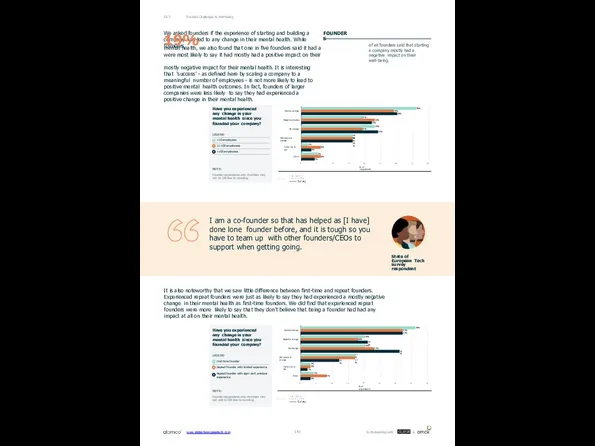
Founder Challenges & Well-Being
06.3
of all founders said that starting a company
Founder Challenges & Well-Being
06.3
of all founders said that starting a company
FOUNDERS
We asked founders if the experience of starting and building a company had led to any change in their mental health. While founders
mental health, we also found that one in five founders said it had a 19%
were most likely to say it had mostly had a positive impact on their
mostly negative impact for their mental health. It is interesting that 'success' - as defined here by scaling a company to a meaningful number of employees - is not more likely to lead to positive mental health outcomes. In fact, founders of larger companies were less likely to say they had experienced a positive change in their mental health.
36%
19%
23%
16%
2%
5%
29%
23%
19%
6%
6%
30%
22%
24%
16%
16%
3%
4%
Positive change
Negative change
No change
Not aware of change
Prefer not to say
Other
0
5
10
15
20
% of respondents
25
30
35
40
Have you experienced any change in your mental health since you founded your company?
LEGEND
<10 employees
11-100 employees
>100 employees
NOTE:
Founder respondents only. Numbers may not to 100 due to rounding.
I am a co-founder so that has helped as [I have] done lone founder before, and it is tough so you have to team up with other founders/CEOs to support when getting going.
State of European Tech survey respondent
It is also noteworthy that we saw little difference between first-time and repeat founders. Experienced repeat founders were just as likely to say they had experienced a mostly negative change in their mental health as first-time founders. We did find that experienced repeat founders were more likely to say that they don't believe that being a founder had had any impact at all on their mental health.
Have you experienced any change in your mental health since you founded your company?
LEGEND
36%
20%
20%
4%
32%
18%
23%
17%
17%
3%
3%
8%
32%
21%
31%
12%
2%
3%
Positive change
Negative change
No change
First-time founder
Repeat founder with limited experience
Repeat founder with signi cant previous experience
Not aware of change
Prefer not to say
Other
0
5
10
15
20
% of respondents
25
30
35
40
NOTE:
Founder respondents only. Numbers may not add to 100 due to rounding.
www.stateofeuropeantech.com
In Partnership with
&
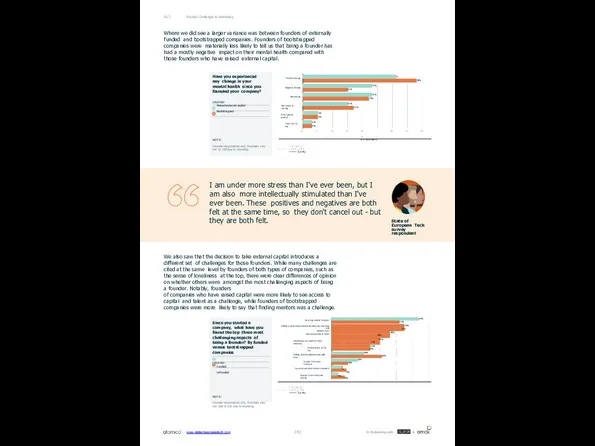
Where we did see a larger variance was between founders of
Where we did see a larger variance was between founders of
31%
38%
Positive change
Negative change
No change
Not aware of change
Other (please specify)
Prefer not to say
0
5
10
15
20 25
% of respondents
30
35
40
Have you experienced any change in your mental health since you founded your company?
LEGEND
Raised external capital Bootstrapped
NOTE:
Founder respondents only. Numbers may not to 100 due to rounding.
Founder Challenges & Well-Being
06.3
I am under more stress than I've ever been, but I am also more intellectually stimulated than I've ever been. These positives and negatives are both felt at the same time, so they don't cancel out - but they are both felt.
State of European Tech survey respondent
We also saw that the decision to take external capital introduces a different set of challenges for those founders. While many challenges are cited at the same level by founders of both types of companies, such as the sense of loneliness at the top, there were clear differences of opinion on whether others were amongst the most challenging aspects of being a founder. Notably, founders
of companies who have raised capital were more likely to see access to capital and talent as a challenge, while founders of bootstrapped companies were more likely to say that finding mentors was a challenge.
54%
45%
42%
%
Securing access to capital
Finding a reasonable balance between your working and
personal lives
Securing access to talent
Developing as a leader of your company
Feeling lonely at the top
Finding mentors/advisors who add value
Support from your investors
Future career/reconversion prospects
Support from family and friends
Since you started a company, what have you found the top three most challenging aspects of being a founder? By funded versus bootstrapped companies
LEGEND
Funded Unfunded
NOTE:
Founder respondents only. Numbers may not add to 100 due to rounding.
www.stateofeuropeantech.com
In Partnership with
&
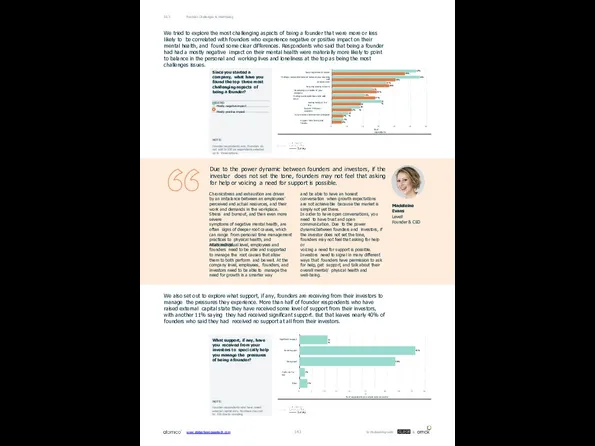
We tried to explore the most challenging aspects of being a
We tried to explore the most challenging aspects of being a
53%
55%
34%
25%
20%
31%
17%
10%
7%
46%
40%
36%
28%
27%
18%
12%
7%
6%
Securing access to capital
Finding a reasonable balance between your working and
personal lives
Securing access to talent
Developing as a leader of your company
Finding mentors/advisors who add value
Feeling lonely at the top
Support from your investors
Future career/reconversion prospects
Support from family and friends
0
10
20
30
% of respondents
40
50
60
Since you started a company, what have you found the top three most challenging aspects of being a founder?
LEGEND
Mostly negative impact Mostly positive impact
NOTE:
Founder respondents only. Numbers do not add to 100 as respondents selected up to three options.
Due to the power dynamic between founders and investors, if the investor does not set the tone, founders may not feel that asking for help or voicing a need for support is possible.
Chronicstress and exhaustion are driven by an imbalance between an employees' perceived and actual resources, and their work and demands in the workplace. Stress and burnout, and then even more severe
symptoms of negative mental health, are often signs of deeper root causes, which can range from personal time management practices to physical health, and relationships.
At an individual level, employees and founders need to be able and supported to manage the root causes that allow them to both perform and be well. At the company level, employees, founders, and investors need to be able to manage the need for growth in a smarter way
Madeleine Evans
Levell
Founder & CEO
Founder Challenges & Well-Being
06.3
We also set out to explore what support, if any, founders are receiving from their investors to manage the pressures they experience. More than half of founder respondents who have raised external capital state they have received some level of support from their investors, with another 11% saying they had received significant support. But that leaves nearly 40% of founders who said they had received no support at all from their investors.
11%
46%
38%
2%
3%
Significant support
Some support
No support
Prefer not to say
Other
0
5
10
15
20 25 30 35
% of respondents who raised external capital
40
45
50
What support, if any, have you received from your investors to speci cally help you manage the pressures of being a founder?
NOTE:
Founder respondents who have raised external capital only. Numbers may not to 100 due to rounding.
and be able to have an honest conversation when growth expectations are not achievable because the market is simply not yet there.
www.stateofeuropeantech.com
In Partnership with
&
In order to have open conversations, you need to have trust and open communication. Due to the power dynamicbetween founders and investors, if the investor does not set the tone, founders may not feel that asking for help or
voicing a need for support is possible. Investors need to signal in many different ways that founders have permission to ask for help, get support, and talk about their overall mental/ physical health and well-being.
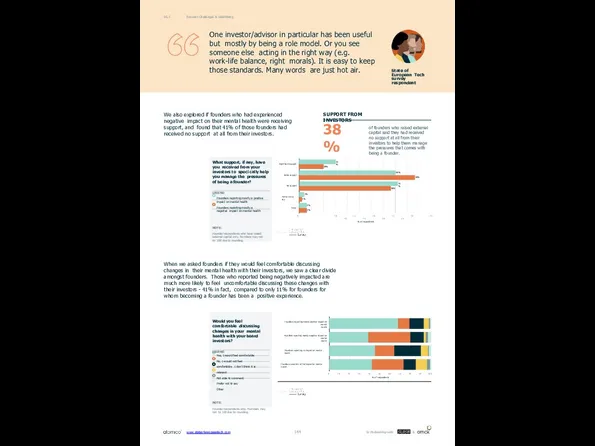
We also explored if founders who had experienced negative impact on
We also explored if founders who had experienced negative impact on
15%
40%
41%
10%
48%
Significant support
Some support
No support
Prefer not to say
Other
0 5 10 15 20 25 30 35 40 45 50 55
% of respondents
What support, if any, have you received from your investors to speci cally help you manage the pressures of being a founder?
LEGEND
Founders reporting mostly a positive impact on mental health
Founders reporting mostly a negative impact on mental health
NOTE:
Founder respondents who have raised external capital only. Numbers may not to 100 due to rounding.
One investor/advisor in particular has been useful but mostly by being a role model. Or you see someone else acting in the right way (e.g. work-life balance, right morals). It is easy to keep those standards. Many words are just hot air.
State of European Tech survey respondent
of founders who raised external capital said they had received no support at all from their investors to help them manage the pressures that comes with being a founder.
SUPPORT FROM INVESTORS
38%
Founder Challenges & Well-Being
06.3
When we asked founders if they would feel comfortable discussing changes in their mental health with their investors, we saw a clear divide amongst founders. Those who reported being negatively impacted are much more likely to feel uncomfortable discussing these changes with their investors - 41% in fact, compared to only 11% for founders for whom becoming a founder has been a positive experience.
Founders reporting mostly positive impact on mental
health
Founders reporting mostly negative impact on mental
health
Founders reporting no impact on mental health
Founders uncertain of the impact on mental health
0
10
20
30
40
50
% of respondents
60
70
80
90
100
Would you feel comfortable discussing changes in your mental health with your board investors?
LEGEND
Yes, I would feel comfortable No, I would not feel comfortable I don't think it is relevant
Not able to comment Prefer not to say Other
NOTE:
Founder respondents only. Numbers may not to 100 due to rounding.
www.stateofeuropeantech.com
In Partnership with
&
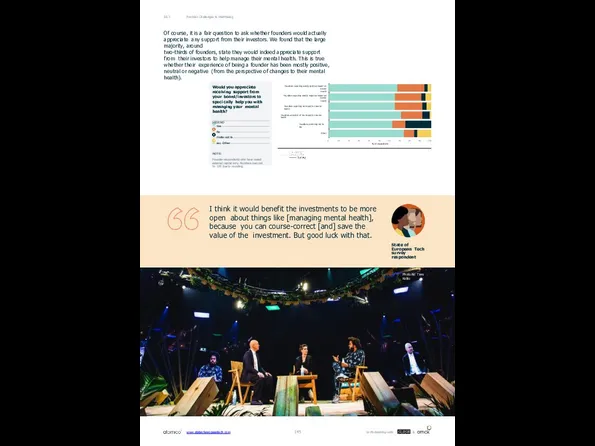
Of course, it is a fair question to ask whether founders
Of course, it is a fair question to ask whether founders
two-thirds of founders, state they would indeed appreciate support from their investors to help manage their mental health. This is true whether their experience of being a founder has been mostly positive, neutral or negative (from the perspective of changes to their mental health).
Founders reporting mostly positive impact on mental
health
Founders reporting mostly negative impact on mental
health
Founders reporting no impact on mental health
Founders uncertain of the impact on mental health
Founders preferring not to say
Other
0
10
20
30
40
50
% of respondents
60
70
80
90
100
I think it would benefit the investments to be more open about things like [managing mental health], because you can course-correct [and] save the value of the investment. But good luck with that.
State of European Tech survey respondent
Founder Challenges & Well-Being
06.3
Would you appreciate receiving support from your board/investors to speci cally help you with managing your mental health?
LEGEND
Yes No
Prefer not to say Other
NOTE:
Founder respondents who have raised external capital only. Numbers may not to 100 due to rounding.
Photo by: Tanu Kallio
www.stateofeuropeantech.com
In Partnership with
&
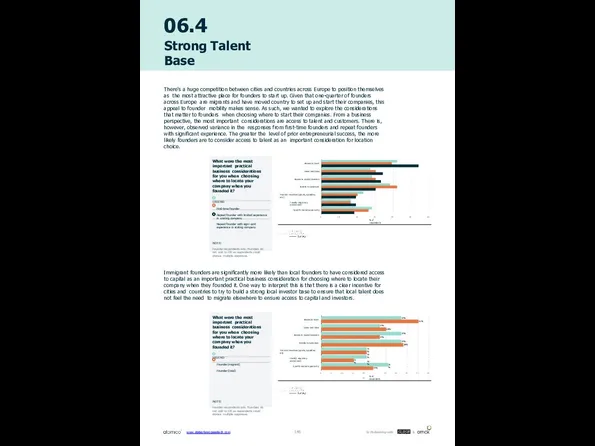
06.4
Strong Talent Base
There's a huge competition between cities and countries across
06.4
Strong Talent Base
There's a huge competition between cities and countries across
Immigrant founders are significantly more likely than local founders to have considered access
to capital as an important practical business consideration for choosing where to locate their company when they founded it. One way to interpret this is that there is a clear incentive for cities and countries to try to build a strong local investor base to ensure that local talent does not feel the need to migrate elsewhere to ensure access to capital and investors.
Access to talent
Lower cost base
Access to capital/investors
Access to customers
Financial incentives (grants, subsidies, etc.)
Friendly regulatory environment
Specific market opportunity
0
10
20
30
% of respondents
40
50
60
% of respondents
37%
27%
37%
37%
31%
45%
30%
27%
38%
21%
21%
21%
15%
24%
Access to talent
Lower cost base
Access to capital/investors
Access to customers
Financial incentives (grants, subsidies, etc)
Friendly regulatory environment
Specific market opportunity
0
5
10
15
20 25
30
35
40
45
50
What were the most important practical business considerations for you when choosing where to locate your company when you founded it?
LEGEND
First-time founder
Repeat founder with limited experience in scaling company
Repeat founder with signi cant experience in scaling company
NOTE:
Founder respondents only. Numbers do not add to 100 as respondents could choose multiple responses.
What were the most important practical business considerations for you when choosing where to locate your company when you founded it?
LEGEND
Founder (migrant)
Founder (local)
NOTE:
Founder respondents only. Numbers do not add to 100 as respondents could choose multiple responses.
www.stateofeuropeantech.com
In Partnership with
&
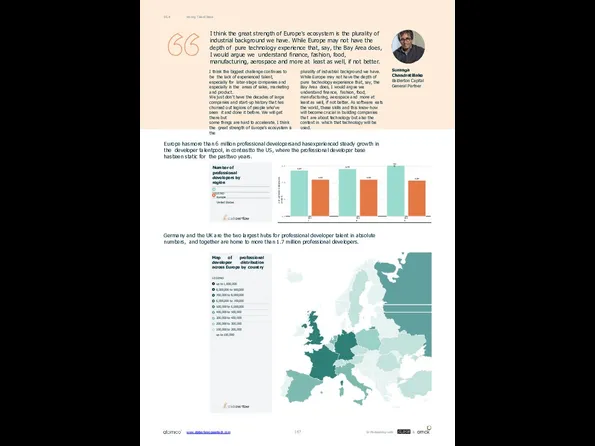
I think the great strength of Europe's ecosystem is the plurality
I think the great strength of Europe's ecosystem is the plurality
I think the biggest challenge continues to be the lack of experienced talent, especially for later-stage companies and especially in the areas of sales, marketing and product.
We just don't have the decades of large companies and start-up history that has churned out legions of people who've seen it and done it before. We will get there but
some things are hard to accelerate. I think the great strength of Europe's ecosystem is the
Suranga Chandratillake Balderton Capital General Partner
Europe hasmore than 6 million professional developersand hasexperienced steady growth in the developer talentpool, in contrastto the US, where the professional developer base hasbeen static for the pasttwo years.
Number of professional developers by region
LEGEND
Europe United States
# of professional developers (million)
5.5M
5.7M
6.1M
4.4M
4.4M
4.3M
2017
2018
2019
0.0
2.0
4.0
6.0
Strong Talent Base
06.4
plurality of industrial background we have. While Europe may not have the depth of pure technology experience that, say, the Bay Area does, I would argue we understand finance, fashion, food, manufacturing, aerospace and more at least as well, if not better. As software eats the world, these skills and this know-how will become crucial in building companies that are about technology but also the context in which that technology will be used.
Map of professional developer distribution across Europe by country
LEGEND
up to 1,000,000
8,000,000 to 900,000
700,000 to 8,000,000
6,000,000 to 700,000
500,000 to 6,000,000
400,000 to 500,000
300,000 to 400,000
200,000 to 300,000
100,000 to 200,000
up to 100,000
Germany and the UK are the two largest hubs for professional developer talent in absolute numbers, and together are home to more than 1.7 million professional developers.
www.stateofeuropeantech.com
In Partnership with
&
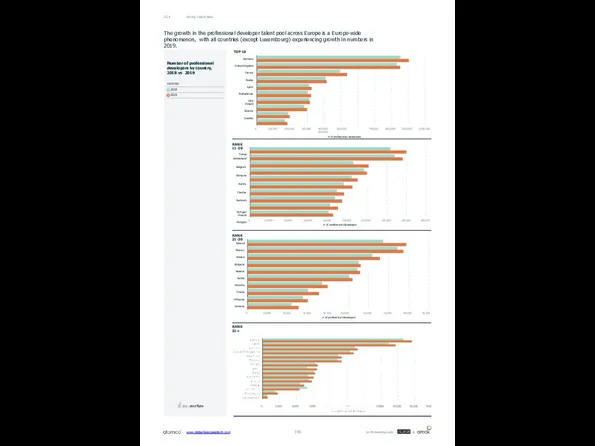
Strong Talent Base
06.4
The growth in the professional developer talent pool across
Strong Talent Base
06.4
The growth in the professional developer talent pool across
Number of professional developers by country, 2018 vs 2019
LEGEND
2018
2019
United Kingdom
France
Russia
Spain
Netherlands
Italy
Poland Ukraine Sweden
0
100,000
200,000
300,000
400,000 500,000 600,000
# of professional developers
700,000
800,000
900,000
1,000,000
0
20,000
40,000
60,000
80,000 100,000 120,000
# of professional developers
140,000
160,000
180,000
RANK 11-20
Turkey
Switzerland Belgium
Romania Austria
Czechia Denmark
Portugal
Finland Hungary
0
10,000
20,000
30,000
40,000 50,000
# of professional developers
60,000
70,000
80,000
90,000
RANK 21-30
Ireland Norway Greece Bulgaria Belarus Serbia Slovakia Croatia Lithuania Slovenia
RANK 31+
TOP 10
Germany
www.stateofeuropeantech.com
In Partnership with
&
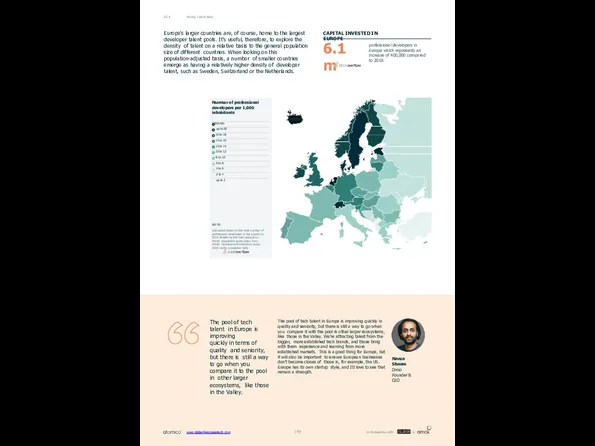
Europe's larger countries are, of course, home to the largest developer
Europe's larger countries are, of course, home to the largest developer
professional developers in Europe which represents an increase of 400,000 compared to 2018.
CAPITAL INVESTED IN EUROPE
6.1m
Strong Talent Base
06.4
The pool of tech talent in Europe is improving
quickly in terms of quality and seniority, but there is still a way to go when you compare it to the pool in other larger ecosystems, like those in the Valley.
The pool of tech talent in Europe is improving quickly in quality and seniority, but there is still a way to go when you compare it with the pool in other larger ecosystems, like those in the Valley. We're attracting talent from the bigger, more established tech brands, and those bring with them experience and learning from more established markets. This is a good thing for Europe, but it will also be important to ensure European businesses don't become clones of those in, for example, the US. Europe has its own startup style, and I'd love to see that remain a strength.
Naren Shaam
Omio
Founder & CEO
Number of professional developers per 1,000 inhabitants
LEGEND
up to 20
16 to 18
14 to 16
12 to 14
10 to 12
8 to 10
6 to 8
4 to 6
2 to 4
up to 2
NOTE:
Calculated based on the total number of professional developers in the country in 2019 divided by the total population. World population gures taken from World Development Indicators using 2018 world population data.
www.stateofeuropeantech.com
In Partnership with
&
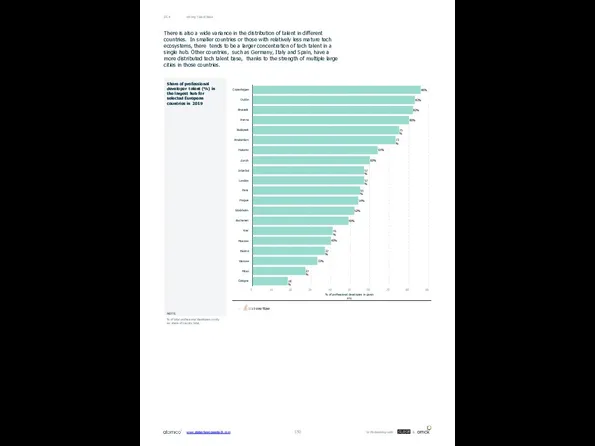
86%
83%
82%
80%
75%
73%
64%
60%
57%
57%
55%
54%
52%
49%
41%
40%
37%
33%
27%
18%
Copenhagen
Dublin
Brussels
Vienna
Budapest
Amsterdam
Helsinki
Zurich
Istanbul
London
Paris
Prague
Stockholm
Bucharest
Kiev
Moscow
Madrid
Warsaw
Milan
Cologne
0
10
20
30
40 50 60
% of professional developers in given city
70
80
90
Share of professional developer talent
NOTE:
% of total professional developers in city as share of country total.
There is also a wide variance in the distribution of talent in different countries. In smaller countries or those with relatively less mature tech ecosystems, there tends to be a larger concentration of tech talent in a single hub. Other countries, such as Germany, Italy and Spain, have a more distributed tech talent base, thanks to the strength of multiple large cities in those countries.
Strong Talent Base
06.4
www.stateofeuropeantech.com
In Partnership with
&
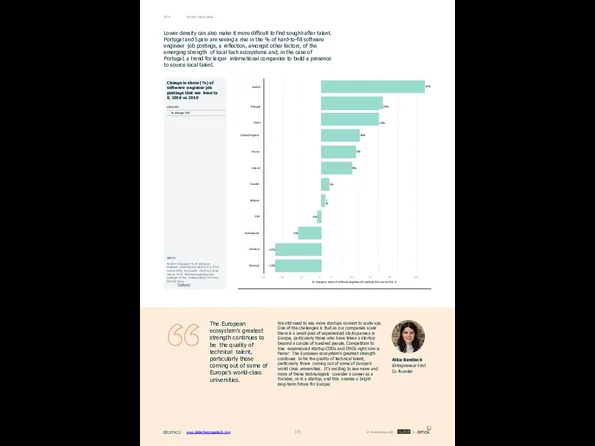
The European ecosystem's greatest strength continues to be the quality of
The European ecosystem's greatest strength continues to be the quality of
We still need to see more startups convert to scale-ups. One of the challenges is that as our companies scale there is a small pool of experienced startup execs in Europe, particularly those who have taken a startup beyond a couple of hundred people. Competition to hire experienced startup COOs and CMOs right now is fierce! The European ecosystem's greatest strength continues to be the quality of technical talent, particularly those coming out of some of Europe's world class universities. It's exciting to see more and more of these technologists consider a career as a founder, or in a startup, and this creates a bright long-term future for Europe.
Alice Bentinck Entrepreneur First Co-founder
NOTE:
%-point change in % of software engineer jobs that are hard to ll in 2019 versus 2018 by country. Hard to ll is de ned as % of 'software engineer' job postings on the Indeed site(s) for more than 60 days.
27%
10%
9%
8%
2%
1%
-1%
-6%
-12%
-12%
United Kingdom
France
Ireland
Sweden
Belgium
Italy
Netherlands
Germany
Denmark
-15
-10
-5
0 5 10 15 20
% change in share of software engineer job postings that are hard to ll
25
Lower density can also make it more difficult to find sought-after talent. Portugal and Spain are seeing a rise in the % of hard-to-fill software engineer job postings, a reflection, amongst other factors, of the emerging strength of local tech ecosystems and, in the case of Portugal, a trend for larger international companies to build a presence to source local talent.
Strong Talent Base
06.4
www.stateofeuropeantech.com
In Partnership with
&
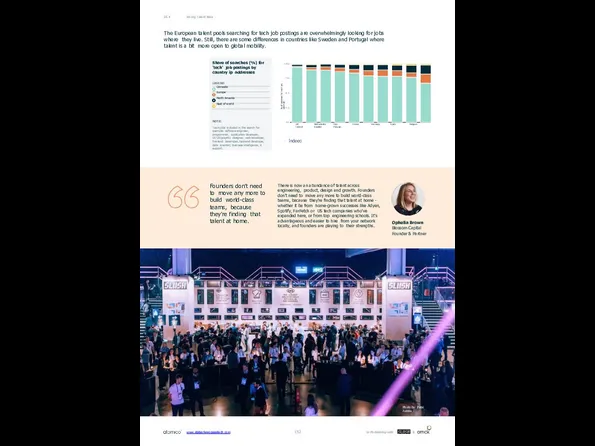
% of searches for 'tech' job postings
UK Netherlands Italy France Germany Spain Belgium Ireland Sweden Portugal
0.0
25.0
50.0
75.0
100.0
The European talent pools searching
% of searches for 'tech' job postings
UK Netherlands Italy France Germany Spain Belgium Ireland Sweden Portugal
0.0
25.0
50.0
75.0
100.0
The European talent pools searching
Share of searches (%) for 'tech' job postings by country ip addresses
LEGEND
Domestic Europe
North America Rest of world
NOTE:
'Tech jobs' included in the search for example: software engineer, programmer, application developer, UI/UX/graphic designer, web developer, frontend developer, backend developer, data scientist, business intelligence, it support.
Founders don't need to move any more to build world-class teams, because they're finding that talent at home.
There is now an abundance of talent across engineering, product, design and growth. Founders don't need to move any more to build world-class teams, because they're finding that talent at home - whether it be from home-grown successes like Adyen, Spotify, FarFetch or US tech companies who've expanded here, or from top engineering schools. It's advantageous and easier to hire from your network locally, and founders are playing to their strengths.
Ophelia Brown Blossom Capital Founder & Partner
Strong Talent Base
06.4
Photo by: Petri Anttila
www.stateofeuropeantech.com
In Partnership with
&
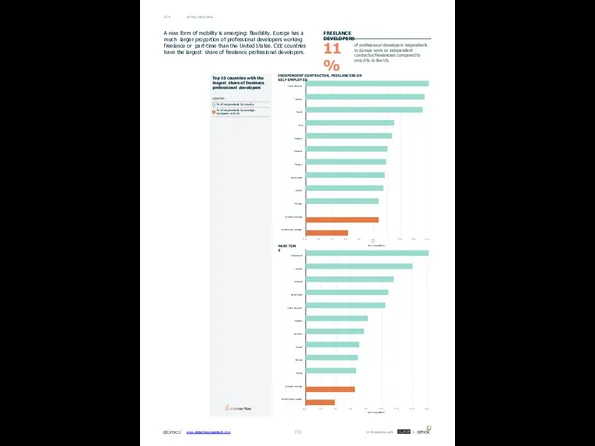
Top 10 countries with the largest share of freelance professional developers
LEGEND
%
Top 10 countries with the largest share of freelance professional developers
LEGEND
%
% of respondents by average: European and US
Czech Republic
Ukraine
Poland
Italy
Belgium
Romania
Hungary
Netherlands
Austria
Portugal
European average
United States average
0.0
2.0
4.0
6.0
8.0
10.0 12.0
% of respondents
14.0
16.0
18.0
A new form of mobility is emerging: flexibility. Europe has a much larger proportion of professional developers working freelance or part-time than the United States. CEE countries have the largest share of freelance professional developers.
% of respondents
Switzerland
Austria
Germany
Netherlands
Czech Republic
Hungary
Denmark
Finland
Norway
Poland
European average
United States average
0.0
2.0
4.0
6.0
8.0
10.0
12.0
14.0
16.0
INDEPENDENT CONTRACTOR, FREELANCERS OR SELF-EMPLOYED
PART-TIME
Strong Talent Base
06.4
of professional developers respondents in Europe work as independent contractor/freelancers compared to only 6% in the US.
FREELANCE DEVELOPERS
11%
www.stateofeuropeantech.com
In Partnership with
&
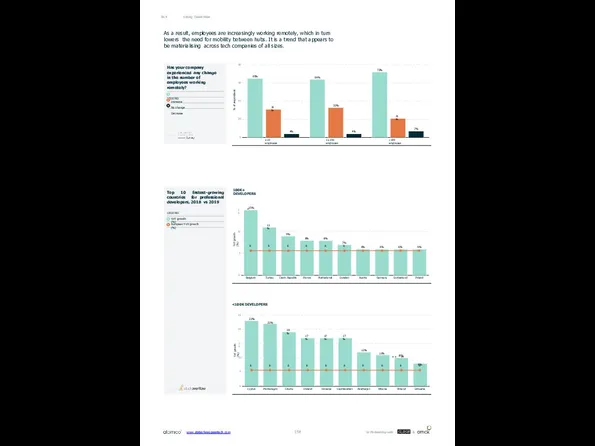
% of respondents
65%
64%
72%
31%
33%
21%
4%
4%
7%
≤10 employees
11-100 employees
>100 employees
0
20
40
60
80
YoY growth (%)
19%
17%
17%
17%
12%
11%
10%
8%
6
6
6
6
6
6
6
6
6
6
Cyprus
Montenegro
Croatia
Ireland
Slovenia
Liechtenstein
Azerbaijan
Albania
Finland
Lithuania
0
5
10
15
20
YoY
% of respondents
65%
64%
72%
31%
33%
21%
4%
4%
7%
≤10 employees
11-100 employees
>100 employees
0
20
40
60
80
YoY growth (%)
19%
17%
17%
17%
12%
11%
10%
8%
6
6
6
6
6
6
6
6
6
6
Cyprus
Montenegro
Croatia
Ireland
Slovenia
Liechtenstein
Azerbaijan
Albania
Finland
Lithuania
0
5
10
15
20
YoY
15%
11%
9%
8%
8%
7%
6%
6%
6%
6%
6
6
6
6
6
6
Belgium
Turkey
Czech Republic
France
Netherlands
Sweden
Austria
Germany
Switzerland
Poland
0
5
10
15
Strong Talent Base
06.4
As a result, employees are increasingly working remotely, which in turn lowers the need for mobility between hubs. It is a trend that appears to be materialising across tech companies of all sizes.
Has your company experienced any change in the number of employees working remotely?
LEGEND
Increase No change Decrease
Top 10 fastest-growing countries for professional developers, 2018 vs 2019
LEGEND
YoY growth (%)
European YoY growth (%)
<100K DEVELOPERS
25
23%
22%
100K+ DEVELOPERS
www.stateofeuropeantech.com
In Partnership with
&
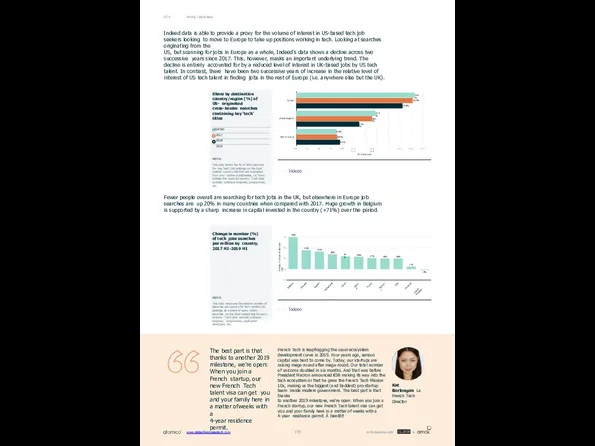
The best part is that thanks to another 2019 milestone, we're
The best part is that thanks to another 2019 milestone, we're
4-year residence permit.
French Tech is leapfrogging the usual ecosystem development curve in 2019. Four years ago, serious capital was hard to come by. Today, our startups are raising mega-round after mega-round. Our total number of unicorns doubled in six months. And that was before President Macron announced €5B making its way into the tech ecosystem or that he grew the French Tech Mission 10x, making us the biggest (and baddest) pro-startup team inside modern government. The best part is that thanks
to another 2019 milestone, we're open: When you join a French startup, our new French Tech talent visa can get you and your family here in a matter of weeks with a 4-year residence permit. À bientôt!
Kat Borlongan La French Tech Director
Indeed data is able to provide a proxy for the volume of interest in US-based tech job seekers looking to move to Europe to take up positions working in tech. Looking at searches originating from the
US, but scanning for jobs in Europe as a whole, Indeed's data shows a decline across two successive years since 2017. This, however, masks an important underlying trend. The decline is entirely accounted for by a reduced level of interest in UK-based jobs by US tech talent. In contrast, there have been two successive years of increase in the relative level of interest of US tech talent in finding jobs in the rest of Europe (i.e. anywhere else but the UK).
Fewer people overall are searching for tech jobs in the UK, but elsewhere in Europe job searches are up 20% in many countries when compared with 2017. Huge growth in Belgium is supported by a sharp increase in capital invested in the country (+71%) over the period.
25.6%
17.1%
8.6%
25.2%
16.4%
8.8%
23.0%
13.6%
9.4%
Europe
United Kingdom
Rest of Europe
0.0
2.5
5.0
7.5
10.0
12.5 15.0 17.5 20.0
% of searches
22.5
25.0
27.5
Strong Talent Base
06.4
Share by destination country/region (%) of US- originated cross-border searches containing key 'tech' titles
LEGEND
2017
2018
2019
NOTE:
This data shows the % of total searches for key 'tech' job postings on the local Indeed country site that are originated from non- native ip addresses, i.e. from outside the speci ed country. 'Tech jobs' include: software engineer, programmer, etc.
Change in number of searches (%)
76%
45%
42%
36%
31%
30%
27%
26%
26%
7%
-3%
Belgium
Portugal
Sweden
Netherlands
Spain
Ireland
France
Germany
Italy
r
Denma k
United Kingdom
0
-25
25
50
75
Change in number (%) of tech jobs searches per million by country, 2017 H1-2019 H1
NOTE:
This data measures the relative number of searches per country for tech related job postings as a share of every million searches on the local Indeed site for each country. 'Tech jobs' include: software engineer, programmer, application developer, etc.
www.stateofeuropeantech.com
In Partnership with
&
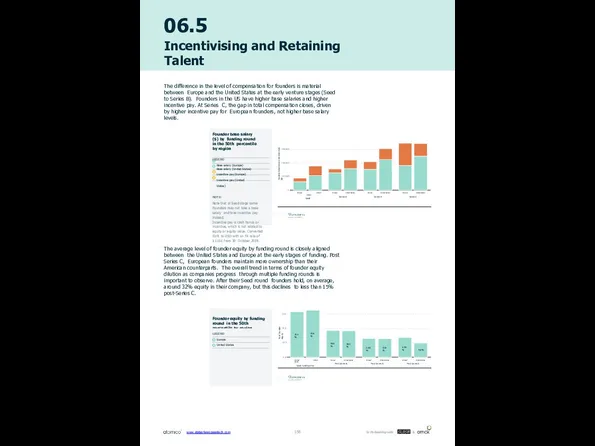
06.5
Incentivising and Retaining Talent
The difference in the level of compensation for
06.5
Incentivising and Retaining Talent
The difference in the level of compensation for
The average level of founder equity by funding round is closely aligned between the United States and Europe at the early stages of funding. Post Series C, European founders maintain more ownership than their American counterparts. The overall trend in terms of founder equity dilution as companies progress through multiple funding rounds is important to observe. After their Seed round founders hold, on average, around 32% equity in their company, but this declines to less than 15% post-Series C.
Founder base salary and incentives ($)
Europe
Europe
Europe
Europe United States
Seed
United States
Series A
United States
Series B
United States
Series C
0
100,000
200,000
300,000
Founder equity by funding round in the 50th percentile by region
LEGEND
Europe
United States
% of founder equity
Europe
Europe
Europe
United States
United States
United States
31.5%
18.6%
13.0%
13.6%
32.6%
18.3%
12.8%
9.8%
Europe United States
Seed Funding Only
Post Series A
Post Series B
Post Series C
0.0
10.0
20.0
30.0
Founder base salary ($) by funding round in the 50th percentile by region
LEGEND
Base salary (Europe)
Base salary (United States) Incentive pay (Europe) Incentive pay (United States)
NOTE:
Note that at Seed stage some Founders may not take a base salary and take incentive pay instead.
Incentive pay is cash bonus or incentive, which is not related to equity or equity value. Converted EUR to USD with an FX rate of 1.1151 from 30 October 2019.
www.stateofeuropeantech.com
In Partnership with
&
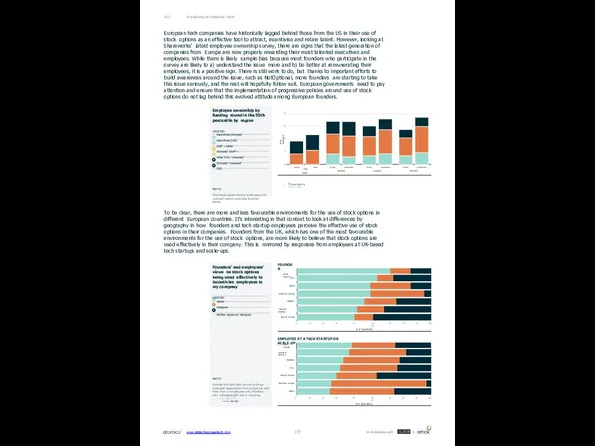
European tech companies have historically lagged behind those from the US
European tech companies have historically lagged behind those from the US
% of ownership
Europe
Europe
Europe
Europe United States
Seed
United States
Series A
United States
Series B
United States
Series C
0
5
10
15
20
Employee ownership by funding round in the 50th percentile by region
LEGEND
Executives (Europe) Executives (US)
Staff + other (Europe) Staff + other (US) Unissued (Europe) Unissued (US)
NOTE:
This details equity held by employees and unissued options excluding founders shares.
Incentivising and Retaining Talent
06.5
UK & Ireland
France & Benelux
Nordics
CEE
Rest of Europe
Southern Europe
DACH
0
10
20
30
40 50 60
% of respondents
70
80
90
100
CEE
DACH
Southern Europe
Nordics
France & Benelux
Rest of Europe
0
10
20
30
40 50 60
% of respondents
70
80
90
100
EMPLOYEE AT A TECH STARTUP OR SCALE-UP
FOUNDER
UK & Ireland
Founders' and employees' views on stock options being used effectively to incentivise employees in my company
LEGEND
Agree Disagree
Neither agree nor disagree
NOTE:
Founder and tech start-up and scale-up employee respondents from companies with more than 11 employees only. Numbers may not add to 100 due to rounding.
To be clear, there are more and less favourable environments for the use of stock options in different European countries. It's interesting in that context to look at differences by geography in how founders and tech startup employees perceive the effective use of stock options in their companies. Founders from the UK, which has one of the most favourable environments for the use of stock options, are more likely to believe that stock options are used effectively in their company. This is mirrored by responses from employees at UK-based tech startups and scale-ups.
www.stateofeuropeantech.com
In Partnership with
&
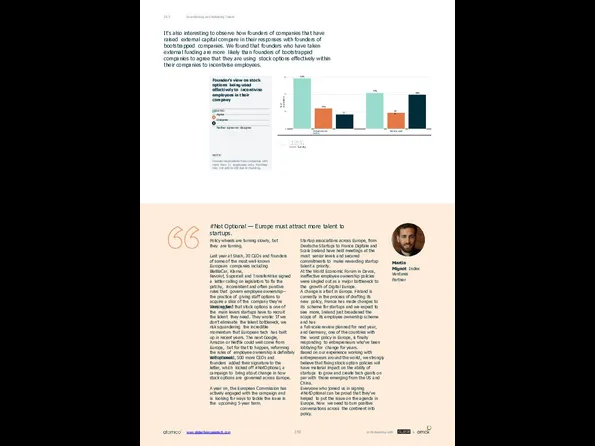
It's also interesting to observe how founders of companies that have
It's also interesting to observe how founders of companies that have
% of respondents
59%
42%
24%
19%
17%
40%
Raised external capital
Bootstrapped
0
20
40
60
Founder's view on stock options being used effectively to incentivise employees in their company
LEGEND
Agree Disagree
Neither agree nor disagree
NOTE:
Founder respondents from companies with more than 11 employees only. Numbers may not add to 100 due to rounding.
Incentivising and Retaining Talent
06.5
#Not Optional — Europe must attract more talent to startups.
Policy wheels are turning slowly, but they are turning.
Last year at Slush, 30 CEOs and founders of some of the most well-known European companies including BlaBlaCar, Klarna,
Revolut, Supercell and TransferWise signed a letter calling on legislators 'to fix the patchy, inconsistent and often punitive rules that govern employee ownership— the practice of giving staff options to acquire a slice of the company they're working for.'
They argued that stock options is one of the main levers startups have to recruit the talent they need. They wrote: 'If we don’t eliminate the talent bottleneck, we risk squandering the incredible momentum that European tech has built up in recent years. The next Google,
Amazon or Netflix could well come from Europe, but for that to happen, reforming the rules of employee ownership is definitely not optional.'
Within weeks, 500 more CEOs and founders added their signature to the letter, which kicked off #NotOptional, a campaign to bring about change in how stock options are governed across Europe.
A year on, the European Commission has actively engaged with the campaign and is looking for ways to tackle the issue in the upcoming 5-year term.
Martin Mignot Index Ventures Partner
Startup associations across Europe, from Deutsche Startups to France Digitale and Scale Ireland have held meetings at the most senior levels and secured commitments to make rewarding startup talent a priority.
At the World Economic Forum in Davos, ineffective employee ownership policies were singled out as a major bottleneck to the growth of Digital Europe.
www.stateofeuropeantech.com
In Partnership with
&
A change is afoot in Europe. Finland is currently in the process of drafting its new policy, France has made changes to its scheme for startups and we expect to see more, Ireland just broadened the scope of its employee ownership scheme and has
a full-scale review planned for next year, and Germany, one of the countries with the worst policy in Europe, is finally responding to entrepreneurs who've been lobbying for change for years.
Based on our experience working with entrepreneurs around the world, we strongly believe that fixing stock option policies will have material impact on the ability of startups to grow and create tech giants on par with those emerging from the US and China.
Everyone who joined us in signing #NotOptional can be proud that they've helped to put the issue on the agenda in Europe. Now we need to turn positive conversations across the continent into policy.

In Partnership with
&
www.stateofeuropeantech.com
In Partnership with
&
www.stateofeuropeantech.com
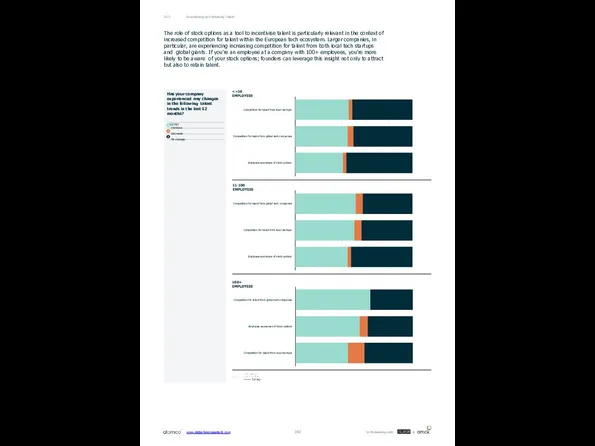
Competition for talent from local startups
Competition for talent from global tech
Competition for talent from local startups
Competition for talent from global tech
Employee awareness of stock options
The role of stock options as a tool to incentivise talent is particularly relevant in the context of increased competition for talent within the European tech ecosystem. Larger companies, in particular, are experiencing increasing competition for talent from both local tech startups and global giants. If you're an employee at a company with 100+ employees, you're more likely to be aware of your stock options; founders can leverage this insight not only to attract but also to retain talent.
Competition for talent from global tech companies
Competition for talent from local startups
Employee awareness of stock options
11-100 EMPLOYEES
Competition for talent from global tech companies
Employee awareness of stock options
Competition for talent from local startups
100+ EMPLOYEES
Has your company experienced any changes in the following talent trends in the last 12 months?
LEGEND
Increase Decrease No change
<=10 EMPLOYEES
Incentivising and Retaining Talent
06.5
www.stateofeuropeantech.com
In Partnership with
&
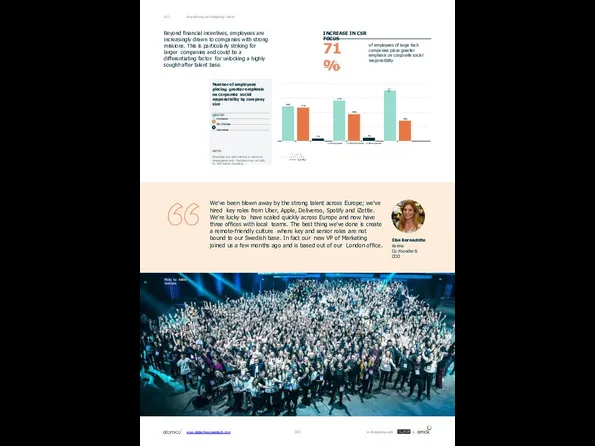
Beyond financial incentives, employees are increasingly drawn to companies with strong
Beyond financial incentives, employees are increasingly drawn to companies with strong
49%
57%
71%
47%
38%
29%
4%
5%
<10 employees 11-100 employees >100 employees
Number of employees placing greater emphasis on corporate social responsibility by company size
LEGEND
Increase No change Decrease
NOTE:
Employee at a tech startup or scale-up respondents only. Numbers may not add to 100 due to rounding.
We've been blown away by the strong talent across Europe; we've hired key roles from Uber, Apple, Deliveroo, Spotify and iZettle. We're lucky to have scaled quickly across Europe and now have three offices with local teams. The best thing we've done is create a remote-friendly culture where key and senior roles are not bound to our Swedish base. In fact our new VP of Marketing joined us a few months ago and is based out of our London office.
Elsa Bernadotte
Karma
Co-Founder & COO
Incentivising and Retaining Talent
06.5
of employees of large tech companies place greater emphasis on corporate social responsibility
INCREASE IN CSR FOCUS
71%
Photo by: Riikka Vaahtera
www.stateofeuropeantech.com
In Partnership with
&
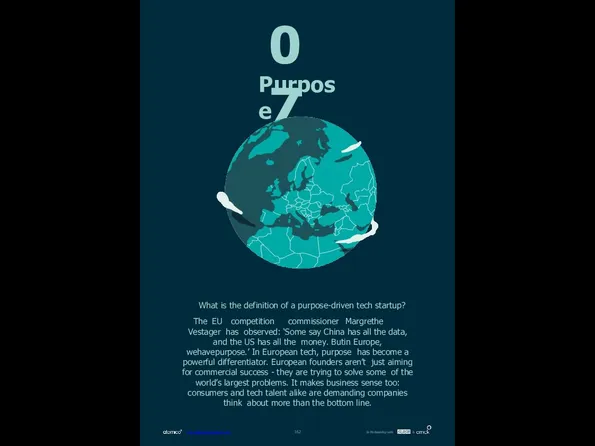
07
Purpose
What is the definition of a purpose-driven tech startup?
The EU competition commissioner Margrethe Vestager has observed: ‘Some
07
Purpose
What is the definition of a purpose-driven tech startup?
The EU competition commissioner Margrethe Vestager has observed: ‘Some
www.stateofeuropeantech.com
In Partnership with
&
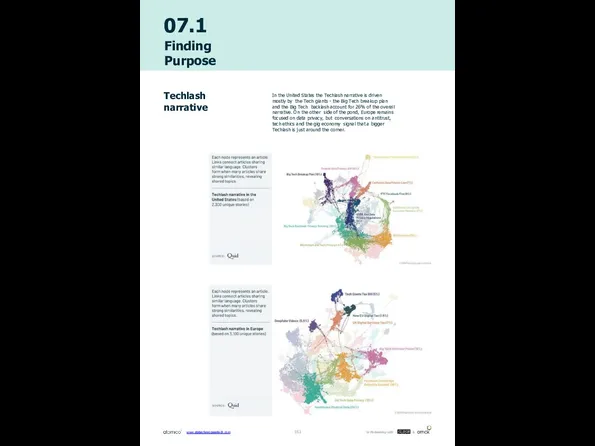
07.1
Finding Purpose
Techlash narrative
In the United States the Techlash narrative is driven
07.1
Finding Purpose
Techlash narrative
In the United States the Techlash narrative is driven
www.stateofeuropeantech.com
In Partnership with
&
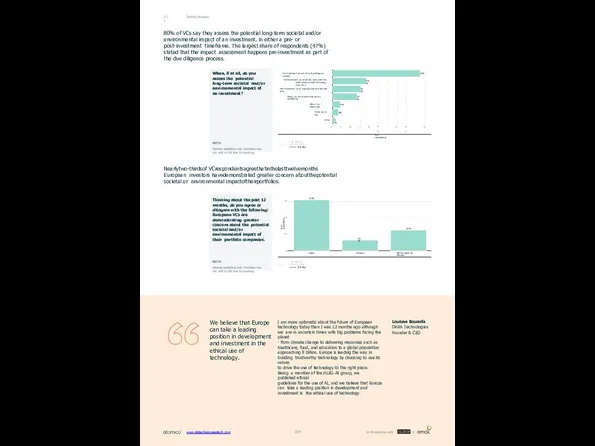
Finding Purpose
07.1
80% of VCs say they assess the potential long-term societal
Finding Purpose
07.1
80% of VCs say they assess the potential long-term societal
Nearlytwo-thirdsof VCrespondentsagreethatinthelasttwelvemonths European investors havedemonstrated greater concern aboutthepotential societal or environmental impactoftheirportfolios.
% of respondents
62%
13%
25%
Agree
Disagree
Neither agree nor disagree
0
20
40
60
Thinking about the past 12 months, do you agree or disagree with the following: European VCs are demonstrating greater concern about the potential societal and/or environmental impact of their portfolio companies.
NOTE:
Venture capitalists only. Numbers may not add to 100 due to rounding.
47%
18%
15%
13%
4%
3%
1%
Pre-investment, as part of the due diligence process
Post-investment, on an ad-hoc basis when the need arises (change of strategy, pivot, etc..)
Post-investment, on an ongoing basis with defined KPIs
Never, but this is something we are considering
Never, not meaningful
Prefer not to say
Other
0
5
10
15
20
25 30
% of respondents
35
40 45
50
When, if at all, do you assess the potential long-term societal and/or environmental impact of an investment?
NOTE:
Venture capitalists only. Numbers may not add to 100 due to rounding.
We believe that Europe can take a leading position in development and investment in the ethical use of technology.
I am more optimistic about the future of European technology today than I was 12 months ago although we are in uncertain times with big problems facing the planet
- from climate change to delivering resources such as healthcare, food, and education to a global population approaching 8 billion. Europe is leading the way in building trustworthy technology by choosing to use its values
to drive the use of technology to the right place. Being a member of the HLEG-AI group, we published ethical
guidelines for the use of AI, and we believe that Europe can take a leading position in development and investment in the ethical use of technology.
Loubna Bouarfa OKRA Technologies Founder & CEO
www.stateofeuropeantech.com
In Partnership with
&
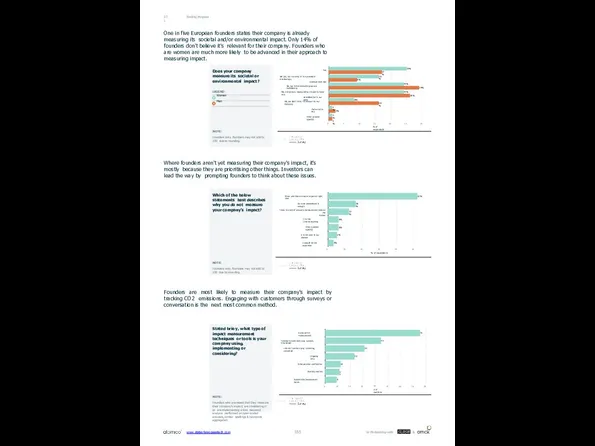
Finding Purpose
07.1
One in five European founders states their company is already
Finding Purpose
07.1
One in five European founders states their company is already
Where founders aren't yet measuring their company's impact, it's mostly because they are prioritising other things. Investors can lead the way by prompting founders to think about these issues.
25%
16%
24%
24%
8%
1%
17%
9%
29%
26%
16%
2%
1%
1%
Yes
Not yet, but currently in the process of introducing a
measurement tool
No, but this is something we are considering
No, not actively measured but impact is taken into
consideration in our work
No, we don't think it's relevant for our company
Prefer not to say
Other (please specify)
0
5
10
15
% of respondents
20
25
30
52%
16%
12%
6%
6%
5%
3%
Other priorities are more important right now
Our own assessment is enough
There is a lack of accurate measurement tools on the
market
It is too time-consuming
Other (please specify)
It is not core to our mission
It would be too expensive
0
10
20
30
% of respondents
40
50
Does your company measure its societal or environmental impact?
LEGEND
Women Men
NOTE:
Founders only. Numbers may not add to 100 due to rounding.
Which of the below statements best describes why you do not measure your company’s impact?
NOTE:
Founders only. Numbers may not add to 100 due to rounding.
Founders are most likely to measure their company's impact by tracking CO2 emissions. Engaging with customers through surveys or conversation is the next most common method.
75
www.stateofeuropeantech.com
In Partnership with
&
44
31
23
12
11
9
Carbon/CO2 measurement
Talking to customers (e.g. surveys, interviews)
Internal functions (e.g. travelling, recycling)
Ongoing KPIs
B-Corporation certification
Diversity metrics
Sustainable Development Goals
0
10
20
30
40
# of mentions
50
60
70
80
Stated brie y, what type of impact measurement techniques or tools is your company using, implementing or considering?
NOTE:
Founders who answered that they measure their company's impact, are considering it or are implementing a tool. Keyword analysis performed on open-ended answers, similar spellings & keywords aggregated.
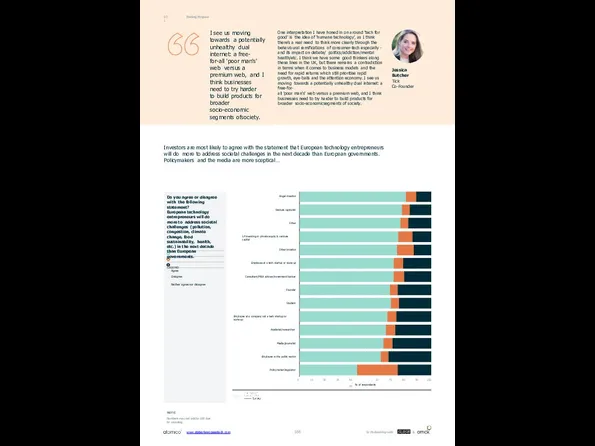
Finding Purpose
07.1
I see us moving towards a potentially unhealthy dual internet:
Finding Purpose
07.1
I see us moving towards a potentially unhealthy dual internet:
to build products for broader socio-economic segments ofsociety.
One interpretation I have honed in on around 'tech for good' is the idea of 'humane technology', as I think there's a real need to think more clearly through the behavioural ramifications of consumer-tech especially - and its impact on debate/ politics/addiction/mental health/etc. I think we have some good thinkers along these lines in the UK, but there remains a contradiction in terms when it comes to business models and the need for rapid returns which still prioritise rapid
growth, eye-balls and the attention economy. I see us moving towards a potentially unhealthy dual internet: a free-for-
all 'poor man's' web versus a premium web, and I think businesses need to try harder to build products for broader socio-economicsegments of society.
Jessica Butcher
Tick
Co-Founder
Do you agree or disagree with the following statement?
European technology entrepreneurs will do more to address societal challenges (pollution, congestion, climate change, food sustainability, health, etc.) in the next decade than European governments.
LEGEND
Agree Disagree
Neither agree nor disagree
NOTE:
Numbers may not add to 100 due to rounding.
% of respondents
Angel investor
Venture capitalist
Other
LP investing in private equity & venture capital
Other investor
Employee at a tech startup or scale-up
Consultant/M&A advisor/investment banker
Founder
Student
Employee at a company not a tech startup or scale-up
Academic/researcher
Media/journalist
Employee in the public sector
Policymaker/regulator
0
10
20
30
40 50
60
70
80
90
100
Investors are most likely to agree with the statement that European technology entrepreneurs will do more to address societal challenges in the next decade than European governments. Policymakers and the media are more sceptical…
www.stateofeuropeantech.com
In Partnership with
&
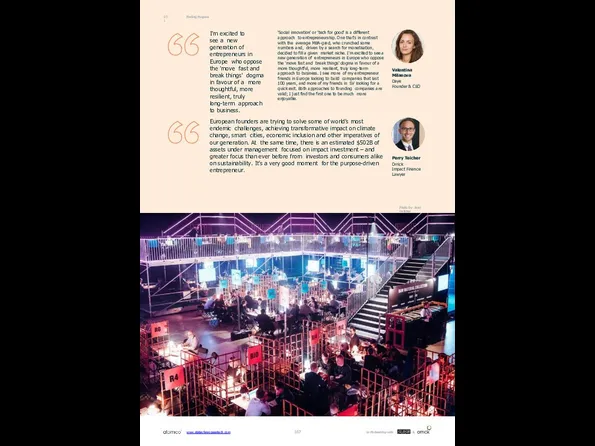
Finding Purpose
07.1
I'm excited to see a new generation of
entrepreneurs in Europe
Finding Purpose
07.1
I'm excited to see a new generation of
entrepreneurs in Europe
'Social innovation' or 'tech for good' is a different approach to entrepreneurship. One that's in contrast with the average MBA-grad, who crunched some numbers and, driven by a search for monetisation, decided to fill a given market niche. I'm excited to see a new generation of entrepreneurs in Europe who oppose the 'move fast and break things' dogma in favour of a more thoughtful, more resilient, truly long-term approach to business. I see more of my entrepreneur friends in Europe looking to build companies that last 100 years, and more of my friends in SV looking for a quick exit. Both approaches to founding companies are valid; I just find the first one to be much more enjoyable.
Valentina Milanova
Daye
Founder & CEO
European founders are trying to solve some of world’s most endemic challenges, achieving transformative impact on climate change, smart cities, economic inclusion and other imperatives of our generation. At the same time, there is an estimated $502B of assets under management focused on impact investment – and greater focus than ever before from investors and consumers alike on sustainability. It’s a very good moment for the purpose-driven entrepreneur.
Perry Teicher
Orrick
Impact Finance Lawyer
Photo by: Jussi Hellsten
www.stateofeuropeantech.com
In Partnership with
&
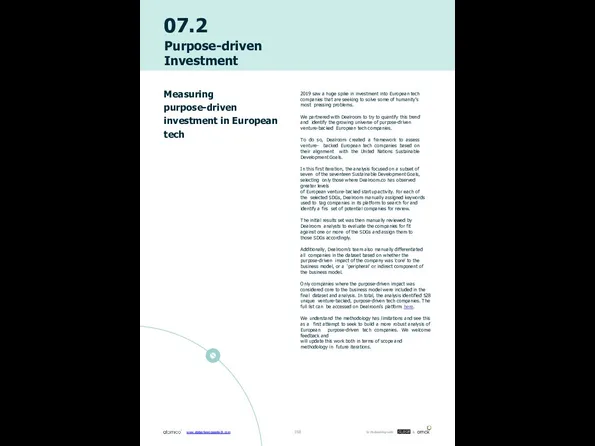
07.2
Purpose-driven Investment
Measuring purpose-driven investment in European tech
2019 saw a huge spike
07.2
Purpose-driven Investment
Measuring purpose-driven investment in European tech
2019 saw a huge spike
We partnered with Dealroom to try to quantify this trend and identify the growing universe of purpose-driven venture-backed European tech companies.
To do so, Dealroom created a framework to assess venture- backed European tech companies based on their alignment with the United Nations Sustainable Development Goals.
In this first iteration, the analysis focused on a subset of seven of the seventeen Sustainable Development Goals, selecting only those where Dealroom.co has observed greater levels
of European venture-backed startup activity. For each of the selected SDGs, Dealroom manually assigned keywords used to tag companies in its platform to search for and identify a firs set of potential companies for review.
The initial results set was then manually reviewed by Dealroom analysts to evaluate the companies for fit against one or more of the SDGs and assign them to those SDGs accordingly.
Additionally, Dealroom's team also manually differentiated all companies in the dataset based on whether the purpose-driven impact of the company was ‘core’ to the business model, or a ‘peripheral’ or indirect component of the business model.
Only companies where the purpose-driven impact was considered core to the business model were included in the final dataset and analysis. In total, the analysis identified 528 unique venture-backed, purpose-driven tech companies. The full list can be accessed on Dealroom's platform here.
We understand the methodology has limitations and see this as a first attempt to seek to build a more robust analysis of European purpose-driven tech companies. We welcome feedback and
will update this work both in terms of scope and methodology in future iterations.
www.stateofeuropeantech.com
In Partnership with
&
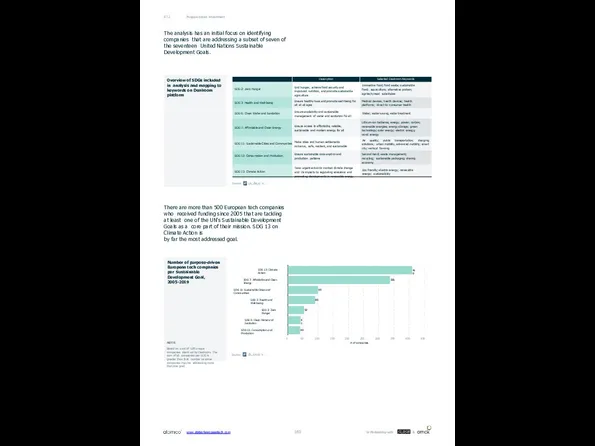
Purpose-driven Investment
07.2
Overview of SDGs included in analysis and mapping to keywords
Purpose-driven Investment
07.2
Overview of SDGs included in analysis and mapping to keywords
The analysis has an initial focus on identifying companies that are addressing a subset of seven of the seventeen United Nations Sustainable Development Goals.
There are more than 500 European tech companies who received funding since 2005 that are tackling at least one of the UN's Sustainable Development Goals as a core part of their mission. SDG 13 on Climate Action is
by far the most addressed goal.
410
336
99
89
53
41
40
SDG 13: Climate Action
SDG 7: Affordable and Clean Energy
SDG 11: Sustainable Cities and Communities
SDG 3: Health and Well-being
SDG 2: Zero Hunger
SDG 6: Clean Water and Sanitation
SDG 12: Consumption and Production
0
50
100
150
200
250
# of companies
300
350
400
450
Number of purpose-driven European tech companies per Sustainable Development Goal, 2005-2019
NOTE:
Based on a set of 528 unique companies identi ed by Dealroom. The sum of all companies per SDG is greater than that number as some companies may be addressing more than one goal.
www.stateofeuropeantech.com
In Partnership with
&
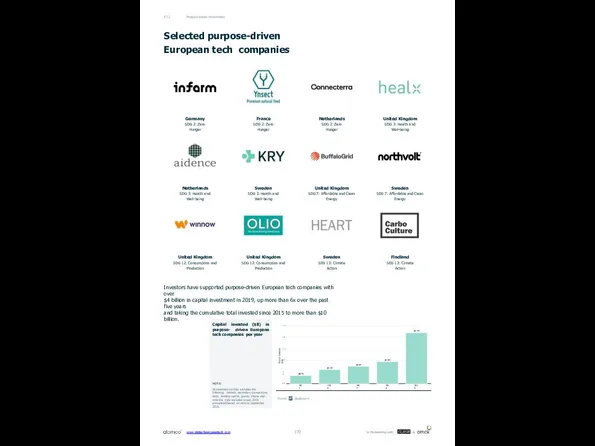
Purpose-driven Investment
07.2
Germany
SDG 2: Zero Hunger
Netherlands
SDG 3: Health and Well-being
United Kingdom
SDG 12:
Purpose-driven Investment
07.2
Germany
SDG 2: Zero Hunger
Netherlands
SDG 3: Health and Well-being
United Kingdom
SDG 12:
Netherlands
SDG 2: Zero Hunger
United Kingdom
SDG 7: Affordable and Clean Energy
Sweden
SDG 13: Climate Action
France
SDG 2: Zero Hunger
Sweden
SDG 3: Health and Well-being
United Kingdom
SDG 12: Consumption and Production
United Kingdom
SDG 3: Health and Well-being
Sweden
SDG 7: Affordable and Clean Energy
Findland
SDG 13: Climate Action
Selected purpose-driven European tech companies
Investors have supported purpose-driven European tech companies with over
$4 billion in capital investment in 2019, up more than 6x over the past five years
and taking the cumulative total invested since 2015 to more than $10 billion.
Capital invested ($B)
$0.7B
$1.2B
$1.5B
$1.9B
$4.4B
2015
2016
2017
2018
2019
0.0
1.0
2.0
3.0
4.0
5.0
Capital invested ($B) in purpose- driven European tech companies per year
NOTE:
All Dealroom.co data excludes the following: biotech, secondary transactions, debt, lending capital, grants. Please also note the data excludes Israel. 2019 annualised based on data to September 2019.
www.stateofeuropeantech.com
In Partnership with
&

In Partnership with
&
www.stateofeuropeantech.com
In Partnership with
&
www.stateofeuropeantech.com
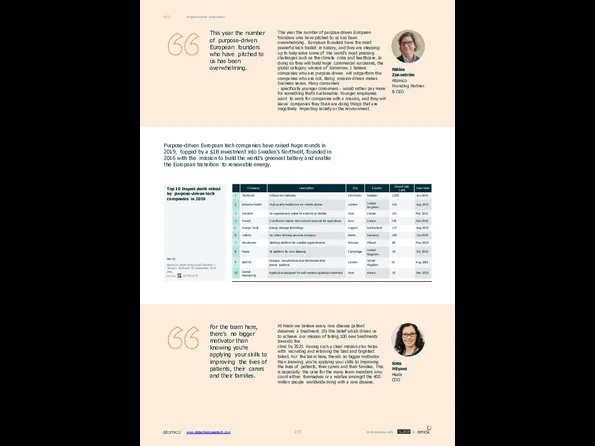
Purpose-driven Investment
07.2
This year the number of purpose-driven European founders who have
Purpose-driven Investment
07.2
This year the number of purpose-driven European founders who have
This year the number of purpose-driven European founders who have pitched to us has been overwhelming. European founders have the most powerful tech toolkit in history, and they are stepping up to help solve some of the world's most pressing challenges such as the climate crisis and healthcare. In doing so they will build huge commercial successes, the global category winners of tomorrow. I believe companies who are purpose driven will outperform the companies who are not. Being mission-driven makes business sense. Many consumers
- specifically younger consumers - would rather pay more for something that's sustainable. Younger employees want to work for companies with a mission, and they will leave companies they think are doing things that are negatively impacting society or the environment.
Niklas Zennström Atomico Founding Partner & CEO
Purpose-driven European tech companies have raised huge rounds in 2019, topped by a $1B investment into Sweden's Northvolt, founded in 2016 with the mission to build the world's greenest battery and enable the European transition to renewable energy.
Top 10 largest deals raised by purpose-driven tech companies in 2019
NOTE:
Based on deals announced between 1 January 2019 and 30 September 2019 only.
For the team here, there's no bigger motivator than knowing you’re applying your skills to improving the lives of patients, their carers and their families.
At Healx we believe every rare disease patient deserves a treatment. It's this belief which drives us to achieve our mission of taking 100 new treatments towards the
clinic by 2025. Having such a clear mission also helps with recruiting and retaining the best and brightest talent. For the team here, there's no bigger motivator than knowing you're applying your skills to improving the lives of patients, their carers and their families. This is especially the case for the many team members who count either themselves or a relative amongst the 400 million people worldwide living with a rare disease.
Kate Hilyard
Healx COO
www.stateofeuropeantech.com
In Partnership with
&
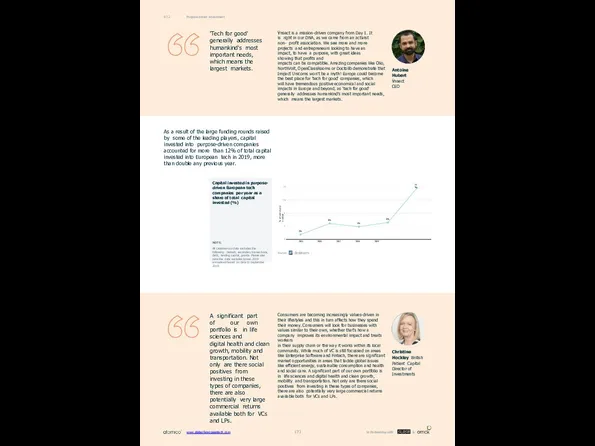
Purpose-driven Investment
07.2
'Tech for good' generally addresses humankind's most important needs, which
Purpose-driven Investment
07.2
'Tech for good' generally addresses humankind's most important needs, which
Ÿnsect is a mission-driven company from Day 1. It is right in our DNA, as we came from an activist non- profit association. We see more and more projects and entrepreneurs looking to have an impact, to have a purpose, with great ideas showing that profits and
impacts can be compatible. Amazing companies like Olio, NorthVolt, OpenClassRooms or Doctolib demonstrate that Impact Unicorns won’t be a myth! Europe could become the best place for 'tech for good' companies, which
will have tremendous positive economical and social impacts in Europe and beyond, as 'tech for good' generally addresses humankind's most important needs, which means the largest markets.
Antoine Hubert
Ÿnsect CEO
As a result of the large funding rounds raised by some of the leading players, capital invested into purpose-driven companies accounted for more than 12% of total capital invested into European tech in 2019, more than double any previous year.
% of total capital invested
3%
6%
5%
6%
12%
2015 2016 2017 2018 2019
3
5
8
10
13
Capital invested in purpose- driven European tech companies per year as a share of total capital invested (%)
NOTE:
All Dealroom.co data excludes the following: biotech, secondary transactions, debt, lending capital, grants. Please also note the data excludes Israel. 2019 annualised based on data to September 2019.
A significant part of our own portfolio is in life sciences and
digital health and clean growth, mobility and transportation. Not only are there social positives from investing in these types of companies, there are also potentially very large commercial returns available both for VCs and LPs.
Consumers are becoming increasingly values-driven in their lifestyles and this in turn affects how they spend their money. Consumers will look for businesses with values similar to their own, whether that's how a company improves its environmental impact and treats workers
in their supply chain or the way it works within its local community. While much of VC is still focussed on areas like Enterprise Software and Fintech, there are significant market opportunities in areas that tackle global issues like efficient energy, sustainable consumption and health and social care. A significant part of our own portfolio is in life sciences and digital health and clean growth, mobility and transportation. Not only are there social positives from investing in these types of companies, there are also potentially very large commercial returns available both for VCs and LPs.
Christine Hockley British Patient Capital
Director of Investments
www.stateofeuropeantech.com
In Partnership with
&
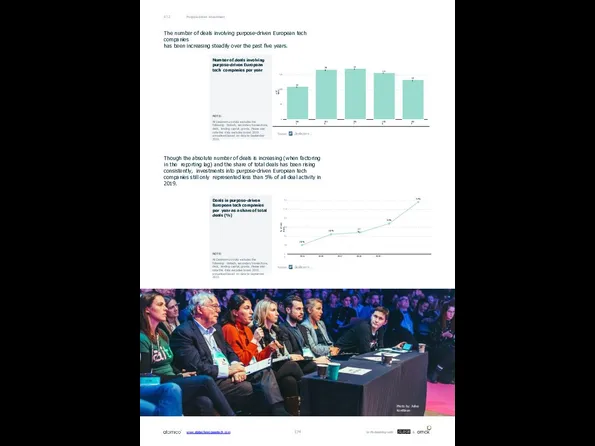
Purpose-driven Investment
07.2
The number of deals involving purpose-driven European tech companies
has been
Purpose-driven Investment
07.2
The number of deals involving purpose-driven European tech companies
has been
Though the absolute number of deals is increasing (when factoring in the reporting lag) and the share of total deals has been rising consistently, investments into purpose-driven European tech companies still only represented less than 5% of all deal activity in 2019.
# of deals
111
168
171
157
133
2015
2016
2017
2018
2019
0
50
100
150
Number of deals involving purpose-driven European tech companies per year
NOTE:
All Dealroom.co data excludes the following: biotech, secondary transactions, debt, lending capital, grants. Please also note the data excludes Israel. 2019 annualised based on data to September 2019.
% of total deals
2.0%
2.6%
2.7%
3.2%
4.4%
2015 2016 2017 2018 2019
1.5
2.0
2.5
3.0
3.5
4.0
4.5
Deals in purpose-driven European tech companies per year as a share of total deals (%)
NOTE:
All Dealroom.co data excludes the following: biotech, secondary transactions, debt, lending capital, grants. Please also note the data excludes Israel. 2019 annualised based on data to September 2019.
Photo by: Julius Konttinen
www.stateofeuropeantech.com
In Partnership with
&
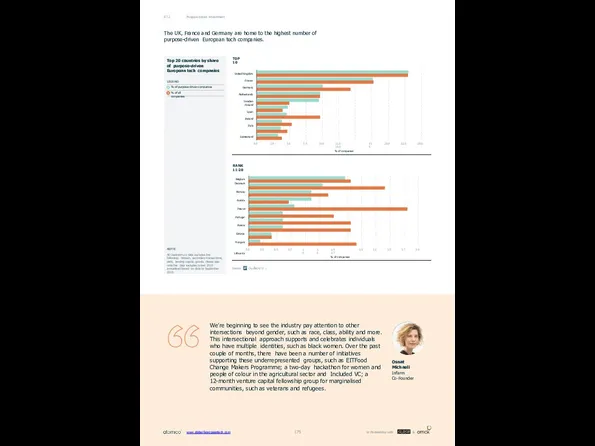
Purpose-driven Investment
07.2
Belgium
Denmark Norway
Austria Poland
Portugal Russia
Estonia Hungary
Lithuania
0.0
0.2
0.5
0.7
1.0
1.2
1.5 1.7
% of companies
2.0
2.2
2.5
2.7
3.0
Top 20 countries by
Purpose-driven Investment
07.2
Belgium
Denmark Norway
Austria Poland
Portugal Russia
Estonia Hungary
Lithuania
0.0
0.2
0.5
0.7
1.0
1.2
1.5 1.7
% of companies
2.0
2.2
2.5
2.7
3.0
Top 20 countries by
LEGEND
% of purpose-driven companies
% of all companies
United Kingdom
France
Germany
Netherlands
Sweden
Finland Spain Ireland Italy
Switzerland
0.0
2.5
5.0
7.5
10.0
12.5 15.0
% of companies
17.5
20.0
22.5
25.0
RANK 11-20
TOP 10
NOTE:
All Dealroom.co data excludes the following: biotech, secondary transactions, debt, lending capital, grants. Please also note the data excludes Israel. 2019 annualised based on data to September 2019.
The UK, France and Germany are home to the highest number of purpose-driven European tech companies.
We’re beginning to see the industry pay attention to other intersections beyond gender, such as race, class, ability and more. This intersectional approach supports and celebrates individuals who have multiple identities, such as black women. Over the past couple of months, there have been a number of initiatives supporting these underrepresented groups, such as EITFood Change Makers Programme; a two-day hackathon for women and people of colour in the agricultural sector and Included VC; a 12-month venture capital fellowship group for marginalised communities, such as veterans and refugees.
Osnat Michaeli
Infarm
Co-Founder
www.stateofeuropeantech.com
In Partnership with
&
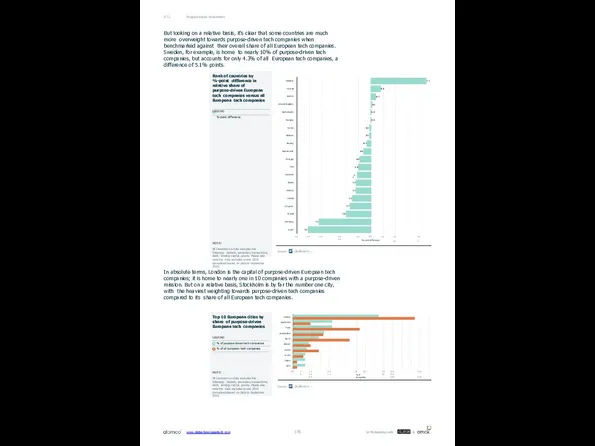
Rank of countries by %-point difference in relative share of purpose-driven
Rank of countries by %-point difference in relative share of purpose-driven
LEGEND
%-point difference
NOTE:
All Dealroom.co data excludes the following: biotech, secondary transactions, debt, lending capital, grants. Please also note the data excludes Israel. 2019 annualised based on data to September 2019.
4.5
0.8
0.4
0.1
0.0
0.0
-0.1
-0.1
-0.3
-0.6
-0.9
-1.0
-1.1
-1.2
-1.2
-1.5
-1.7
-2.0
-4.2
-5.1
Sweden
Finland
Austria
United Kingdom
Netherlands
Hungary
France
Belgium
Norway
Switzerland
Portugal
Italy
Denmark
Russia
Estonia
Ireland
Lithuania
Poland
Germany
Spain
-6.0
-5.0
-4.0 -3.0 -2.0
-1.0
0.0
%-point difference
1.0
2.0 3.0
4.0 5
But looking on a relative basis, it's clear that some countries are much more overweight towards purpose-driven tech companies when benchmarked against their overall share of all European tech companies. Sweden, for example, is home to nearly 10% of purpose-driven tech companies, but accounts for only 4.3% of all European tech companies, a difference of 5.1% points.
In absolute terms, London is the capital of purpose-driven European tech companies; it is home to nearly one in 10 companies with a purpose-driven mission. But on a relative basis, Stockholm is by far the number one city, with the heaviest weighting towards purpose-driven tech companies compared to its share of all European tech companies.
% of companies
London
Stockholm
Paris
Amsterdam
Berlin
Helsinki
Dublin
Zurich
Espoo
Delft
0.0
1.0
2.0 3.0 4.0 5.0 6.0
7.0
8.0 9.0 10.0
11.0 12.0 13.0
14.0 15.0
Top 10 European cities by share of purpose-driven European tech companies
LEGEND
% of purpose-driven tech companies
% of all European tech companies
NOTE:
All Dealroom.co data excludes the following: biotech, secondary transactions, debt, lending capital, grants. Please also note the data excludes Israel. 2019 annualised based on data to September 2019.
Purpose-driven Investment
07.2
www.stateofeuropeantech.com
In Partnership with
&
08
Places
What are the best hubs for European tech?
Cluj-Napoca, Romania, Delft, the
08
Places
What are the best hubs for European tech?
Cluj-Napoca, Romania, Delft, the
www.stateofeuropeantech.com
In Partnership with
&
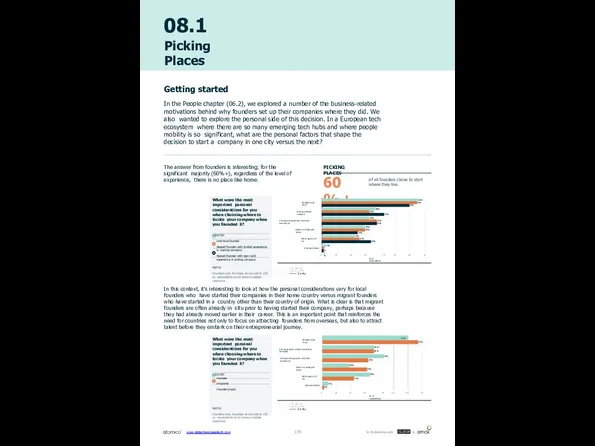
08.1
Picking Places
The answer from founders is interesting; for the significant majority
08.1
Picking Places
The answer from founders is interesting; for the significant majority
of all founders chose to start where they live.
PICKING PLACES
60%+
65%
36%
32%
22%
3%
64%
32%
37%
29%
29%
25%
59%
42%
37%
24%
33%
1%
1%
Already living there
Strong personal network
Strong and supportive local tech community
Close to friends and family
Better quality of life
Visa restrictions
0
10
20
30 40
% of respondents
50
60
70
What were the most important personal considerations for you when choosing where to locate your company when you founded it?
LEGEND
First-time founder
Repeat founder with limited experience in scaling company
Repeat founder with signi cant experience in scaling company
NOTE:
Founders only. Numbers do not add to 100 as respondents could choose multiple responses.
Getting started
In the People chapter (06.2), we explored a number of the business-related motivations behind why founders set up their companies where they did. We also wanted to explore the personal side of this decision. In a European tech ecosystem where there are so many emerging tech hubs and where people mobility is so significant, what are the personal factors that shape the decision to start a company in one city versus the next?
In this context, it's interesting to look at how the personal considerations vary for local founders who have started their companies in their home country versus migrant founders who have started in a country other than their country of origin. What is clear is that migrant founders are often already in situ prior to having started their company, perhaps because they had already moved earlier in their career. This is an important point that reinforces the need for countries not only to focus on attracting founders from overseas, but also to attract talent before they embark on their entrepreneurial journey.
67%
Already living there
Strong personal network (mentors, contacts)
Strong and supportive local tech community
Close to friends and family
Better quality of life
Visa restrictions
0
10
20
30 40
% of respondents
50
60
70
What were the most important personal considerations for you when choosing where to locate your company when you founded it?
LEGEND
Founder (migrant) Founder (local)
NOTE:
Founders only. Numbers do not add to 100 as respondents could choose multiple responses.
www.stateofeuropeantech.com
In Partnership with
&
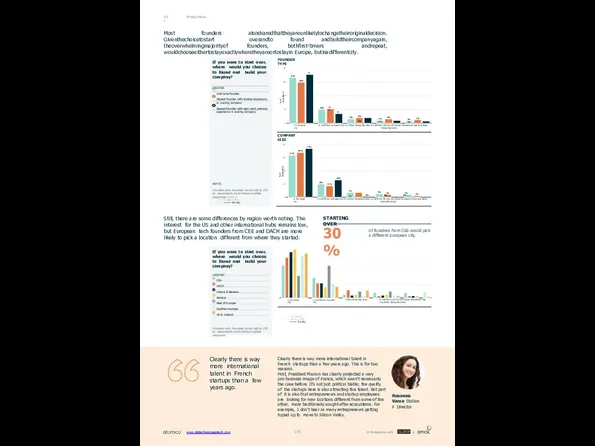
Picking Places
08.1
Most founders alsosharedthattheyareunlikelytochangetheiroriginaldecision. Giventhechoicetostart overandto found andbuildtheircompanyagain, theoverwhelmingmajorityof founders, bothfirst-timers
Picking Places
08.1
Most founders alsosharedthattheyareunlikelytochangetheiroriginaldecision. Giventhechoicetostart overandto found andbuildtheircompanyagain, theoverwhelmingmajorityof founders, bothfirst-timers
% of respondents
64%
20%
5%
68%
17%
7% 7%
4% 4%
2%
74%
26%
0% 0% 0%
In the same city
In a different European city In a Silicon Valley/Bay Area In a different US city (not Silicon Somewhere else (e.g. Asia)
Valley/Bay Area)
0
20
40
60
80
% of respondents
67%
20%
6%
60%
21%
6%
5%
71%
14%
8% 8%
4% 4%
3% 3%
In the same city
In a different European city In a Silicon Valley/Bay Area In a different US city (not Silicon Somewhere else (e.g. Asia)
Valley/Bay Area)
0
20
40
60
80
COMPANY SIZE
FOUNDER TYPE
If you were to start over, where would you choose to found and build your company?
LEGEND
First-time founder
Repeat founder with limited experience in scaling company
Repeat founder with signi cant previous experience in scaling company
NOTE:
Founders only. Numbers do not add to 100 as respondents could choose multiple responses.
Still, there are some differences by region worth noting. The interest for the US and other international hubs remains low, but European tech founders from CEE and DACH are more likely to pick a location different from where they started.
of founders from CEE would pick a different European city.
STARTING OVER
30%
In the same city
In a different European city
Silicon Valley/Bay Area In a different US city (not Silicon Somewhere else (e.g. Asia) Valley/Bay Area)
Clearly there is way more international talent in French startups than a few years ago.
Clearly there is way more international talent in French startups than a few years ago. This is for two reasons.
First, President Macron has clearly projected a very
pro-business image of France, which wasn't necessarily the case before. It's not just political blabla; the quality of the startups here is also attracting this talent. But part of it is also that entrepreneurs and startup employees are looking for new locations different from some of the other, more traditionally sought-after ecosystems. For example, I don't hear as many entrepreneurs getting hyped up to move to Silicon Valley.
Roxanne Varza Station F Director
If you were to start over, where would you choose to found and build your company?
LEGEND CEE DACH
France & Benelux Nordics
Rest of Europe Southern Europe UK & Ireland
Founders only. Numbers do not add to 100 as respondents could choose multiple responses.
www.stateofeuropeantech.com
In Partnership with
&
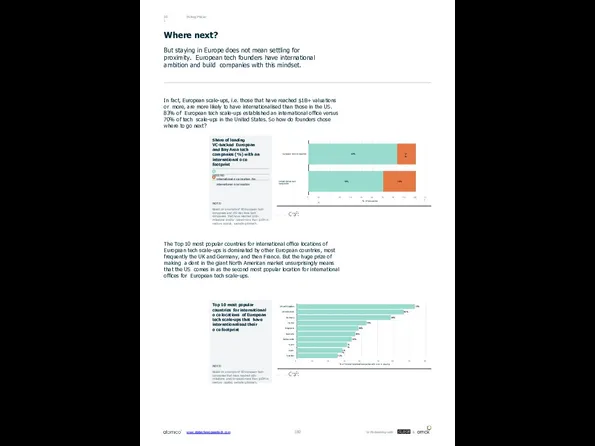
Picking Places
08.1
In fact, European scale-ups, i.e. those that have reached $1B+
Picking Places
08.1
In fact, European scale-ups, i.e. those that have reached $1B+
The Top 10 most popular countries for international office locations of European tech scale-ups is dominated by other European countries, most frequently the UK and Germany, and then France. But the huge prize of making a dent in the giant North American market unsurprisingly means that the US comes in as the second most popular location for international offices for European tech scale-ups.
83%
70%
17%
30%
European tech companies
United States tech companies
0
10 20
30
40
50
60
% of companies
70
80
90
100
110
73%
66%
58%
43%
38%
36%
34%
31%
28%
25%
United Kingdom
United States
Germany
France
Singapore
Australia
Netherlands
Spain
Japan
Sweden
0
10
20
30 40 50
% of internationalised companies with o ce in country
60
70
80
Share of leading VC-backed European and Bay Area tech companies (%) with an international o ce footprint
LEGEND
International o ce location No international o ce location
NOTE:
Based on a sample of 80 European tech companies and 182 Bay Area tech companies that have reached $1B+ milestone and/or raised more than $50M in venture capital, excluding Biotech.
Top 10 most popular countries for international o ce locations of European tech scale-ups that have internationalised their
o ce footprint
NOTE:
Based on a sample of 80 European tech companies that have reached $B+ milestone and/or raised more than $50M in venture capital, excluding Biotech.
Where next?
But staying in Europe does not mean settling for proximity. European tech founders have international ambition and build companies with this mindset.
www.stateofeuropeantech.com
In Partnership with
&
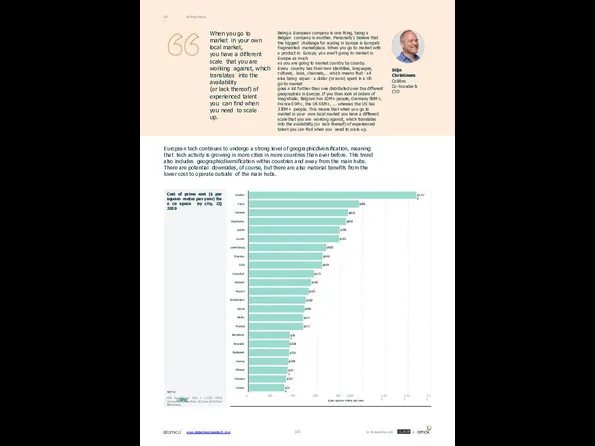
Picking Places
08.1
When you go to market in your own local market,
you
Picking Places
08.1
When you go to market in your own local market,
you
(or lack thereof) of experienced talent you can find when you need to scale up.
Being a European company is one thing, being a Belgian company is another. Personally I believe that the biggest challenge for scaling in Europe is Europe's fragmented marketplace. When you go to market with a product in Europe, you aren't going to market in Europe as much
as you are going to market country by country. Every country has their own identities, languages, cultures, laws, channels,… which means that - all else being equal - a dollar (or euro) spent in a US go-to-market
goes a lot further than one distributed over the different geographies in Europe. If you then look at orders of magnitude, Belgium has 10M+ people, Germany 80M+, France 65M+, the UK 66M+, ... whereas the US has 330M+ people. This means that when you go to market in your own local market you have a different scale that you are working against, which translates into the availability (or lack thereof) of experienced talent you can find when you need to scale up.
Stijn Christiaens
Collibra
Co-Founder & CTO
Cost of prime rent ($ per square metre per year) for o ce space by city, 2Q 2019
NOTE:
EUR to USD (1 EUR = 1.1367 USD) conversion taken from 30 June 2019 from Bloomberg.
$1,470
$966
$870
$850
$796
$793
$682
$649
$644
$573
$546
$525
$500
$489
$477
$477
$361
$358
$355
$348
$341
$327
$314
London
Paris
Geneva
Stockholm
Dublin
Zurich
uxembourg
Moscow
Oslo
Frankfurt
Helsinki
Munich
Amsterdam
Rome
Berlin
Madrid
Barcelona
Brussels
Budapest
Vienna
Athens
Warsaw
Lisbon
0
200
400
600
800 1,000
$ per square metre per year
1,200
1,400
1,60
European tech continues to undergo a strong level of geographicdiversification, meaning that tech activity is growing in more cities in more countries than ever before. This trend also includes geographicdiversification within countries and away from the main hubs. There are potential downsides, of course, but there are also material benefits from the lower cost to operate outside of the main hubs.
www.stateofeuropeantech.com
In Partnership with
&
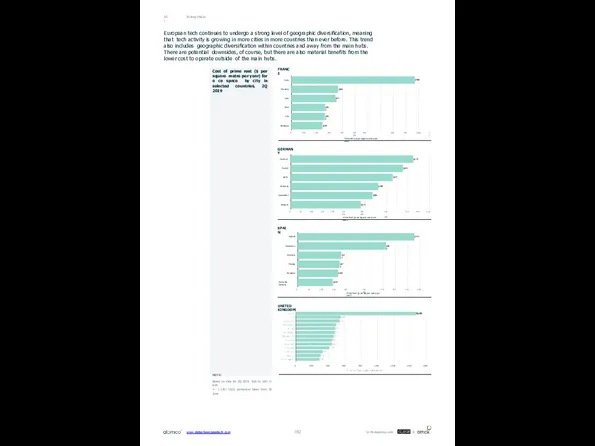
$966
$364
$341
$261
$261
$239
Paris
Marseille
Lyon
Nice
Lille
Bordeaux
0
100
200
300
400
500 600 700
Prime Rent ($ per square metre per year)
800
900
1,000
1,1
Picking Places
08.1
GERMANY
$573
$525
$477
$409
$382
$327
Frankfurt
Munich
Berlin
Hamburg
Dusseldorf
Cologne
0
50
100
150
200
250 300 350 400
Prime Rent ($
450 500
550
600
650
SPAIN
Prime Rent ($ per square metre per year)
$477
$361
$177
$171
$164
$143
Madrid
Barcelona
Valencia
Malaga
Zaragoza
Palma de Mallorca
0
50
100
150
200 250 300
350
400
450
500
UNITED KINGDOM
FRANCE
www.stateofeuropeantech.com
In Partnership with
&
Cost of prime rent ($ per square metre per year) for o ce space by city in selected countries, 2Q 2019
NOTE:
Based on data for 2Q 2019. EUR to USD (1 EUR
= 1.1367 USD) conversion taken from 30 June
European tech continues to undergo a strong level of geographic diversification, meaning that tech activity is growing in more cities in more countries than ever before. This trend also includes geographic diversification within countries and away from the main hubs. There are potential downsides, of course, but there are also material benefits from the lower cost to operate outside of the main hubs.
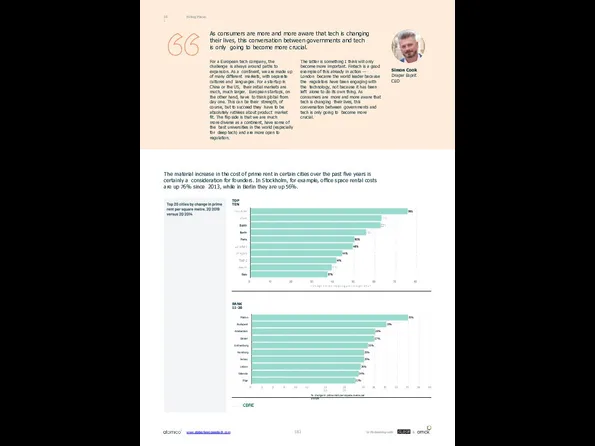
Picking Places
08.1
As consumers are more and more aware that tech is
Picking Places
08.1
As consumers are more and more aware that tech is
their lives, this conversation between governments and tech is only going to become more crucial.
For a European tech company, the challenge is always around paths to expansion. As a continent, we are made up of many different markets, with separate cultures and languages. For a startup in China or the US, their initial markets are much, much larger. European startups, on the other hand, have to think global from day one. This can be their strength, of course, but to succeed they have to be absolutely ruthless about product market fit. The flip side is that we are much
more diverse as a continent, have some of the best universities in the world (especially for deep tech) and are more open to regulation.
Simon Cook Draper Esprit CEO
35%
30%
28%
27%
26%
25%
25%
24%
24%
23%
Malmo
Budapest
Amsterdam
Bristol
Gothenburg
Hamburg
Jersey
Lisbon
Valencia
Riga
0
3
5
8
10
13 15 18 20 23 25
% change in prime rent per square metre per annum
28
30
33
35
38
40
RANK 11-20
TOP TEN
The material increase in the cost of prime rent in certain cities over the past five years is certainly a consideration for founders. In Stockholm, for example, office space rental costs are up 76% since 2013, while in Berlin they are up 56%.
The latter is something I think will only become more important. Fintech is a good example of this already in action — London became the world leader because the regulators have been engaging with the technology, not because it has been left alone to do its own thing. As consumers are more and more aware that tech is changing their lives, this conversation between governments and tech is only going to become more crucial.
www.stateofeuropeantech.com
In Partnership with
&
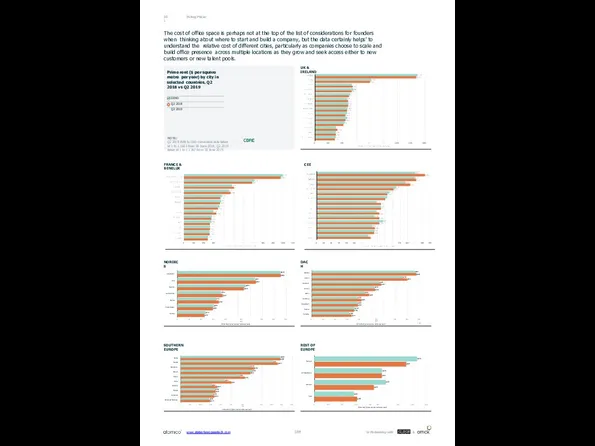
Picking Places
08.1
The cost of office space is perhaps not at the
Picking Places
08.1
The cost of office space is perhaps not at the
$637
$560
$357
$313
$297
$227
$849
$850
$644
$546
$371
$338
$289
$221
Stockholm
Oslo
Helsinki
Gothenburg
Malmo
Copenhagen
Aarhus
0
100
200
300
400 500 600
Prime Rent ($ per square metre per year)
700
800
900
$451
$343
$350
$151
$168
$157
$140
$490
$489
$477
$361
$341
$287
$314
$217
$246
$177
$171
$164
$143
Rome
Madrid
Barcelona
Athens
Lisbon
Porto
Valencia
Malaga
Zaragoza
Palma de Mallorca
0
50
100
150
200
250 300 350
Prime Rent ($ per square metre per year)
400
450
500
550
$855
$755
$560
$518
$441
$378
$378
$870
$793
$573
$525
$477
$409
$382
$357
$348
$308
$327
Geneva
Zurich
Frankfurt
Munich
Berlin
Hamburg
Dusseldorf
Vienna
Cologne
0
100
200
300
400 500 600
Prime Rent ($ per square metre per year)
700
800
900 1,00
$726
$478
$503
$276
$649
$475
$419
$299
Moscow
St Petersburg
Istanbul
Kiev
0
100
200
300
400 500
Prime Rent ($ per square metre per year)
600
700
800
NORDICS
FRANCE & BENELUX
SOUTHERN EUROPE
UK & IRELAND
DACH
REST OF EUROPE
Prime rent ($ per square metre per year) by city in selected countries, Q2 2018 vs Q2 2019
LEGEND
Q2 2018
Q2 2019
NOTE:
Q2 2018 EUR to USD conversion rate taken
at 1 to 1.1663 from 30 June 2018; Q2 2019
taken at 1 to 1.1367 from 30 June 2019.
CEE
www.stateofeuropeantech.com
In Partnership with
&
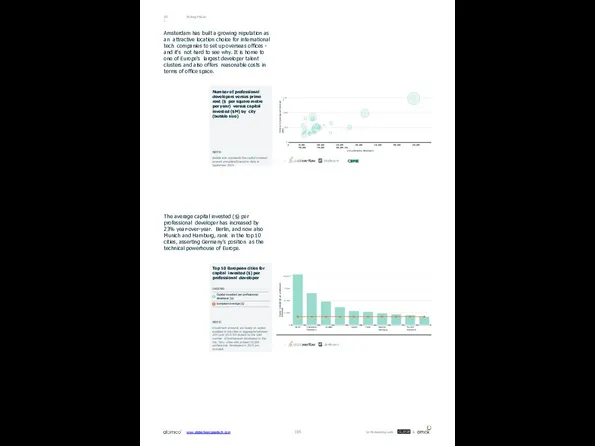
Picking Places
08.1
Amsterdam has built a growing reputation as an attractive location
Picking Places
08.1
Amsterdam has built a growing reputation as an attractive location
The average capital invested ($) per professional developer has increased by 23% year-over-year. Berlin, and now also Munich and Hamburg, rank in the top 10 cities, asserting Germany's position as the technical powerhouse of Europe.
Prime rent ($ per square metre per year)
0
50,000 100,000 150,000 200,000 250,000 300,000 350,000 400,000 450,000 500,000 550,…
# of professional developers
0
500
1,000
1,500
Capital invested ($) per professional developer
Berlin
Stockholm London Barcelona
Dublin
Paris
Helsinki Hamburg
Munich Bucharest
0
25,000
50,000
75,000
100,000
Number of professional developers versus prime rent ($ per square metre per year) versus capital invested ($M) by city (bubble size)
NOTE:
Bubble size represents the capital invested amount annualised based on data to September 2019.
Top 10 European cities for capital invested ($) per professional developer
LEGEND
Capital invested per professional developer ($)
European average ($)
NOTE:
Investment amounts are based on capital invested in the cities in aggregate between 2015 and 2019 9M divided by the total number of professional developers in the city. Only cities with at least 50,000 professional developers in 2019 are included.
www.stateofeuropeantech.com
In Partnership with
&
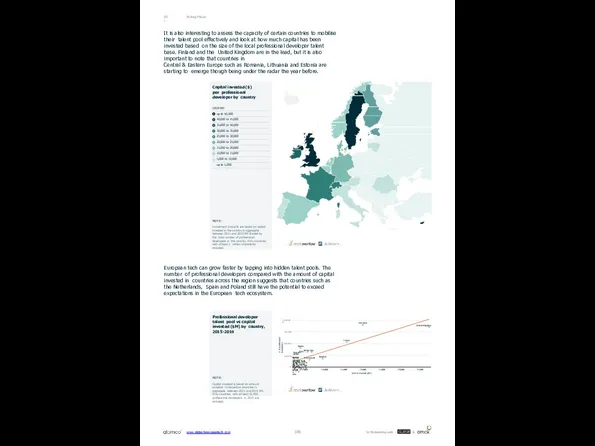
Picking Places
08.1
Capital invested ($) per professional developer by country
LEGEND
up to 50,000
40,000
Picking Places
08.1
Capital invested ($) per professional developer by country
LEGEND
up to 50,000
40,000
35,000 to 40,000
30,000 to 35,000
25,000 to 30,000
20,000 to 25,000
15,000 to 20,000
10,000 to 15,000
5,000 to 10,000
up to 5,000
NOTE:
Investment amounts are based on capital invested in the country in aggregate between 2015 and 2019 9M divided by the total number of professional developers in the country. Only countries with at least 1 million inhabitants included.
It is also interesting to assess the capacity of certain countries to mobilise their talent pool effectively and look at how much capital has been invested based on the size of the local professional developer talent base. Finland and the United Kingdom are in the lead, but it is also important to note that countries in
Central & Eastern Europe such as Romania, Lithuania and Estonia are starting to emerge though being under the radar the year before.
European tech can grow faster by tapping into hidden talent pools. The number of professional developers compared with the amount of capital invested in countries across the region suggests that countries such as the Netherlands, Spain and Poland still have the potential to exceed expectations in the European tech ecosystem.
# of professional developers
Germany
United Kingdom
France
Russia
PolandItalyNetherlaSnpdasin
Sweden
Turkey
Switzerland
CAzRueoBDscmethrnlagiRamniueiaamprukblic
HPNourontrguwagraFayilnIlraenladnd
BSGerueerllgaberaicuareisa
0
250,000 Ukraine
500,000
750,000
1,000,000
0 5,000 10,000 15,000 20,000 25,000 30,000 35,000
Capital invested ($M)
Professional developer talent pool vs capital invested ($M) by country, 2015-2019
NOTE:
Capital invested is based on amount invested in respective countries in aggregate between 2015 and 2019 9M. Only countries with at least 50,000 professional developers in 2019 are included.
www.stateofeuropeantech.com
In Partnership with
&
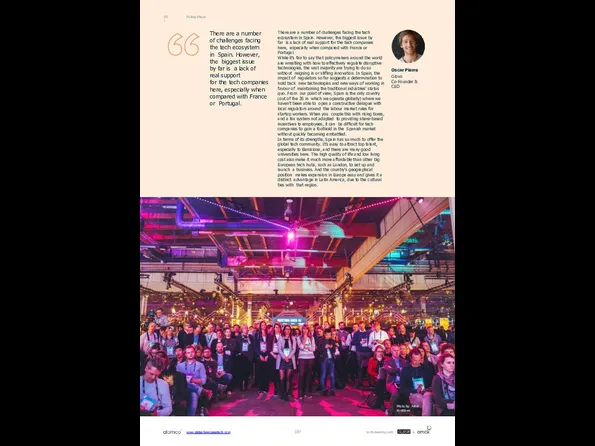
There are a number of challenges facing the tech ecosystem in
There are a number of challenges facing the tech ecosystem in
for the tech companies here, especially when compared with France or Portugal.
There are a number of challenges facing the tech ecosystem in Spain. However, the biggest issue by far is a lack of real support for the tech companies here, especially when compared with France or Portugal.
While it's fair to say that policymakers around the world are wrestling with how to effectively regulate disruptive technologies, the vast majority are trying to do so without reigning in or stifling innovation. In Spain, the impact of regulators so far suggests a determination to hold back new technologies and new ways of working in favour of maintaining the traditional industries' status quo. From our point of view, Spain is the only country (out of the 26 in which we operate globally) where we haven't been able to open a constructive dialogue with local regulators around the labour market rules for startup workers. When you couple this with rising taxes, and a tax system not adapted to providing share-based incentives to employees, it can be difficult for tech companies to gain a foothold in the Spanish market without quickly becoming embattled.
In terms of its strengths, Spain has so much to offer the global tech community. It's easy to attract top talent, especially to Barcelona, and there are many good universities here. The high quality of life and low living cost also make it much more affordable than other big European tech hubs, such as London, to set up and launch a business. And the country's geographical position makes expansion in Europe easy and gives it a distinct advantage in Latin America, due to the cultural ties with that region.
Oscar Pierre
Glovo
Co-Founder & CEO
Picking Places
08.1
Photo by: Julius Konttinen
www.stateofeuropeantech.com
In Partnership with
&

08.2
Budgeting for your (Series) A Team
'Cheat sheet'
How much does it cost
08.2
Budgeting for your (Series) A Team
'Cheat sheet'
How much does it cost
We don’t have a perfect answer, but to help we’ve put together an illustrative org chart for a Series A stage software-as-a-service (SaaS) company. No two teams are the same, but we think it provides a reasonable benchmark on what a team might look like for this type of business at that stage.
We then enriched our ‘dream team’ dataset with data from Aon's rewards data (covering base salary and actual incentives) and CBRE’s dataset on the prime rent cost of office space. We then built this out to give cost benchmarks for ten key European tech hubs, as well as providing a comparison with the equivalent cost to build the team from the Bay Area.
No methodology is ever perfect, but this should help founders (and others) to understand what it costs to set up and build in different European tech hubs.
Photo by: Julius Konttinen
www.stateofeuropeantech.com
In Partnership with
&
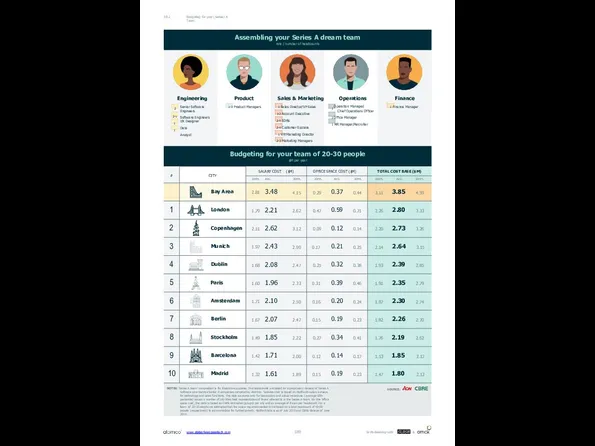
www.stateofeuropeantech.com
In Partnership with
&
Budgeting for your (Series) A Team
08.2
www.stateofeuropeantech.com
In Partnership with
&
Budgeting for your (Series) A Team
08.2

In Partnership with
&
www.stateofeuropeantech.com
In Partnership with
&
www.stateofeuropeantech.com
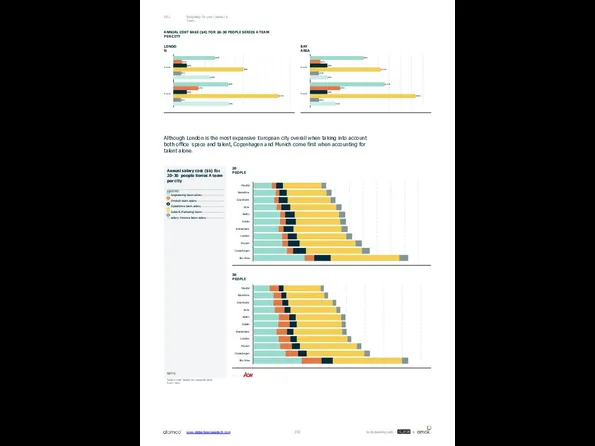
$529k
$699k
$105k
$314k
$168k
$168k
$896k
$1,351k
$93k
$93k
$470k
$706k
20 people
30 people
$941k
$1,316k
$175k
$526k
$297k
$297k
$1,247k
$1,861k
$150k
$150k
$295k
$442k
20 people
30 people
ANNUAL COST BASE ($K) FOR 20-30 PEOPLE
$529k
$699k
$105k
$314k
$168k
$168k
$896k
$1,351k
$93k
$93k
$470k
$706k
20 people
30 people
$941k
$1,316k
$175k
$526k
$297k
$297k
$1,247k
$1,861k
$150k
$150k
$295k
$442k
20 people
30 people
ANNUAL COST BASE ($K) FOR 20-30 PEOPLE
LONDON
BAY AREA
Madrid
Barcelona
Stockholm
Paris
Berlin
Dublin
Amsterdam
London
Munich
Copenhagen
Bay Area
Madrid
Barcelona
Stockholm
Paris
Berlin
Dublin
Amsterdam
London
Munich
Copenhagen
Bay Area
30 PEOPLE
20 PEOPLE
Annual salary cost ($k) for 20-30 people Series A team per city
LEGEND
Engineering team salary Product team salary Operations team salary
Sales & Marketing team salary Finance team salary
NOTE:
'Salary cost' based on rewards data from Aon.
Although London is the most expansive European city overall when taking into account both office space and talent, Copenhagen and Munich come first when accounting for talent alone.
Budgeting for your (Series) A Team
08.2
www.stateofeuropeantech.com
In Partnership with
&
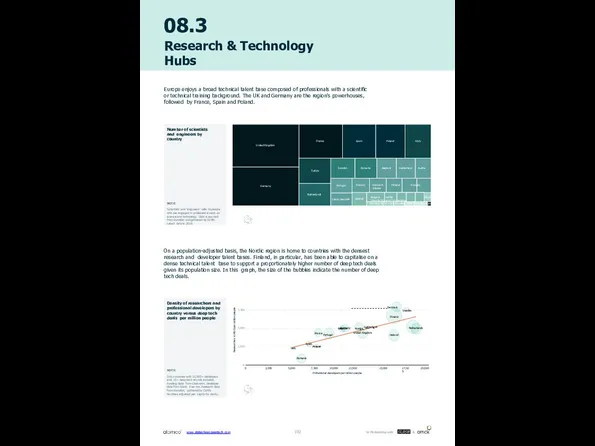
08.3
Research & Technology Hubs
Europe enjoys a broad technical talent base composed
08.3
Research & Technology Hubs
Europe enjoys a broad technical talent base composed
or technical training background. The UK and Germany are the region's powerhouses, followed by France, Spain and Poland.
On a population-adjusted basis, the Nordic region is home to countries with the densest research and developer talent bases. Finland, in particular, has been able to capitalise on a dense technical talent base to support a proportionately higher number of deep tech deals given its population size. In this graph, the size of the bubbles indicate the number of deep tech deals.
Germany
France
Netherlands
United Kingdom
Italy
Sweden
Switzerland Austria
Belgium
Spain
Turkey
Ireland
bourg
Norway
Poland
Czech Republic
Portugal
Denmark Finland Hungary Greece
Romania
Bulgaria Serbia SlovakiaLithuaniaCLrouaxetima
Slovenia Malta Latvia EstonMia cedoCnyiaIpcreulsand
Researchers in R&D per million people
Germany
United Kingdom
Italy
Spain
Poland
Romania
Netherlands
Belgium
France Portugal
Austria Switzerland
Denmark
Sweden
Finland
Ireland
0
2,500
5,000
7,500 10,000 12,500
Professional developers per million people
15,000
17,500
20,000
0
2,500
5,000
7,500
Number of scientists and engineers by country
NOTE:
'Scientists' and 'engineers' refer to people who are engaged in professional work on science and technology. Data is sourced from Eurostat and gathered by CERN. Latest data is 2018.
Density of researchers and professional developers by country versus deep tech deals per million people
NOTE:
Only countries with 10,000+ developers and 10+ deep tech rounds included. Funding data from Dealroom, developer data from Stack Over ow. Research data from Eurostat, gathered by CERN. Numbers adjusted per capita for clarity.
www.stateofeuropeantech.com
In Partnership with
&
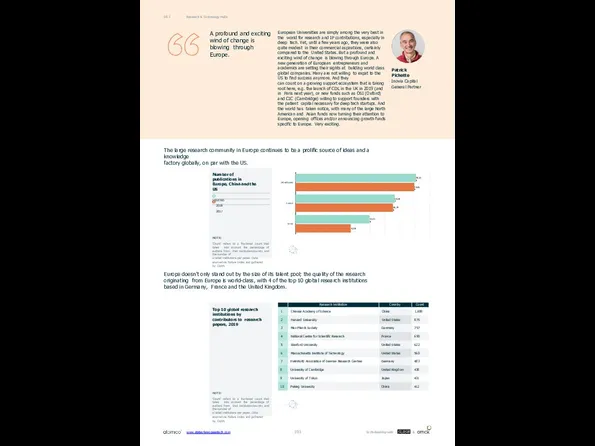
A profound and exciting wind of change is blowing through Europe.
European
A profound and exciting wind of change is blowing through Europe.
European
can count on a growing support ecosystem that is taking root here, e.g. the launch of CDL in the UK in 2019 (and in Paris next year), or new funds such as OSI (Oxford) and CIC (Cambridge) willing to support founders with the patient capital necessary for deep tech startups. And the world has taken notice, with many of the large North American and Asian funds now turning their attention to Europe, opening offices and/or announcing growth funds specific to Europe. Very exciting.
Patrick Pichette Inovia Capital General Partner
Research & Technology Hubs
08.3
The large research community in Europe continues to be a prolific source of ideas and a knowledge
factory globally, on par with the US.
Europe doesn't only stand out by the size of its talent pool; the quality of the research originating from Europe is world-class, with 4 of the top 10 global research institutions based in Germany, France and the United Kingdom.
20,116
16,583
12,340
19,859
16,298
9,229
United States
Europe
China
NOTE:
Number of publications in Europe, China and the US
LEGEND
2018
2017
NOTE:
'Count' refers to a fractional count that takes into account the percentage of authors from that institution/country and the number of
a liated institutions per paper. Data sourced via Nature Index and gathered by CERN.
Top 10 global research institutions by contributors to research papers, 2019
NOTE:
'Count' refers to a fractional count that takes into account the percentage of authors from that institution/country and the number of
a liated institutions per paper. Data sourced via Nature Index and gathered by CERN.
www.stateofeuropeantech.com
In Partnership with
&
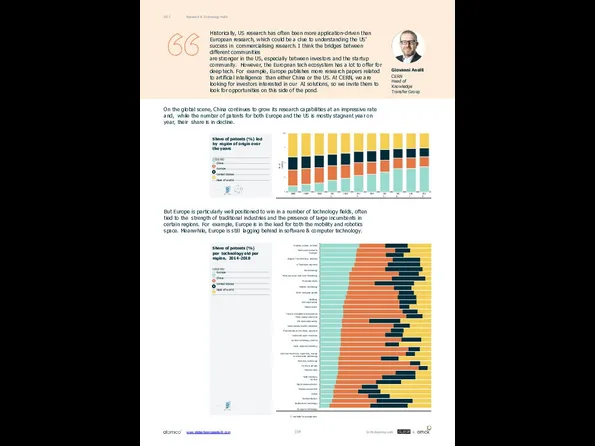
Research & Technology Hubs
08.3
Giovanni Anelli
CERN
Head of Knowledge Transfer Group
Historically, US research
Research & Technology Hubs
08.3
Giovanni Anelli
CERN
Head of Knowledge Transfer Group
Historically, US research
are stronger in the US, especially between investors and the startup community. However, the European tech ecosystem has a lot to offer for deep tech. For example, Europe publishes more research papers related to artificial intelligence than either China or the US. At CERN, we are looking for investors interested in our AI solutions, so we invite them to look for opportunities on this side of the pond.
On the global scene, China continues to grow its research capabilities at an impressive rate and, while the number of patents for both Europe and the US is mostly stagnant year on year, their share is in decline.
Share of patents (%) led by region of origin over the years
LEGEND
China Europe
United States Rest of world
% of patents
2008
2009
2010
2011
2012
2013
2014
2015
2016
2017
2018
0
25
50
75
100
Share of patents (%) per technology eld per region, 2014-2018
LEGEND
Europe China
United States Rest of world
Engines, pumps, turbines
Mechanical elements
Transport Organic fine chemistry Analysis of biological materials
Biotechnology Micro-structural and nano-technology
Pharmaceuticals Medical technology Other consumer goods
Handling
Civil engineering Measurement
Thermal processes and apparatus
Other special machines Chemical engineering
Basic communication processes Macromolecular chemistry, polymers Textile and paper machines
Surface technology, coating Basic materials chemistry
Electrical machinery, apparatus, energy
Environmental technology Materials, metallurgy Furniture, games Machine tools
Food chemistry
Control Digital communication Telecommunications
Optics Semiconductors
Audio-visual technology Computer technology
IT methods for management
But Europe is particularly well positioned to win in a number of technology fields, often tied to the strength of traditional industries and the presence of large incumbents in certain regions. For example, Europe is in the lead for both the mobility and robotics space. Meanwhile, Europe is still lagging behind in software & computer technology.
www.stateofeuropeantech.com
In Partnership with
&
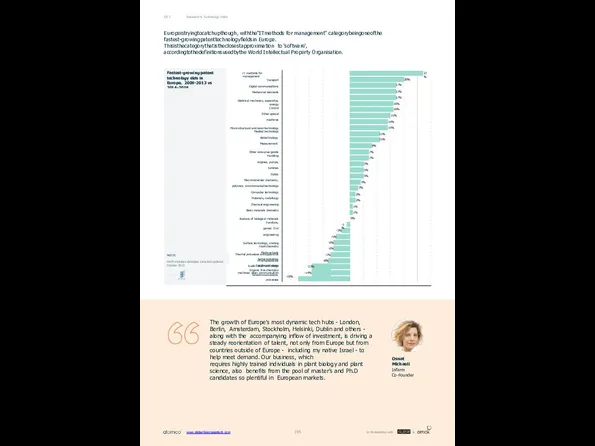
The growth of Europe's most dynamic tech hubs - London, Berlin,
The growth of Europe's most dynamic tech hubs - London, Berlin,
requires highly trained individuals in plant biology and plant science, also benefits from the pool of master’s and Ph.D candidates so plentiful in European markets.
Osnat Michaeli
Infarm
Co-Founder
Research & Technology Hubs
08.3
Fastest-growing patent technology elds in Europe, 2009-2013 vs 2014-2018
27%
-1%
-3%
-5%
-6%
-6%
IT methods for management
Transport Digital communications Mechanical elements
Electrical machinery, apparatus, energy
Control Other special machines
Micro-structural and nano-technology
Medical technology Biotechnology Measurement
Other consumer goods
Handling Engines, pumps, turbines
Optics Macromolecular chemistry, polymers Environmental technology
Computer technology Materials, metallurgy Chemical engineering Basic materials chemistry
Analysis of biological materials
Furniture, games Civil engineering
Surface technology, coating
Food chemistry Machine tools Semiconductors
Textile and paper machines Basic communication processes
Europeistryingtocatchupthough, withthe"ITmethods for management" categorybeingoneofthe fastest-growingpatenttechnologyfieldsin Europe. Thisisthecategorythatistheclosestapproximation to 'software', accordingtothedefinitionsusedbythe World Intellectual Property Organisation.
www.stateofeuropeantech.com
In Partnership with
&
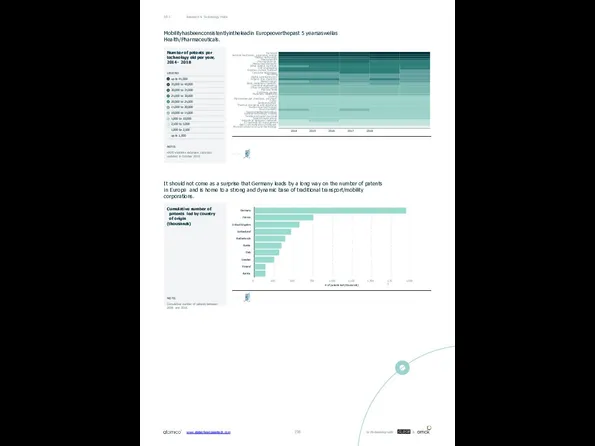
Mobilityhasbeenconsistentlyintheleadin Europeoverthepast 5 yearsaswellas Health/Pharmaceuticals.
It should not come as a surprise
Mobilityhasbeenconsistentlyintheleadin Europeoverthepast 5 yearsaswellas Health/Pharmaceuticals.
It should not come as a surprise
Germany
France
United Kingdom
Switzerland
Netherlands
Russia
Italy
Sweden
Finland
Austria
0
2,000
250
500
750
1,000 1,250
# of patents led (thousands)
1,500
1,750
2014 2015 2016 2017 2018
Micro-structural and nano-technology
Basic communication processes
IT methods for management
Analysis of biological materials
Telecommunications
Textile and paper machines
Surface technology, coating
Environmental technology
Food chemistry
Audio-visual technology
Thermal processes and apparatus
Semiconductors
Optics
Macromolecular chemistry, polymers
Control
Materials, metallurgy
Furniture, games
Machine tools
Other consumer goods
Chemical engineering
Basic materials chemistry
Biotechnology
Organic fine chemistry
Digital communication
Handling
Computer technology
Engines, pumps, turbines
Civil engineering
Other special machines
Mechanical elements
Pharmaceuticals
Measurement
Medical technology
lectrical machinery, apparatus, energy
Transport
Number of patents per technology eld per year, 2014- 2018
LEGEND
up to 45,000
35,000 to 40,000
30,000 to 35,000
25,000 to 30,000
20,000 to 25,000
15,000 to 20,000
10,000 to 15,000
5,000 to 10,000
2,500 to 5,000
1,000 to 2,500
up to 1,000
NOTE:
WIPO statistics database. Data last updated in October 2019.
Cumulative number of patents led by country of origin
(thousands)
NOTE:
Cumulative number of patents between 2008 and 2018.
Research & Technology Hubs
08.3
www.stateofeuropeantech.com
In Partnership with
&
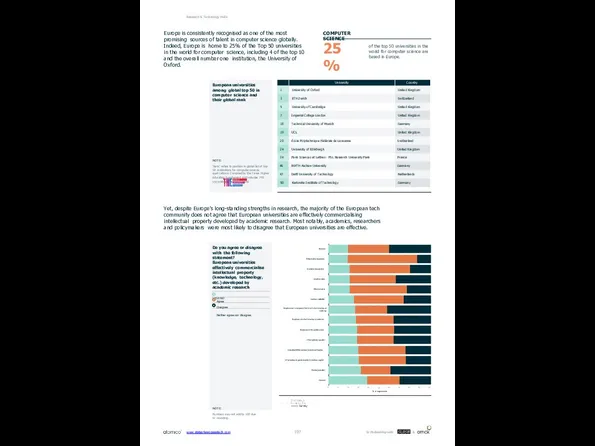
Do you agree or disagree with the following statement?
European universities effectively
Do you agree or disagree with the following statement?
European universities effectively
LEGEND
Agree Disagree
Neither agree nor disagree
NOTE:
Numbers may not add to 100 due to rounding.
Founder
Policymaker/regulator
Academic/researcher
Angel investor
Other investor
Venture capitalist
Employee at a company that is not a tech startup or
scale-up
Employee at a tech startup or scale-up
Employee in the public sector
Other (please specify)
Consultant/M&A advisor/investment banker
LP investing in private equity & venture capital
Media/journalist
Student
0
10
20
30
40
50
% of respondents
60
70
80
90
100
Yet, despite Europe's long-standing strengths in research, the majority of the European tech community does not agree that European universities are effectively commercialising intellectual property developed by academic research. Most notably, academics, researchers and policymakers were most likely to disagree that European universities are effective.
Research & Technology Hubs
Europe is consistently recognised as one of the most promising sources of talent in computer science globally. Indeed, Europe is home to 25% of the Top 50 universities in the world for computer science, including 4 of the top 10 and the overall number one institution, the University of Oxford.
of the top 50 universities in the world for computer science are based in Europe.
COMPUTER SCIENCE
25%
European universities among global top 50 in computer science and their global rank
NOTE:
'Rank' refers to position in global list of top 50 institutions for computer science
quali cations. Compiled by the Times Higher Education Supplement and includes 749 universities across the world.
www.stateofeuropeantech.com
In Partnership with
&
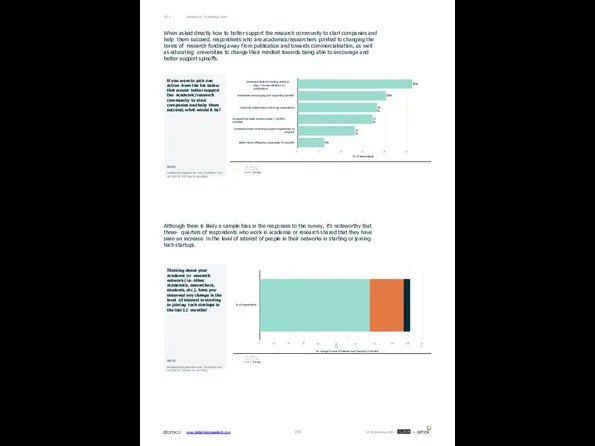
When asked directly how to better support the research community to
When asked directly how to better support the research community to
Although there is likely a sample bias in the responses to the survey, it's noteworthy that three- quarters of respondents who work in academia or research shared that they have seen an increase in the level of interest of people in their networks in starting or joining tech startups.
26%
20%
18%
17%
13%
6%
Increased research funding aimed at idea commercialisation vs. publications
Universities encouraging and supporting spinoffs
Improved collaboration with large corporations
Increased pre-seed venture capital (<$250k) available
Increased access to startup support organisation or
program
Better terms offered by universities for spinoffs
0
5
10
15
% of respondents
20
25
% of respondents
0
10
20
30
40 50 60 70 80
% change in level of interest over the last 12 months
90
100
110
If you were to pick one action from the list below that would better support the academic/research community to start companies and help them succeed, what would it be?
NOTE:
Academics/researchers only. Numbers may not add to 100 due to rounding.
Thinking about your academic or research network (i.e. other academics, researchers, students, etc.), have you observed any change in the level of interest in starting or joining tech startups in the last 12 months?
NOTE:
Academics/researchers only. Numbers may not add to 100 due to rounding.
Research & Technology Hubs
08.3
www.stateofeuropeantech.com
In Partnership with
&
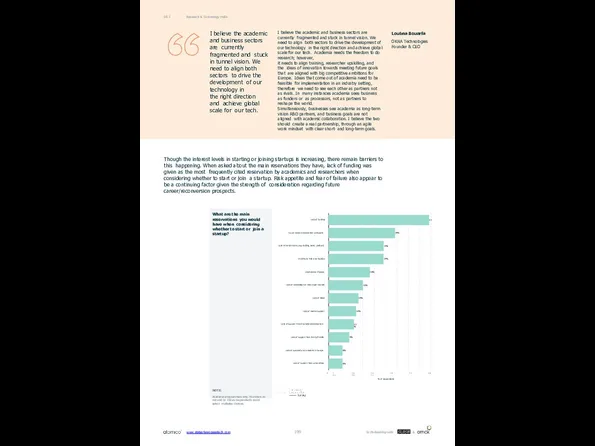
I believe the academic and business sectors are currently fragmented and
I believe the academic and business sectors are currently fragmented and
the right direction and achieve global scale for our tech.
I believe the academic and business sectors are currently fragmented and stuck in tunnel vision. We need to align both sectors to drive the development of our technology in the right direction and achieve global scale for our tech. Academia needs the freedom to do research; however,
it needs to align training, researcher upskilling, and the ideas of innovation towards meeting future goals that are aligned with big competitive ambitions for Europe. Ideas that come out of academia need to be feasible for implementation in an industry setting, therefore we need to see each other as partners not as rivals. In many instances academia sees business as funders or as processors, not as partners to reshape the world.
Simultaneously, businesses see academia as long-term vision R&D partners, and business goals are not aligned with academic collaboration. I believe the two should create a real partnership, through an agile work mindset with clear short- and long-term goals.
Loubna Bouarfa
OKRA Technologies Founder & CEO
What are the main reservations you would have when considering whether to start or join a startup?
NOTE:
Academics/researchers only. Numbers do not add to 100 as respondents could select multiples choices.
44
29%
24%
24%
18%
15%
13%
12%
11%
9%
6%
6%
Lack of funding
Future career/reconversion prospects
Lack of certain skills (e.g. coding, sales, product)
Inability to find a co-founder
Unattractive lifestyle
Lack of knowledge on how to get started
Lack of ideas
Lack of mental support
Lack of support from incubators/accelerators
Lack of support from family/friends
Lack of successful role models in Europe
Lack of support from universities
0 5 10 15 20 25 30 35 40 45
% of respondents
Though the interest levels in starting or joining startups is increasing, there remain barriers to this happening. When asked about the main reservations they have, lack of funding was given as the most frequently cited reservation by academics and researchers when considering whether to start or join a startup. Risk appetite and fear of failure also appear to be a continuing factor given the strength of consideration regarding future career/reconversion prospects.
Research & Technology Hubs
08.3
www.stateofeuropeantech.com
In Partnership with
&
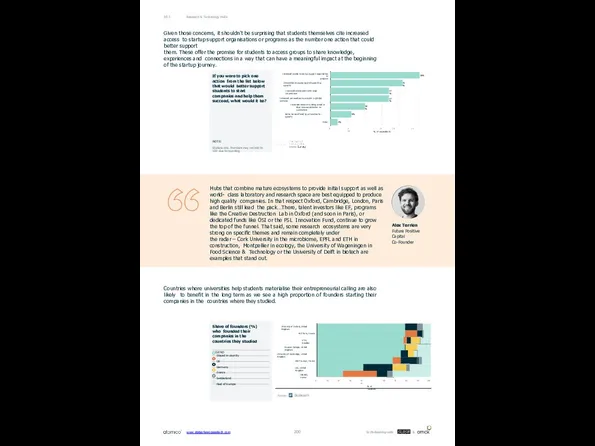
Given those concerns, it shouldn't be surprising that students themselves cite
Given those concerns, it shouldn't be surprising that students themselves cite
them. These offer the promise for students to access groups to share knowledge, experiences and connections in a way that can have a meaningful impact at the beginning of the startup journey.
Countries where universities help students materialise their entrepreneurial calling are also likely to benefit in the long term as we see a high proportion of founders starting their companies in the countries where they studied.
26%
21%
17%
17%
10%
6%
Increased access to startup support organisation or
program
Universities encouraging and supporting spinoffs
Improved collaboration with large corporations
Increased pre-seed venture capital (<$250k) available
Increased research funding aimed at idea commercialisation vs. publications
Better terms offered by universities for spinoffs
Other
2%
0 5 10
15 20 25
% of respondents
Share of founders (%) who founded their companies in the countries they studied
LEGEND
Stayed in country UK
Germany France Switzerland Rest of Europe
University of Oxford, United Kingdom
HEC Paris, France
KTH, Sweden
Imperial College, United Kingdom
University of Cambridge, United Kingdom
ESCP Europe, France
LSE, United Kingdom
INSEAD, France
0
10
20
30
40 50
% of founders
60
70
80
90
100
If you were to pick one action from the list below that would better support students to start companies and help them succeed, what would it be?
NOTE:
Studens only. Numbers may not add to 100 due to rounding.
Hubs that combine mature ecosystems to provide initial support as well as world- class laboratory and research space are best equipped to produce high quality companies. In that respect Oxford, Cambridge, London, Paris and Berlin still lead the pack…There, talent investors like EF, programs like the Creative Destruction Lab in Oxford (and soon in Paris), or dedicated funds like OSI or the PSL Innovation Fund, continue to grow the top of the funnel. That said, some research ecosystems are very strong on specific themes and remain completely under
the radar – Cork University in the microbiome, EPFL and ETH in construction, Montpellier in ecology, the University of Wageningen in Food Science & Technology or the University of Delft in biotech are examples that stand out.
Alex Terrien Future Positive Capital
Co-Founder
Research & Technology Hubs
08.3
www.stateofeuropeantech.com
In Partnership with
&
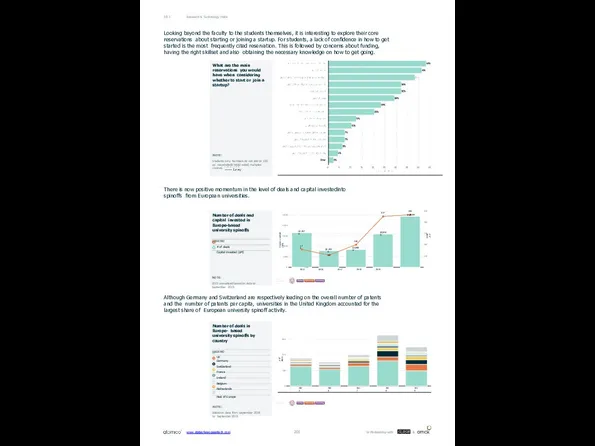
What are the main reservations you would have when considering whether
What are the main reservations you would have when considering whether
NOTE:
Students only. Numbers do not add to 100 as respondents could select multiples choices.
Looking beyond the faculty to the students themselves, it is interesting to explore their core reservations about starting or joining a startup. For students, a lack of confidence in how to get started is the most frequently cited reservation. This is followed by concerns about funding, having the right skillset and also obtaining the necessary knowledge on how to get going.
There is now positive momentum in the level of deals and capital investedinto spinoffs from European universities.
Capital invested ($M)
# of deals
179
201
327
335
$3,317M
$1,593M 154
$1,698M
$3,190M
$4,889M
2015 2016 2017 2018 2019
1,000
2,000
3,000
4,000
5,000
0 100
150
200
250
300
350
Number of deals and capital invested in Europe-based university spinoffs
LEGEND
# of deals
Capital invested ($M)
NOTE:
2019 annualised based on data to September 2019.
Research & Technology Hubs
08.3
Although Germany and Switzerland are respectively leading on the overall number of patents and the number of patents per capita, universities in the United Kingdom accounted for the largest share of European university spinoff activity.
# of deals
2015
2016
2017
2018
2019
0
100
200
300
Number of deals in Europe- based university spinoffs by country
LEGEND
UK
Germany Switzerland France Ireland Belgium Netherlands
Rest of Europe
NOTE:
Based on data from September 2018 to September 2019.
www.stateofeuropeantech.com
In Partnership with
&
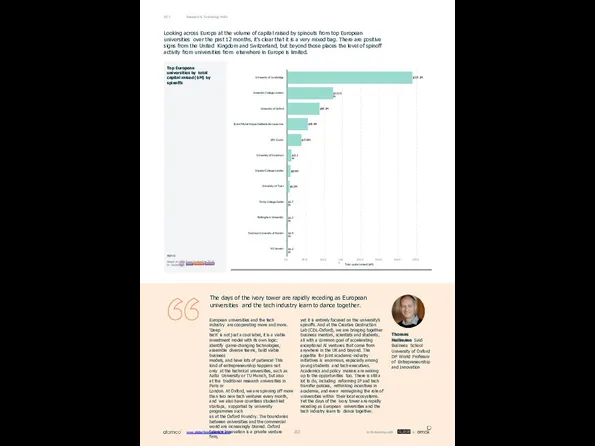
Top European universities by total capital raised ($M) by spinoffs
NOTE:
Based on
Top European universities by total capital raised ($M) by spinoffs
NOTE:
Based on
$337.2M
$123.5M
$87.2M
$56.0M
$37.8M
$11.1M
$8.9M
$6.3M
$1.7M
$1.7M
$1.5M
$1.2M
University of Cambridge
University College London
University of Oxford
École Polytechnique Fédérale de Lausanne
ETH Zurich
University of Innsbruck
Imperial College London
University of Turin
Trinity College Dublin
Nottingham University
Technical University of Munich
KU Leuven
0.0
50.0
100.0
150.0
200.0
Total capital raised ($M)
250.0
300.0
350.0
Looking across Europe at the volume of capital raised by spinouts from top European universities over the past 12 months, it's clear that it is a very mixed bag. There are positive signs from the United Kingdom and Switzerland, but beyond those places the level of spinoff activity from universities from elsewhere in Europe is limited.
Research & Technology Hubs
08.3
The days of the ivory tower are rapidly receding as European universities and the tech industry learn to dance together.
European universities and the tech industry are cooperating more and more. 'Deep
tech' is not just a cool label, it is a viable investment model with its own logic: identify game-changing technologies, assemble diverse teams, build viable business
models, and have lots of patience! This kind of entrepreneurship happens not only at the technical universities, such as Aalto University or TU Munich, but also at the traditional research universities in Paris or
London. At Oxford, we are spinning off more than two new tech ventures every month, and we also have countless student-led startups, supported by university programmes such
as at the Oxford Foundry. The boundaries between universities and the commercial world are increasingly blurred. Oxford Science Innovation is a private venture firm,
Thomas Hellmann Saïd Business School
University of Oxford DP World Professor of Entrepreneurship and Innovation
yet it is entirely focused on the university’s spinoffs. And at the Creative Destruction Lab (CDL-Oxford), we are bringing together business mentors, scientists and students, all with a common goal of accelerating exceptional AI ventures that come from anywhere in the UK and beyond. The appetite for joint academic-industry initiatives is enormous, especially among young students and tech executives. Academics and policy makers are waking up to the opportunities too. There is still a lot to do, including reforming IP and tech transfer policies, rethinking incentives in academia, and even reimagining the role of universities within their local ecosystems. Yet the days of the ivory tower are rapidly receding as European universities and the tech industry learn to dance together.
www.stateofeuropeantech.com
In Partnership with
&
08.4
Trending Hubs & Communities
Europe continues to flourish and to experience growth
08.4
Trending Hubs & Communities
Europe continues to flourish and to experience growth
# of European cities
70
90
110
117
170
2015 2016 2017 2018 2019
0
50
100
150
Number of European cities with 100+ tech-related Meetup events per year
NOTE:
2019 annualised based on data to end of September 2019.
Strong and supportive
Founders picked the presence of a strong personal network and a supportive local tech community as two of the top three most important personal considerations for choosing where to start.
Photo by: Samuli Pentti
www.stateofeuropeantech.com
In Partnership with
&
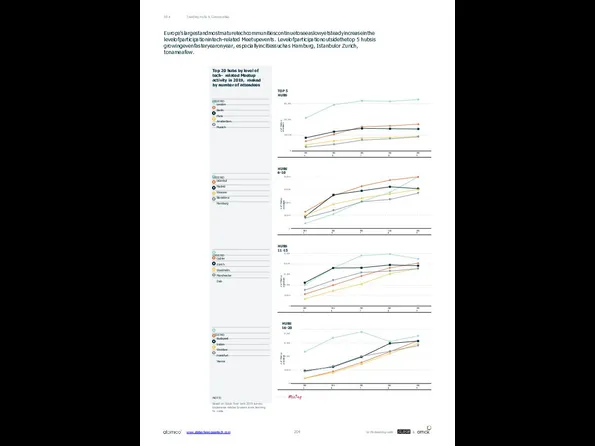
Trending Hubs & Communities
08.4
# of Meetup attendees
2015
2016
2017
2018
2019
0
20,000
40,000
60,000
80,000
HUBS 6-10
# of Meetup attendees
2015
2016
2017
2018
2019
0
10,000
20,000
30,000
40,000
50,000
HUBS
Trending Hubs & Communities
08.4
# of Meetup attendees
2015
2016
2017
2018
2019
0
20,000
40,000
60,000
80,000
HUBS 6-10
# of Meetup attendees
2015
2016
2017
2018
2019
0
10,000
20,000
30,000
40,000
50,000
HUBS
# of Meetup attendees
2015
2016
2017
2018
2019
0
10,000
20,000
30,000
HUBS 16-20
40,000
Europe'slargestandmostmaturetechcommunitiescontinuetoseeaslowyetsteadyincreaseinthe levelofparticipationintech-related Meetupevents. Levelofparticipationoutsidethetop 5 hubsis growingevenfasteryearonyear, especiallyincitiessuchas Hamburg, Istanbulor Zurich, tonameafew.
Top 20 hubs by level of tech- related Meetup activity in 2019, ranked by number of attendees
LEGEND
London Berlin Paris
Amsterdam Munich
LEGEND
Istanbul Madrid Warsaw Barcelona Hamburg
LEGEND
Dublin Zürich Stockholm Manchester Oslo
LEGEND
Budapest Lisbon Wroclaw Frankfurt Vienna
NOTE:
Based on Stack Over ow's 2019 survey. Experience relates to years since learning to code.
# of Meetup attendees
2015
2016
2017
2018
2019
0
100,000
200,000
300,000
TOP 5 HUBS
www.stateofeuropeantech.com
In Partnership with
&
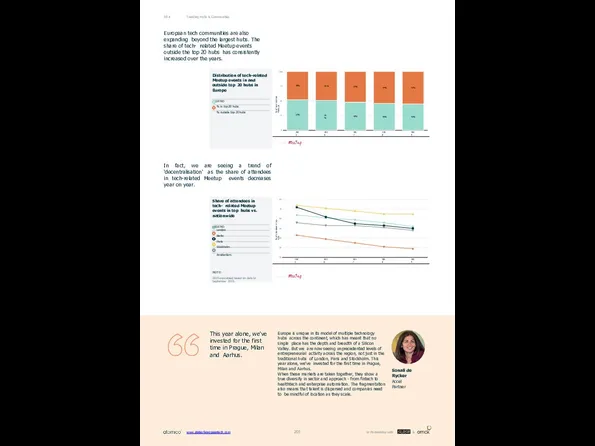
Trending Hubs & Communities
08.4
European tech communities are also expanding beyond the
Trending Hubs & Communities
08.4
European tech communities are also expanding beyond the
In fact, we are seeing a trend of 'decentralisation' as the share of attendees in tech-related Meetup events decreases year on year.
Distribution of tech-related Meetup events in and outside top 20 hubs in Europe
LEGEND
% in top 20 hubs
% outside top 20 hubs
% of tech-related Meetups
52%
51%
48%
46%
45%
48%
49%
52%
54%
55%
2015
2016
2017
2018
2019
0
25
50
75
100
% of attendees in top hubs
2015
2016
2017
2018
2019
20
30
40
50
60
70
80
Share of attendees in tech- related Meetup events in top hubs vs. nationwide
LEGEND
London Berlin Paris Stockholm
Amsterdam
NOTE:
2019 annualised based on data to September 2019.
This year alone, we've invested for the first time in Prague, Milan and Aarhus.
Europe is unique in its model of multiple technology hubs across the continent, which has meant that no single place has the depth and breadth of a Silicon Valley. But we are now seeing unprecedented levels of entrepreneurial activity across the region, not just in the traditional hubs of London, Paris and Stockholm. This year alone, we've invested for the first time in Prague, Milan and Aarhus.
When these markets are taken together, they show a
true diversity in sector and approach - from fintech to healthtech and enterprise automation. The fragmentation also means that talent is dispersed and companies need to be mindful of location as they scale.
Sonali de Rycker
Accel Partner
www.stateofeuropeantech.com
In Partnership with
&
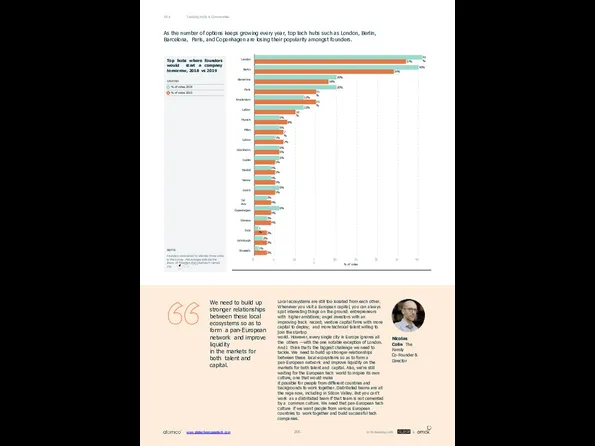
We need to build up stronger relationships between these local ecosystems
We need to build up stronger relationships between these local ecosystems
in the markets for both talent and capital.
Local ecosystems are still too isolated from each other. Whenever you visit a European capital, you can always spot interesting things on the ground: entrepreneurs with higher ambitions; angel investors with an improving track record; venture capital firms with more capital to deploy; and more technical talent willing to join the startup
world. However, every single city in Europe ignores all the others —with the one notable exception of London. And I think that's the biggest challenge we need to tackle. We need to build up stronger relationships between these local ecosystems so as to form a pan-European network and improve liquidity on the markets for both talent and capital. Also, we're still waiting for the European tech world to inspire its own culture, one that would make
it possible for people from different countries and backgrounds to work together. Distributed teams are all the rage now, including in Silicon Valley. But you can't work as a distributed team if that team is not cemented by a common culture. We need that pan-European tech culture if we want people from various European countries to work together and build successful tech companies.
Nicolas Colin The Family Co-Founder & Director
Trending Hubs & Communities
08.4
Top hubs where founders would start a company tomorrow, 2018 vs 2019
LEGEND
% of votes 2018
% of votes 2019
NOTE:
Founders were asked to allocate three votes in the survey. Percentages indicate the share of founders that cited each named city.
41%
40%
20%
20%
12%
12%
6%
5%
4%
4%
6%
1%
1%
37%
34%
18%
15%
15%
10%
8%
6%
7%
7%
6%
6%
6%
5%
5%
5%
6%
5%
3%
4%
4%
3%
4%
3%
2%
3%
3%
London
Berlin
Barcelona
Paris
Amsterdam
Lisbon
Munich
Milan
Tallinn
Stockholm
Dublin
Madrid
Vienna
Zurich
Tel Aviv
Copenhagen
Warsaw
Oslo
Edinburgh
Brussels
0
5
10
15
20
25
% of votes
30
35
40
As the number of options keeps growing every year, top tech hubs such as London, Berlin, Barcelona, Paris, and Copenhagen are losing their popularity amongst founders.
www.stateofeuropeantech.com
In Partnership with
&
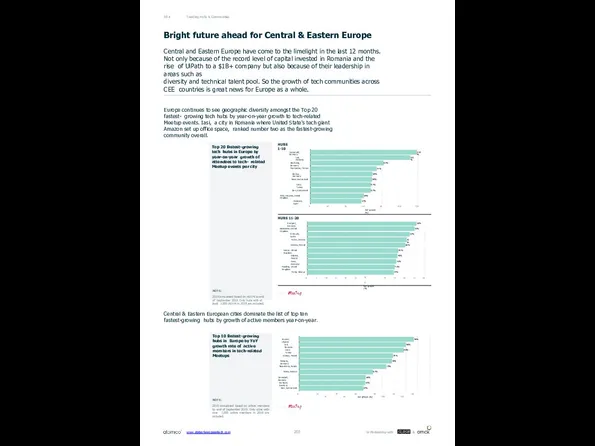
Trending Hubs & Communities
08.4
Bright future ahead for Central & Eastern Europe
Central
Trending Hubs & Communities
08.4
Bright future ahead for Central & Eastern Europe
Central
Not only because of the record level of capital invested in Romania and the rise of UiPath to a $1B+ company but also because of their leadership in areas such as
diversity and technical talent pool. So the growth of tech communities across CEE countries is great news for Europe as a whole.
56%
55%
52%
51%
50%
46%
46%
45%
45%
44%
Newcastle, United Kingdom
A Coruña, Spain
Tallinn, Estonia
Gliwice, Poland
Exeter, United Kingdom
Gdansk, Poland
Bonn, Germany
Reading, United Kingdom
Minsk, Belarus
0
5
10
15
20
25
30 35
YoY growth (%)
40
45
50
55
60
Top 20 fastest-growing tech hubs in Europe by year-on-year growth of attendees to tech- related Meetup events per city
NOTE:
2019 annualised based on RSVPs to end of September 2019. Only hubs with at least 1,000 RSVPs in 2018 are included.
YoY growth (%)
119%
111%
82%
74%
69%
69%
67%
67%
59%
57%
Darmstadt, Germany
Iasi, Romania
Nürnberg, Germany
Montpellier, France
Aarhus, Denmark
Basel, Switzerland
Izmir, Turkey
Bern, Switzerland
Milton Keynes, United Kingdom
Zaragoza, Spain
0
20
40
60
80
100
120
HUBS 11-20
Stuttgart, Germany
HUBS 1-10
Europe continues to see geographic diversity amongst the Top 20 fastest- growing tech hubs by year-on-year growth to tech-related Meetup events. Iasi, a city in Romania where United State's tech giant Amazon set up office space, ranked number two as the fastest-growing community overall.
Central & Eastern European cities dominate the list of top ten fastest-growing hubs by growth of active members year-on-year.
96%
90%
88%
79%
78%
73%
62%
56%
55%
Kharkiv, Ukraine
Iasi, Romania
Izmir, Turkey
Gliwice, Poland
Cologne, Germany
Novosibirsk, Russia
Minsk, Belarus
Darmstadt, Germany
Stuttgart, Germany
Bern, Switzerland
54%
0 10 20 30 40 50 60 70 80 90 100 110
YoY growth (%)
Top 10 fastest-growing hubs in Europe by YoY growth rate of active members in tech-related Meetups
NOTE:
2019 annualised based on active members to end of September 2019. Only cities with over 1,000 active members in 2018 are included.
www.stateofeuropeantech.com
In Partnership with
&
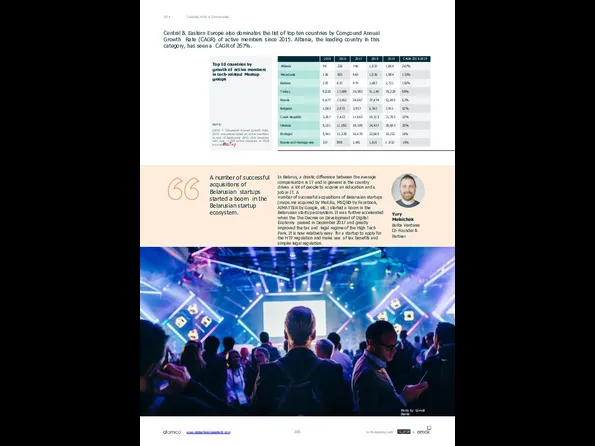
Trending Hubs & Communities
08.4
Central & Eastern Europe also dominates the list
Trending Hubs & Communities
08.4
Central & Eastern Europe also dominates the list
Top 10 countries by growth of active members in tech-related Meetup groups
NOTE:
CAGR = Compound Annual Growth Rate. 2019 annualised based on active members to end of September 2019. Only countries with over 1,000 active members in 2018 are included.
A number of successful acquisitions of Belarusian startups started a boom in the Belarusian startup ecosystem.
In Belarus, a drastic difference between the average compensation in IT and in general in the country drives a lot of people to acquire an education and a job in IT. A
number of successful acquisitions of Belarusian startups (maps.me acquired by Mail.Ru, MSQRD by Facebook, AIMATTER by Google, etc.) started a boom in the Belarusian startup ecosystem. It was further accelerated when the The Decree on Development of Digital Economy passed in December 2017 and greatly improved the tax and legal regime of the High Tech Park. It is now relatively easy for a startup to apply for the HTP regulation and make use of tax benefits and simpler legal regulation.
Yury Melnichek Bulba Ventures Co-Founder & Partner
Photo by: Samuli Pentti
www.stateofeuropeantech.com
In Partnership with
&
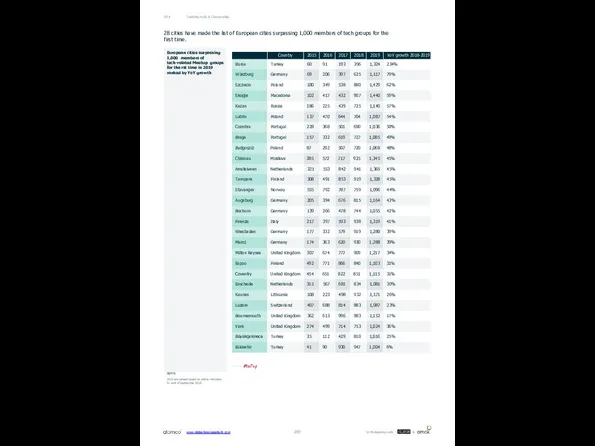
Trending Hubs & Communities
08.4
28 cities have made the list of European
Trending Hubs & Communities
08.4
28 cities have made the list of European
European cities surpassing 1,000 members of tech-related Meetup groups for the rst time in 2019 ranked by YoY growth
NOTE:
2019 annualised based on active members to end of September 2019.
www.stateofeuropeantech.com
In Partnership with
&
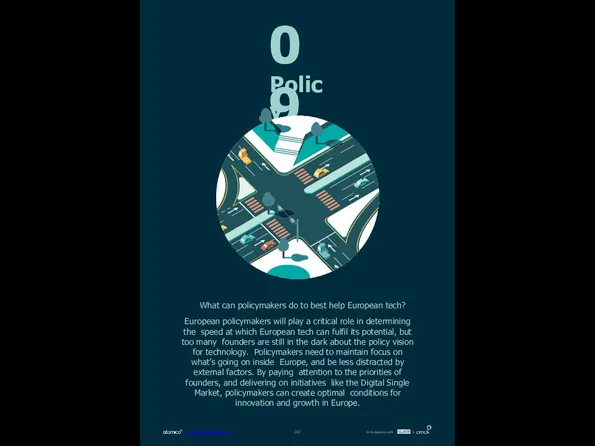
09
Policy
What can policymakers do to best help European tech?
European policymakers will
09
Policy
What can policymakers do to best help European tech?
European policymakers will
www.stateofeuropeantech.com
In Partnership with
&
09.1
Europe Policy Focus
Measuring policy focus in Europe
The data challenge
According to our
09.1
Europe Policy Focus
Measuring policy focus in Europe
The data challenge
According to our
(2014 to 2019) to better understand the policy conversation around a number of key topics for the tech community. The European Parliament, as the body that debates and approves policy legislation, is where we can see the 'end result' of the European policy agenda that is set by the European Commission. In other words, it's a useful proxy for actual policy outcomes that may have a nearer-term impact on the European tech ecosystem. If it were possible, we would extend the analysis to cover the European Commission, which creates and proposes the forward-looking policy agenda for the European Union, to be able to complement this analysis with a longer-term view on future policy focus.
Activities and press releases provide a sense of what is being talked about and the responses to those discussions. Legislative documents on the other end tell us what makes it into draft policies.
Overview of European Parliament data
NOTE:
We look at the number of keyword occurrences relating to a set of selected technology-related topics in the European Parliament.
www.stateofeuropeantech.com
In Partnership with
&
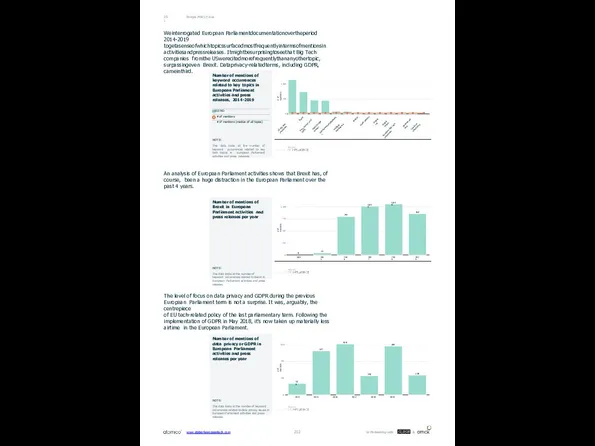
Europe Policy Focus
09.1
Weinterrogated European Parliamentdocumentationovertheperiod 2014-2019 togetasenseofwhichtopicssurfacedmostfrequentlyintermsofmentionsin activitiesandpressreleases. Itmightbesurprisingtoseethat Big Tech
Europe Policy Focus
09.1
Weinterrogated European Parliamentdocumentationovertheperiod 2014-2019 togetasenseofwhichtopicssurfacedmostfrequentlyintermsofmentionsin activitiesandpressreleases. Itmightbesurprisingtoseethat Big Tech
An analysis of European Parliament activities shows that Brexit has, of course, been a huge distraction in the European Parliament over the past 4 years.
The level of focus on data privacy and GDPR during the previous European Parliament term is not a surprise. It was, arguably, the centrepiece
of EU tech-related policy of the last parliamentary term. Following the implementation of GDPR in May 2018, it’s now taken up materially less airtime in the European Parliament.
# of mentions
US big tech companies
Brexit
Data privacy and GDPR
Digital Single Market
Disinformation/deepfakes
Artificial Intelligence
Fintech
Stock options
Digital tax
Digital health
European Big Tech companies
i
Genome ed ting
Quantum computing
0
2,500
5,000
# of mentions
0
43
794
1,011
1,056
853
2014
2015
2016
2017
2018
2019
0
250
500
750
1,000
# of mentions
136
527
610
228
585
238
2014 2015 2016 2017 2018 2019
0
200
400
600
Number of mentions of keyword occurrences related to key topics in European Parliament activities and press releases, 2014-2019
LEGEND
# of mentions
# of mentions (median of all topics)
NOTE:
This data looks at the number of keyword occurrences related to key tech topics in European Parliament activities and press releases.
Number of mentions of Brexit in European Parliament activities and press releases per year
NOTE:
This data looks at the number of keyword occurrences related to Brexit in European Parliament activities and press releases.
Number of mentions of data privacy or GDPR in European Parliament activities and press releases per year
NOTE:
This data looks at the number of keyword occurrences related to data privacy issues in European Parliament activities and press releases.
www.stateofeuropeantech.com
In Partnership with
&
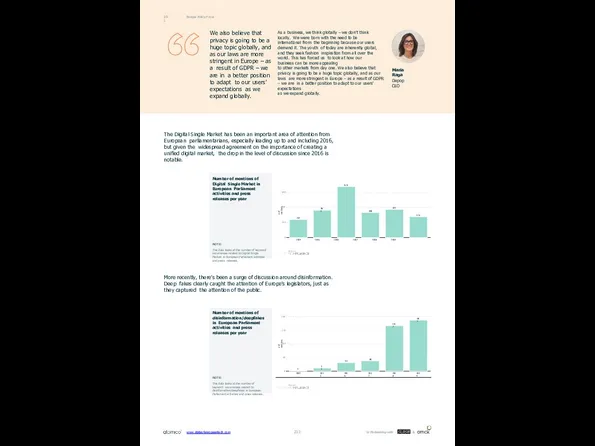
Europe Policy Focus
09.1
We also believe that privacy is going to be
Europe Policy Focus
09.1
We also believe that privacy is going to be
As a business, we think globally – we don’t think locally. We were born with the need to be international from the beginning because our users demand it. The youth of today are inherently global, and they seek fashion inspiration from all over the world. This has forced us to look at how our business can be more appealing
to other markets from day one. We also believe that privacy is going to be a huge topic globally, and as our laws are more stringent in Europe – as a result of GDPR – we are in a better position to adapt to our users’ expectations
as we expand globally.
Maria Raga
Depop CEO
The Digital Single Market has been an important area of attention from European parliamentarians, especially leading up to and including 2016, but given the widespread agreement on the importance of creating a unified digital market, the drop in the level of discussion since 2016 is notable.
More recently, there’s been a surge of discussion around disinformation. Deep fakes clearly caught the attention of Europe’s legislators, just as they captured the attention of the public.
# of mentions
237
361
675
330
372
275
2014 2015 2016 2017 2018 2019
0
200
400
600
# of mentions
2
11
31
38
167
187
2014
2015
2016
2017
2018
2019
0
50
100
150
200
Number of mentions of Digital Single Market in European Parliament activities and press releases per year
NOTE:
This data looks at the number of keyword occurrences related to Digital Single Market in European Parliament activities and press releases.
Number of mentions of disinformation/deepfakes in European Parliament activities and press releases per year
NOTE:
This data looks at the number of keyword occurrences related to disinformation/deepfakes in European Parliament activities and press releases.
www.stateofeuropeantech.com
In Partnership with
&
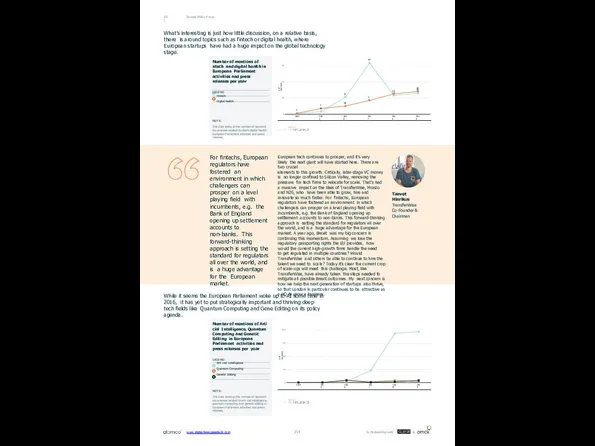
Europe Policy Focus
09.1
What’s interesting is just how little discussion, on a
Europe Policy Focus
09.1
What’s interesting is just how little discussion, on a
# of mentions
3
21
63
23
26
1
7
10
17
25
28
2014
2015
2016
2017
2018
2019
0
20
40
60
Number of mentions of ntech and digital health in European Parliament activities and press releases per year
LEGEND
Fintech Digital health
NOTE:
This data looks at the number of keyword occurrences related to ntech/digital health European Parliament activities and press releases.
For fintechs, European regulators have fostered an environment in which challengers can prosper on a level playing field with incumbents, e.g. the Bank of England opening up settlement accounts to non-banks. This forward-thinking approach is setting the standard for regulators all over the world, and is a huge advantage for the European market.
European tech continues to prosper, and it’s very likely the next giant will have started here. There are two crucial
elements to this growth. Critically, later-stage VC money is no longer confined to Silicon Valley, removing the pressure for tech firms to relocate for scale. That’s had a massive impact on the likes of TransferWise, Monzo and N26, who have been able to grow, hire and innovate so much faster. For fintechs, European regulators have fostered an environment in which challengers can prosper on a level playing field with incumbents, e.g. the Bank of England opening up settlement accounts to non-banks. This forward-thinking approach is setting the standard for regulators all over the world, and is a huge advantage for the European market. A year ago, Brexit was my big concern in continuing this momentum. Assuming we lose the regulatory passporting rights the EU provides, how would the current high-growth firms handle the need
to get regulated in multiple countries? Would TransferWise and others be able to continue to hire the talent we need to scale? Today it’s clear the current crop of scale-ups will meet this challenge. Most, like TransferWise, have already taken the steps needed to mitigate all possible Brexit outcomes. My next concern is how we help the next generation of startups also thrive, so that London in particular continues to be attractive as a HQ to grow a business.
Taavet Hinrikus TransferWise Co-Founder & Chairman
While it seems the European Parliament woke up to AI some time in 2016, it has yet to put strategically important and thriving deep tech fields like Quantum Computing and Gene Editing on its policy agenda.
# of mentions
2014
2015
2016
2017
2018
2019
0
50
100
150
200
Number of mentions of Arti cial Intelligence, Quantum Computing and Genetic Editing in European Parliament activities and press releases per year
LEGEND
Arti cial Intelligence Quantum Computing Genetic Editing
NOTE:
This data looks at the number of keyword occurrences related to arti cial intelligence, quantum computing and genetic editing in European Parliament activities and press releases.
www.stateofeuropeantech.com
In Partnership with
&
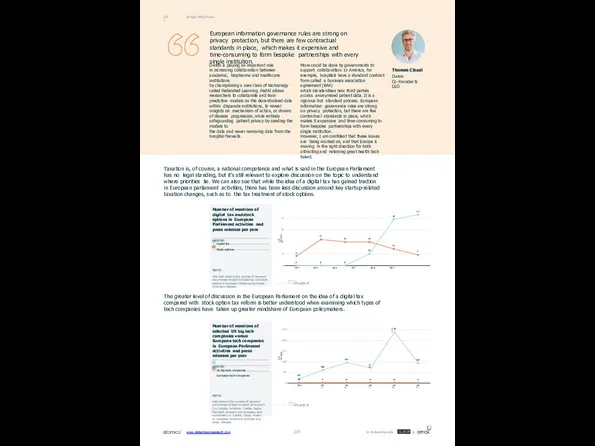
Europe Policy Focus
09.1
European information governance rules are strong on privacy protection,
Europe Policy Focus
09.1
European information governance rules are strong on privacy protection,
Owkin is playing an important role
in increasing collaboration between academic, biopharma and healthcare institutions
by championing a new class of technology called Federated Learning. FedAI allows researchers to collaborate and train predictive models on the decentralised data within disparate institutions, to reveal insights on mechanism of action, or drivers of disease progression, while entirely safeguarding patient privacy by sending the models to
the data and never removing data from the
hospital firewalls.
Thomas Clozel
Owkin
Co-Founder & CEO
Taxation is, of course, a national competence and what is said in the European Parliament has no legal standing, but it’s still relevant to explore discussion on the topic to understand where priorities lie. We can also see that while the idea of a digital tax has gained traction in European parliament activities, there has been less discussion around key startup-related taxation changes, such as to the tax treatment of stock options.
# of mentions
0
0
0
10
39
43
8
22
20
20
14
9
2014 2015 2016 2017 2018 2019
0
10
20
30
40
Number of mentions of digital tax and stock options in European Parliament activities and press releases per year
LEGEND
Digital tax Stock options
NOTE:
This data looks at the number of keyword occurrences related to digital tax and stock options in European Parliament activities and press releases.
More could be done by governments to support collaboration. In America, for example, hospitals have a standard contract form called a business association agreement (BAA)
which standardises how third parties access anonymised patient data. It is a rigorous but standard process. European information governance rules are strong on privacy protection, but there are few contractual standards in place, which makes it expensive and time-consuming to form bespoke partnerships with every single institution.
However, I am confident that these issues are being worked on, and that Europe is moving in the right direction for both attracting and retaining great health tech talent.
The greater level of discussion in the European Parliament on the idea of a digital tax compared with stock option tax reform is better understood when examining which types of tech companies have taken up greater mindshare of European policymakers.
# of mentions
608
954
710
2,381
929
202
10
9
14
14
15
6
2014
2015
2016
2017
2018
2019
0
500
1,000
1,500
2,000
2,500
Number of mentions of selected US big tech companies versus European tech companies in European Parliament activities and press releases per year
LEGEND
US big tech companies European tech companies
NOTE:
Data looks at the number of keyword occurrences related to select US big tech (i.e. Google, Facebook, Twitter, Apple, Microsoft, Amazon) and European tech companies (i.e. Spotify, Skype, Adyen) in European Parliament activities and press releases.
www.stateofeuropeantech.com
In Partnership with
&
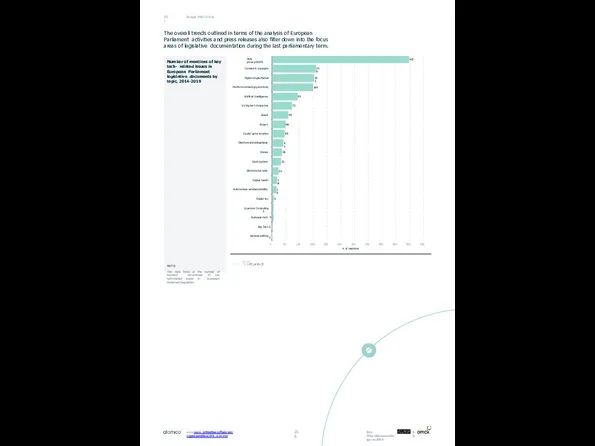
Europe Policy Focus
09.1
The overall trends outlined in terms of the analysis
Europe Policy Focus
09.1
The overall trends outlined in terms of the analysis
497
159
152
149
93
72
59
48
45
41
36
32
23
18
15
6
Data privacy/GDPR
Content & copyright
Digital Single Market
Platform workers/gig economy
Artificial Intelligence
US big tech companies
Brexit
Fintech
Capital gains taxation
Disinformation/deepfakes
Drones
Stock options
Blockchain/crypto
Digital health
Autonomous vehicles/mobility
Digital tax
Quantum Computing 5
European tech 5
Big Tech 2
Genome editing 1
0
50
100
150
200
250
300
# of mentions
350
400
450
500
550
Number of mentions of key tech- related issues in European Parliament legislative documents by topic, 2014-2019
NOTE:
This data looks at the number of keyword occurrences of key tech-related issues in European Parliament legislation.
216
IInn PPaarrttnneerrsshhiipp wwiitthh
&&
wwwwww..ssttaatteeooffeeuurrooppeeaanntteecchh..ccoomm
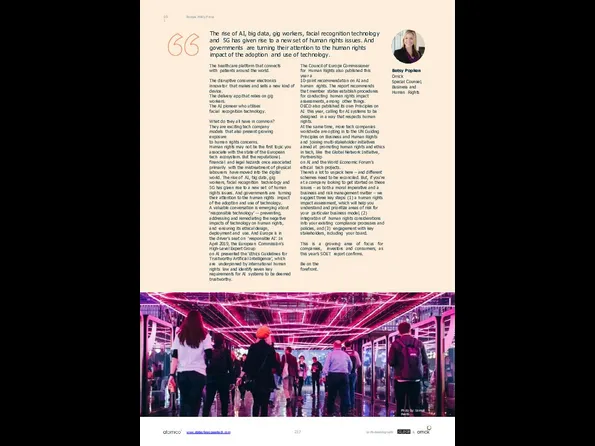
The rise of AI, big data, gig workers, facial recognition technology
The rise of AI, big data, gig workers, facial recognition technology
The healthcare platform that connects with patients around the world.
The disruptive consumer electronics innovator that makes and sells a new kind of device.
The delivery app that relies on gig workers.
The AI pioneer who utilises facial recognition technology.
What do they all have in common?
They are exciting tech company models that also present growing exposure
to human rights concerns.
Human rights may not be the first topic you associate with the state of the European tech ecosystem. But the reputational, financial and legal hazards once associated primarily with the mistreatment of physical labourers have moved into the digital world. The rise of AI, big data, gig workers, facial recognition technology and 5G has given rise to a new set of human rights issues. And governments are turning their attention to the human rights impact of the adoption and use of technology.
A valuable conversation is emerging about ‘responsible technology’ — preventing, addressing and remediating the negative impacts of technology on human rights, and ensuring its ethical design, deployment and use. And Europe is in the driver’s seat on ‘responsible AI’. In April 2019, the European Commission’s High-Level Expert Group
on AI presented the ‘Ethics Guidelines for Trustworthy Artificial Intelligence’, which are underpinned by international human rights law and identify seven key requirements for AI systems to be deemed trustworthy.
Betsy Popken
Orrick
Special Counsel, Business and Human Rights
The Council of Europe Commissioner for Human Rights also published this year a
10-point recommendation on AI and human rights. The report recommends that member states establish procedures for conducting human rights impact assessments, among other things.
OECD also published its own Principles on AI this year, calling for AI systems to be designed in a way that respects human rights.
At the same time, more tech companies worldwide are opting in to the UN Guiding Principles on Business and Human Rights and joining multi-stakeholder initiatives aimed at promoting human rights and ethics in tech, like the Global Network Initiative, Partnership
on AI and the World Economic Forum’s ethical tech projects.
There’s a lot to unpack here – and different schemes need to be reconciled. But, if you’re at a company looking to get started on these issues – as both a moral imperative and a business and risk management matter – we suggest three key steps: (1) a human rights impact assessment, which will help you understand and prioritize areas of risk for your particular business model, (2) integration of human rights considerations into your existing compliance processes and policies, and (3) engagement with key stakeholders, including your board.
This is a growing area of focus for companies, investors and consumers, as this year’s SOET report confirms.
Be on the forefront.
Europe Policy Focus
09.1
Photo by: Samuli Pentti
www.stateofeuropeantech.com
In Partnership with
&
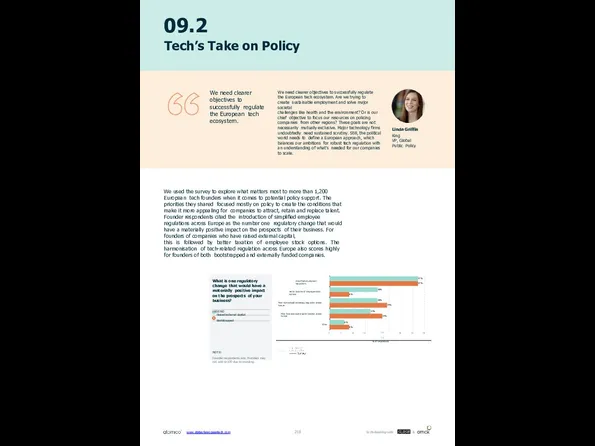
09.2
Tech’s Take on Policy
We need clearer objectives to successfully regulate the
09.2
Tech’s Take on Policy
We need clearer objectives to successfully regulate the
We need clearer objectives to successfully regulate the European tech ecosystem. Are we trying to create sustainable employment and solve major societal
challenges like health and the environment? Or is our chief objective to focus our resources on policing companies from other regions? These goals are not necessarily mutually exclusive. Major technology firms undoubtedly need sustained scrutiny. Still, the political world needs to define a European approach, which balances our ambitions for robust tech regulation with an understanding of what’s needed for our companies to scale.
Linda Griffin
King
VP, Global Public Policy
We used the survey to explore what matters most to more than 1,200 European tech founders when it comes to potential policy support. The priorities they shared focused mostly on policy to create the conditions that make it more appealing for companies to attract, retain and replace talent. Founder respondents cited the introduction of simplified employee regulations across Europe as the number one regulatory change that would have a materially positive impact on the prospects of their business. For founders of companies who have raised external capital,
this is followed by better taxation of employee stock options. The harmonisation of tech-related regulation across Europe also scores highly for founders of both bootstrapped and externally funded companies.
20%
20%
17%
6%
37%
37%
8%
24%
22%
8%
Simplified employment regulations
Better taxation of employee stock options
More harmonised technology regulation across Europe
More favorable capital gains taxation across Europe
Other
0
5
10
15
20 25
% of respondents
30
35
40
What is one regulatory change that would have a materially positive impact on the prospects of your business?
LEGEND
Raised external capital Bootstrapped
NOTE:
Founder respondents only. Numbers may not add to 100 due to rounding.
www.stateofeuropeantech.com
In Partnership with
&
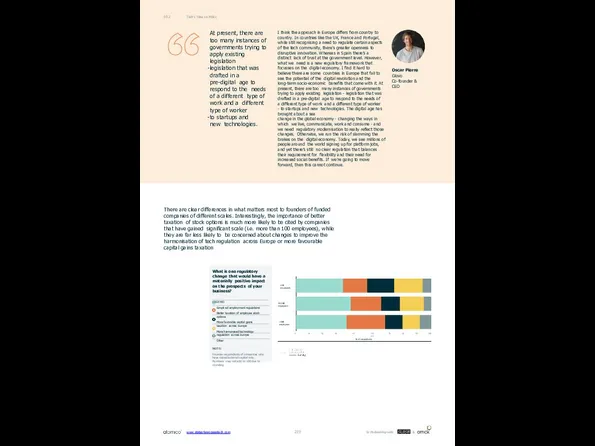
Tech’s Take on Policy
09.2
At present, there are too many instances of
Tech’s Take on Policy
09.2
At present, there are too many instances of
legislation that was drafted in a pre-digital age to respond to the needs of a different type of work and a different type of worker
to startups and new technologies.
I think the approach in Europe differs from country to country. In countries like the UK, France and Portugal, while still recognising a need to regulate certain aspects of the tech community, there’s greater openness to disruptive innovation. Whereas in Spain there’s a distinct lack of trust at the government level. However, what we need is a new regulatory framework that focusses on the digital economy. I find it hard to believe there are some countries in Europe that fail to see the potential of the digital revolution and the long-term socio-economic benefits that come with it. At present, there are too many instances of governments trying to apply existing legislation - legislation that was drafted in a pre-digital age to respond to the needs of a different type of work and a different type of worker - to startups and new technologies. The digital age has brought about a sea
change in the global economy - changing the ways in which we live, communicate, work and consume - and we need regulatory modernisation to really reflect those changes. Otherwise, we run the risk of slamming the brakes on the digital economy. Today, we see millions of people around the world signing up for platform jobs, and yet there’s still no clear regulation that balances their requirement for flexibility and their need for increased social benefits. If we’re going to move forward, then this cannot continue.
Oscar Pierre
Glovo
Co-founder & CEO
There are clear differences in what matters most to founders of funded companies of different scales. Interestingly, the importance of better taxation of stock options is much more likely to be cited by companies that have gained significant scale (i.e. more than 100 employees), while they are far less likely to be concerned about changes to improve the harmonisation of tech regulation across Europe or more favourable capital gains taxation
≤10 employees
11-100 employees
>100 employees
0
10
20
30
40 50 60
% of respondents
70
80
90
100
What is one regulatory change that would have a materially positive impact on the prospects of your business?
LEGEND
Simpli ed employment regulations
Better taxation of employee stock options
More favorable capital gains taxation across Europe
More harmonised technology regulation across Europe
Other
NOTE:
Founder respondents of companies who have raised external capital only. Numbers may not add to 100 due to rounding.
www.stateofeuropeantech.com
In Partnership with
&
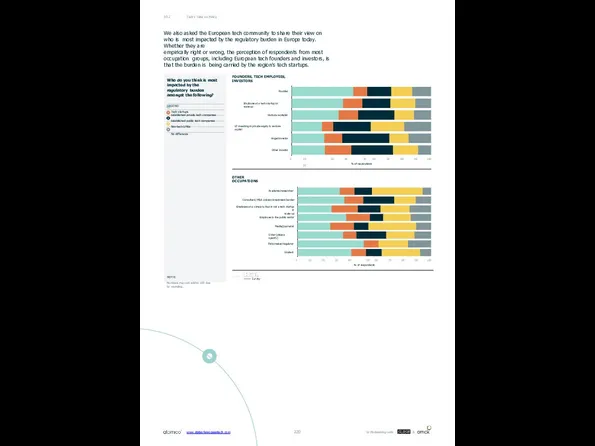
Tech’s Take on Policy
09.2
Academic/researcher
Consultant/ M&A advisor/investment banker
Employee at a company that
Tech’s Take on Policy
09.2
Academic/researcher
Consultant/ M&A advisor/investment banker
Employee at a company that
scale-up
Employee in the public sector
Media/journalist
Other (please specify)
Policymaker/regulator
Student
0
10
20
30
40 50
% of respondents
60
70
80
90
100
Founder
Employee at a tech startup or scale-up
Venture capitalist
LP investing in private equity & venture capital
Angel investor
Other investor
0
10 20
30
40 50
% of respondents
60
70
80
90
100
OTHER OCCUPATIONS
FOUNDERS, TECH EMPLOYEES, INVESTORS
Who do you think is most impacted by the regulatory burden amongst the following?
LEGEND
Tech startups
Established private tech companies Established public tech companies Non-tech SMEs
No difference
NOTE:
Numbers may not add to 100 due to rounding.
We also asked the European tech community to share their view on who is most impacted by the regulatory burden in Europe today. Whether they are
empirically right or wrong, the perception of respondents from most occupation groups, including European tech founders and investors, is that the burden is being carried by the region’s tech startups.
220
www.stateofeuropeantech.com
In Partnership with
&
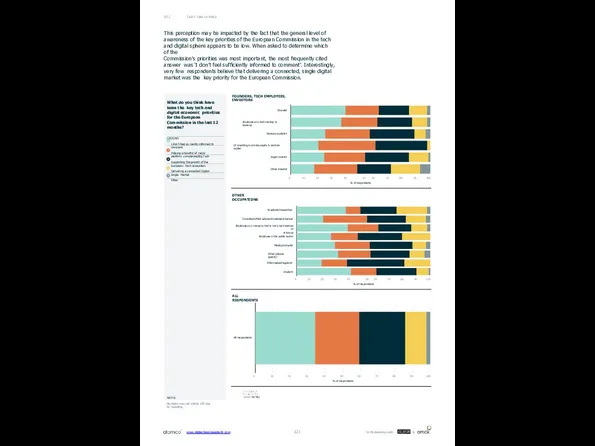
Tech’s Take on Policy
09.2
Academic/researcher
Consultant/M&A advisor/investment banker
Employee at a company that is
Tech’s Take on Policy
09.2
Academic/researcher
Consultant/M&A advisor/investment banker
Employee at a company that is
scale-up
Employee in the public sector
Media/journalist
Other (please specify)
Policymaker/regulator
Student
0
10
20
30
40 50
% of respondents
60
70
80
90
100
All respondents
0
10
20
30
40
50
% of respondents
60
70
80
90
100
Founder
Employee at a tech startup or scale-up
Venture capitalist
LP investing in private equity & venture capital
Angel investor
Other investor
0
10
20
30
40 50
% of respondents
60
70
80
90
100
OTHER OCCUPATIONS
ALL RESPONDENTS
FOUNDERS, TECH EMPLOYEES, INVESTORS
What do you think have been the key tech and digital economic priorities for the European Commission in the last 12 months?
LEGEND
I don't feel su ciently informed to comment
Policing a handful of major platform companies/Big Tech
Supporting the growth of the European Tech ecosystem
Delivering a connected Digital Single Market
Other
NOTE:
Numbers may not add to 100 due to rounding.
This perception may be impacted by the fact that the general level of awareness of the key priorities of the European Commission in the tech and digital sphere appears to be low. When asked to determine which of the
Commission’s priorities was most important, the most frequently cited answer was ‘I don’t feel sufficiently informed to comment’. Interestingly, very few respondents believe that delivering a connected, single digital market was the key priority for the European Commission.
www.stateofeuropeantech.com
In Partnership with
&
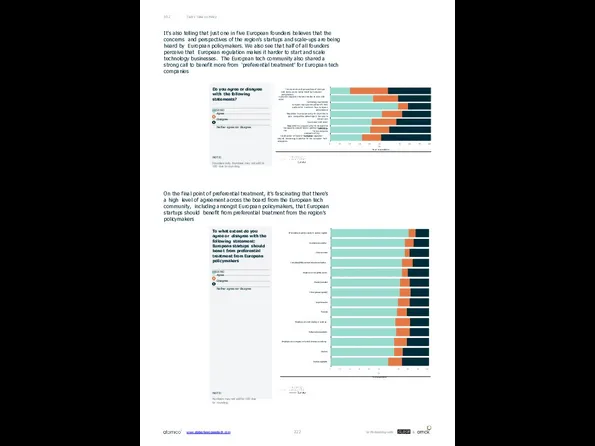
Tech’s Take on Policy
09.2
It’s also telling that just one in five
Tech’s Take on Policy
09.2
It’s also telling that just one in five
On the final point of preferential treatment, it’s fascinating that there’s a high level of agreement across the board from the European tech community, including amongst European policymakers, that European startups should benefit from preferential treatment from the region’s policymakers
The concerns and perspectives of startups and scaleups are being heard by European policymakers
European regulation makes it harder to start and scale
technology businesses
European startups should benefit from preferential treatment from European policymakers
Regulation is an opportunity for countries to gain competitive advantage in the race to attract tech
investment and talent
Regulation is an opportunity for competitive advantage
for my company
Deregulation would have a positive impact on the
prospects of my company
The direction of travel of European regulation around technology is positive for the European Tech ecosystem
0
10
20
30
40
50 60
% of respondents
70
80
90
100
LP investing in private equity & venture capital
Academic/researcher
Other investor
Consultant/M&A advisor/investment banker
Employee in the public sector
Media/journalist
Other (please specify)
Angel investor
Founder
Employee at a tech startup or scale-up
Policymaker/regulator
Employee at a company not a tech startup or scale-up
Student
Venture capitalist
0
10
20
30
40
50 60
% of respondents
70
80
90
100
Do you agree or disagree with the following statements?
LEGEND
Agree Disagree
Neither agree nor disagree
NOTE:
Founders only. Numbers may not add to 100 due to rounding.
To what extent do you agree or disagree with the following statement: European startups should bene t from preferential treatment from European policymakers
LEGEND
Agree Disagree
Neither agree nor disagree
NOTE:
Numbers may not add to 100 due to rounding.
www.stateofeuropeantech.com
In Partnership with
&
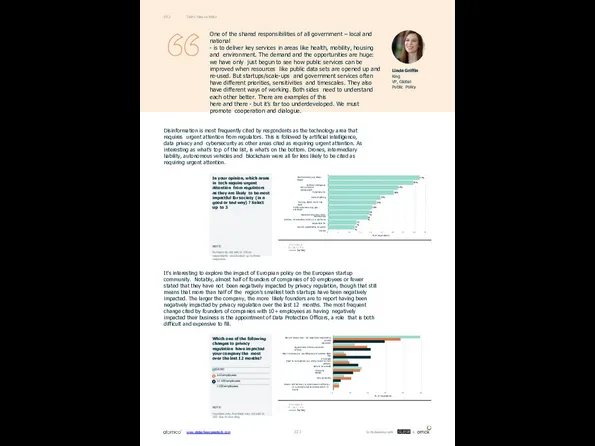
Tech’s Take on Policy
09.2
One of the shared responsibilities of all government
Tech’s Take on Policy
09.2
One of the shared responsibilities of all government
- is to deliver key services in areas like health, mobility, housing and environment. The demand and the opportunities are huge: we have only just begun to see how public services can be improved when resources like public data sets are opened up and re-used. But startups/scale-ups and government services often have different priorities, sensitivities and timescales. They also have different ways of working. Both sides need to understand each other better. There are examples of this
here and there - but it’s far too underdeveloped. We must promote cooperation and dialogue.
Linda Griffin
King
VP, Global Public Policy
Disinformation is most frequently cited by respondents as the technology area that requires urgent attention from regulators. This is followed by artificial intelligence, data privacy and cybersecurity as other areas cited as requiring urgent attention. As interesting as what’s top of the list, is what’s on the bottom. Drones, intermediary liability, autonomous vehicles and blockchain were all far less likely to be cited as requiring urgent attention.
It’s interesting to explore the impact of European policy on the European startup community. Notably, almost half of founders of companies of 10 employees or fewer stated that they have not been negatively impacted by privacy regulation, though that still means that more than half of the region’s smallest tech startups have been negatively impacted. The larger the company, the more likely founders are to report having been negatively impacted by privacy regulation over the last 12 months. The most frequent change cited by founders of companies with 10+ employees as having negatively impacted their business is the appointment of Data Protection Officers, a role that is both difficult and expensive to fill.
42%
39%
32%
30%
24%
22%
20%
19%
18%
13%
12%
Disinformation (e.g. deep fakes)
Artificial Intelligence
Data privacy & management
Cybersecurity
Genetic editing
Tax (e.g. digital tax for big tech)
Platform workers (e.g. gig economy)
Blockchain/cryptocurrency
Autonomous vehicles Intermediary liability (i.e. platforms responsible for
content uploaded by its users)
Drones
0
5
10
15
20
25
% of respondents
30
35
40
45
None of these areas - not negatively impacted by privacy
regulation
Appointment of data protection officers
Right to access (i.e. providing copy of personal data free
of charge)
Right to be forgotten (i.e. ability to ask for their personal
data to be erased)
Privacy by design
Data portability
Breach notifications (i.e. data breach notification to customers and controllers within 72 hours)
0
10
20
30
% of respondents
40
50
In your opinion, which areas in tech require urgent attention from regulators as they are likely to be most impactful for society (in a good or bad way) ? Select up to 3
NOTE:
Numbers do not add to 100 as respondents could select up to three responses.
Which one of the following changes to privacy regulation have impacted your company the most over the last 12 months?
LEGEND
≤10 employees
11-100 employees
>100 employees
NOTE:
Founders only. Numbers may not add to 100 due to rounding.
www.stateofeuropeantech.com
In Partnership with
&
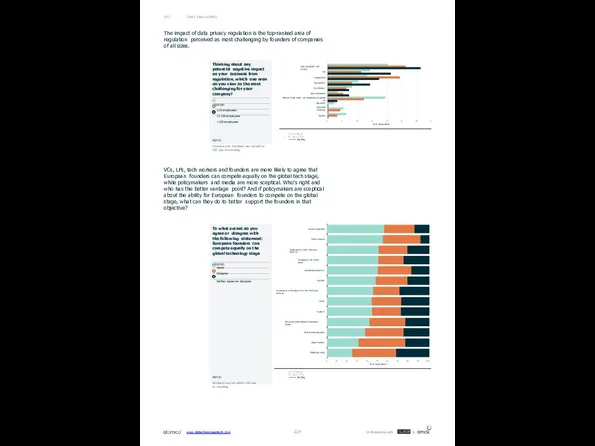
Tech’s Take on Policy
09.2
The impact of data privacy regulation is the
Tech’s Take on Policy
09.2
The impact of data privacy regulation is the
VCs, LPs, tech workers and founders are more likely to agree that European founders can compete equally on the global tech stage, while policymakers and media are more sceptical. Who’s right and who has the better vantage point? And if policymakers are sceptical about the ability for European founders to compete on the global stage, what can they do to better support the founders in that objective?
Data protection and privacy
Tax
Employment
Competition
Certification
Data localisation
None of these areas - not negatively impacted by
regulation
Copyright
Licensing
Patents
0
5
10
15
20
% of respondents
25
30
3
Venture capitalist
Other investor
Employee at a tech startup or scale-up
Employee in the public sector
Academic/researcher
Founder
Employee at a company not a tech startup or scale-up
Other
Student
Consultant/M&A advisor/investment banker
Policymaker/regulator
Angel investor
Media/journalist
0
10
20
30
40
50
% of respondents
60
70
80
90
100
Thinking about any potential negative impact on your business from regulation, which one area do you view as the most challenging for your company?
LEGEND
≤10 employees
11-100 employees
>100 employees
NOTE:
Founders only. Numbers may not add to 100 due to rounding.
To what extent do you agree or disagree with the following statement: European founders can compete equally on the global technology stage
LEGEND
Agree Disagree
Neither agree nor disagree
NOTE:
Numbers may not add to 100 due to rounding.
www.stateofeuropeantech.com
In Partnership with
&
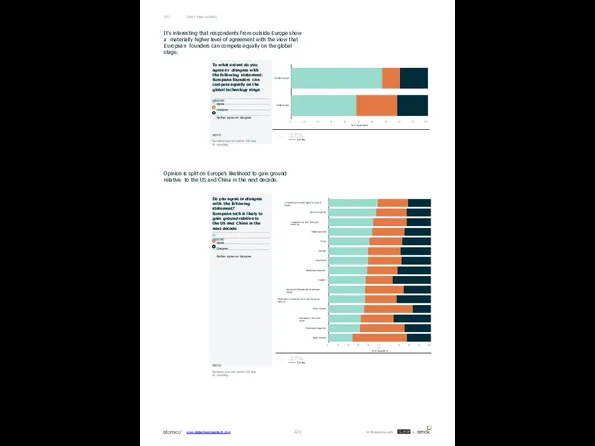
Tech’s Take on Policy
09.2
It’s interesting that respondents from outside Europe show
Tech’s Take on Policy
09.2
It’s interesting that respondents from outside Europe show
Opinion is split on Europe’s likelihood to gain ground relative to the US and China in the next decade.
Outside Europe
Inside Europe
0
10
20
30
40
50
% of respondents
60
70
80
90
100
LP investing in private equity & venture capital
Venture capitalist
Employee at a tech startup or scale-up
Media/journalist
Other
Founder
Grand total
Academic/researcher
Student
Consultant/M&A advisor/investment banker
Employee at a company not a tech startup or scale-up
Other investor
Employee in the public sector
Policymaker/regulator
Angel investor
0
10
20
30
40
50 60
% of respondents
70
80
90
100
To what extent do you agree or disagree with the following statement: European founders can compete equally on the global technology stage
LEGEND
Agree Disagree
Neither agree nor disagree
NOTE:
Numbers may not add to 100 due to rounding.
Do you agree or disagree with the following statement?
European tech is likely to gain ground relative to the US and China in the next decade
LEGEND
Agree Disagree
Neither agree nor disagree
NOTE:
Numbers may not add to 100 due to rounding.
www.stateofeuropeantech.com
In Partnership with
&
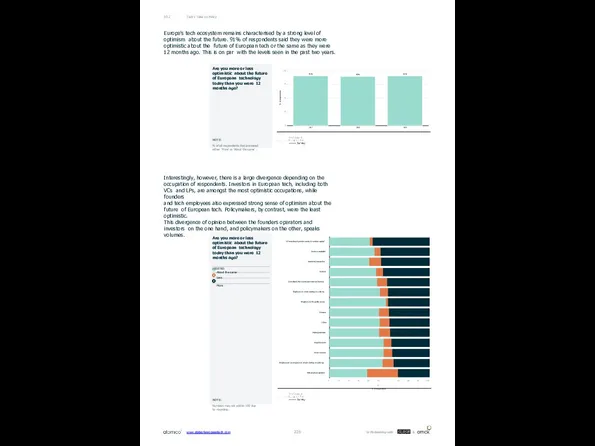
Tech’s Take on Policy
09.2
Europe’s tech ecosystem remains characterised by a strong
Tech’s Take on Policy
09.2
Europe’s tech ecosystem remains characterised by a strong
Interestingly, however, there is a large divergence depending on the occupation of respondents. Investors in European tech, including both VCs and LPs, are amongst the most optimistic occupations, while founders
and tech employees also expressed strong sense of optimism about the future of European tech. Policymakers, by contrast, were the least optimistic.
This divergence of opinion between the founders operators and investors on the one hand, and policymakers on the other, speaks volumes.
% of respondents
91%
90%
91%
2017
2018
2019
0
25
50
75
100
LP investing in private equity & venture capital
Venture capitalist
Academic/researcher
Student
Consultant/M&A advisor/investment banker
Employee at a tech startup or scale-up
Employee in the public sector
Founder
Other
Media/journalist
Angel investor
Other investor
Employee at a company not a tech startup or scale-up
Policymaker/regulator
0
10
20
30
40
50 60
% of respondents
70
80
90
100
Are you more or less optimistic about the future of European technology today than you were 12 months ago?
NOTE:
% of all respondents that answered either 'More' or 'About the same' .
Are you more or less optimistic about the future of European technology today than you were 12 months ago?
LEGEND
About the same Less
More
NOTE:
Numbers may not add to 100 due to rounding.
www.stateofeuropeantech.com
In Partnership with
&
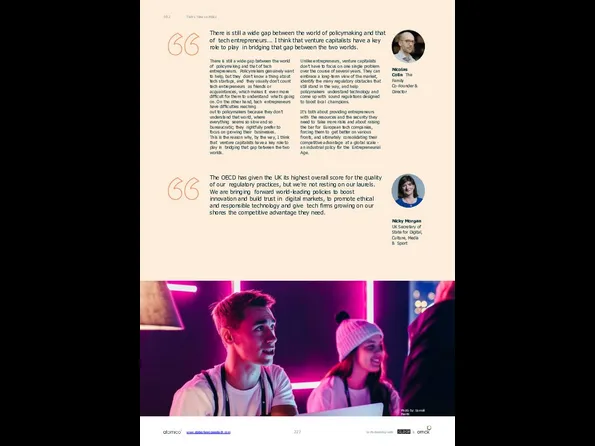
Tech’s Take on Policy
09.2
There is still a wide gap between the
Tech’s Take on Policy
09.2
There is still a wide gap between the
There is still a wide gap between the world of policymaking and that of tech entrepreneurs. Policymakers genuinely want to help, but they don’t know a thing about tech startups, and they usually don’t count tech entrepreneurs as friends or acquaintances, which makes it even more difficult for them to understand what’s going on. On the other hand, tech entrepreneurs have difficulties reaching
out to policymakers because they don’t understand that world, where everything seems so slow and so bureaucratic; they rightfully prefer to focus on growing their businesses.
This is the reason why, by the way, I think that venture capitalists have a key role to play in bridging that gap between the two worlds.
Nicolas Colin The Family Co-Founder & Director
The OECD has given the UK its highest overall score for the quality of our regulatory practices, but we're not resting on our laurels. We are bringing forward world-leading policies to boost innovation and build trust in digital markets, to promote ethical and responsible technology and give tech firms growing on our shores the competitive advantage they need.
Nicky Morgan UK Secretary of State for Digital,
Culture, Media & Sport
Unlike entrepreneurs, venture capitalists don’t have to focus on one single problem over the course of several years. They can embrace a long-term view of the market, identify the many regulatory obstacles that still stand in the way, and help policymakers understand technology and come up with sound regulations designed to boost local champions.
It’s both about providing entrepreneurs with the resources and the security they need to take more risks and about raising the bar for European tech companies, forcing them to get better on various fronts, and ultimately consolidating their competitive advantage at a global scale - an industrial policy for the Entrepreneurial Age.
Photo by: Samuli Pentti
www.stateofeuropeantech.com
In Partnership with
&
10
About
This report was produced in partnership with Slush and Orrick. Nearly
10
About
This report was produced in partnership with Slush and Orrick. Nearly
www.stateofeuropeantech.com
In Partnership with
&
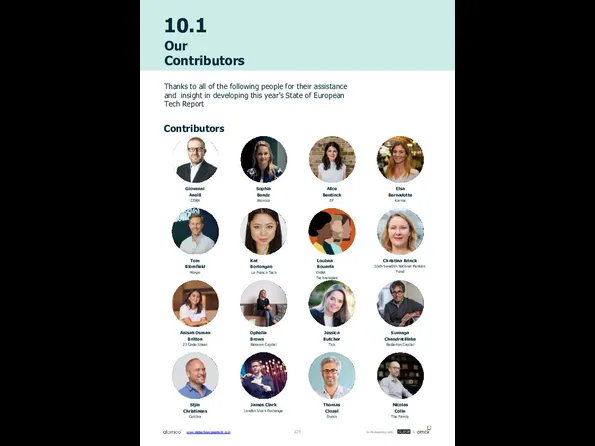
10.1
Our Contributors
Thanks to all of the following people for their assistance
10.1
Our Contributors
Thanks to all of the following people for their assistance
Contributors
Giovanni Anelli
CERN
Alice Bentinck
EF
Sophia Bendz
Atomico
Elsa Bernadotte
Karma
Tom Blomfield
Monzo
Loubna Bouarfa
OKRA Technologies
Kat Borlongan
La French Tech
Christina Brinck
Sixth Swedish National Pension Fund
Anisah Osman Britton
23 Code Street
Jessica Butcher
Tick
Ophelia Brown
Blossom Capital
Suranga Chandratillake
Balderton Capital
Stjin Christiaens
Collibra
Thomas Clozel
Owkin
James Clark
London Stock Exchange
Nicolas Colin
The Family
www.stateofeuropeantech.com
In Partnership with
&
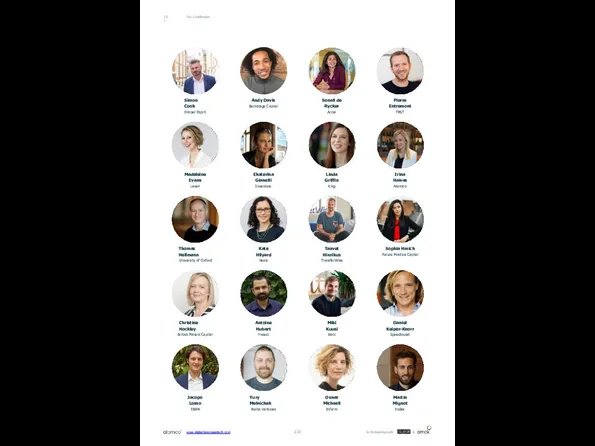
Andy Davis
Backstage Capital
Our Contributors
10.1
Simon Cook
Draper Esprit
Pierre Entremont
FRST
Sonali de Rycker
Accel
Madeleine Evans
Levell
Ekaterina Gianelli
Inventure
Irina
Andy Davis
Backstage Capital
Our Contributors
10.1
Simon Cook
Draper Esprit
Pierre Entremont
FRST
Sonali de Rycker
Accel
Madeleine Evans
Levell
Ekaterina Gianelli
Inventure
Irina
Atomico
Linda Griffin
King
Thomas Hellmann
University of Oxford
Kate Hilyard
Healx
Sophia Hmich
Future Positive Capital
Taavet Hinrikus
TransferWise
Christine Hockley
British Patient Capital
Antoine Hubert
Ynsect
Daniel Keiper-Knorr
Speedinvest
Miki Kuusi
Wolt
Jacopo Losso
EBAN
Yury Melnichek
Bulba Ventures
Martin Mignot
Index
Osnat Michaeli
Infarm
www.stateofeuropeantech.com
In Partnership with
&
Our Contributors
10.1
Leila Rastegar Zegna
Kindred Capital
Niklas Zennström
Atomico
Nicky Morgan
UK Secretary of State for
Our Contributors
10.1
Leila Rastegar Zegna
Kindred Capital
Niklas Zennström
Atomico
Nicky Morgan
UK Secretary of State for
Steve O’Hear
TechCrunch
Akshay Naheta
SoftBank Vision Fund
Deborah Okenla
YSYS
Patrick Pichette
Inovia Capital
Maria Raga
Depop
Oscar Pierre
Glovo
Andreas Saari
Slush
Abby Scarborough
Yena
Perry Teicher
Orrick
Naren Shaam
Omio
Alex Terrien
Future Positive Capital
Nigel Toon
Graphcore
Check Warner
Diversity VC
Roxanne Varza
Station F
David York
Top Tier Capital Partners
Valentina Milanova
Daye
www.stateofeuropeantech.com
In Partnership with
&
10.2
Acknowledgements
We wouldn’t have been able to put together the State of
10.2
Acknowledgements
We wouldn’t have been able to put together the State of
Acknowledgements
Anastasiya Dudareva
Craft
Yuliya Chernova
Craft
Matt Collins
Studio Lovelock
James Clark
London Stock Exchange
George Clayton
Studio Lovelock
Katelyn Dennis
Shareworks
Mike Allanson
Studio Lovelock
Giovanni Anelli
European Organization for Nuclear Research (CERN)
Kaloyan Andonov
Global University Venturing
Karl Bjelland
Politico
Jon Brewer
Orrick
Ivan Draganov
Dealroom
www.stateofeuropeantech.com
In Partnership with
&
Our Contributors
10.1
Sarah Guemouri
Atomico
Ben Jakob
Studio Lovelock
Thierry Heles
Global University Venturing
Ant Jumratsilpa
Studio Lovelock
Oscar Farres
EIF
Mark
Our Contributors
10.1
Sarah Guemouri
Atomico
Ben Jakob
Studio Lovelock
Thierry Heles
Global University Venturing
Ant Jumratsilpa
Studio Lovelock
Oscar Farres
EIF
Mark
Studio Lovelock
Rugiyya Gahramanli
London Stock Exchange
Sofian Giuroiu
PEREP Analytics/EDC
Bryce Keane
Atomico
Thomas Kösters
European Startup Initiative
Julie Kim
Quid
Julien Krantz
Invest Europe
Joe Lovelock
Studio Lovelock
Ilya Levtov
Craft
Gligor Micajkov
Dealroom
Elissa Maercklein
Craft
www.stateofeuropeantech.com
In Partnership with
&
Our Contributors
10.1
Tom Wehmeier
Atomico
Yoram Wijngaarde
Dealroom
The purpose-driven porpoise
Self-employed
Maxine Smith
Atomico
Eleanor Warnock
Atomico
Karthik Suresh
Craft
Julia Silge
Stack Overflow
Anais
Our Contributors
10.1
Tom Wehmeier
Atomico
Yoram Wijngaarde
Dealroom
The purpose-driven porpoise
Self-employed
Maxine Smith
Atomico
Eleanor Warnock
Atomico
Karthik Suresh
Craft
Julia Silge
Stack Overflow
Anais
European Organization for Nuclear Research (CERN)
Julien Puls
Dealroom
Elmo Pakkanen
Slush
Angelina Panagiotopoulou
Studio Lovelock
www.stateofeuropeantech.com
In Partnership with
&
10.3
About Atomico
10.4
About Orrick
www.stateofeuropeantech.com
In Partnership with
&
But who is Orrick?
Creators. Visionaries. Underdogs. The
10.3
About Atomico
10.4
About Orrick
www.stateofeuropeantech.com
In Partnership with
&
But who is Orrick?
Creators. Visionaries. Underdogs. The
We’re Atomico. You probably knew that already.
But who are we really?
We’re not a traditional venture capital firm.
We are built by founders for founders. Every single aspect of Atomico, every part of our culture, and every decision we take, is designed with the sole ambition
of helping our partners succeed.
We exist for more than returns. We believe entrepreneurs are the ultimate agents
of positive, transformational change across every aspect of our society and economy.
Our mission is to spur this progress forward.
It’s why we partner with the world’s most ambitious founders. The rule-breakers who want to build the next leader in their category. The world-shapers creating companies that fundamentally shift the way we live today. The gamechangers using technology to rewire the world in favour of something better, for as many people as possible.
When we find these people, we invest much more than money. We work hand-in-glove with them, drawing on hard-won experience scaling some of the most successful technology companies in the world.
Orrick counsels more than 2,700 tech companies, as well as the most active funds, corporate venture investors and public tech companies worldwide. We help you disrupt. We help you build. We protect you. We help you win.
We are the No. 1 most active law firm in European venture capital, No. 3
globally (PitchBook), top 15 for global M&A (Bloomberg) and advisors to seven of the
top 15 global private equity funds. We offer destination practices in other areas that are important to tech companies’ success: privacy and cybersecurity, intellectual property, payments, and beyond.
And we innovate not only in our legal advice but also in the way we deliver our services. That’s why Financial Times has named us the most innovative law firm in North America for the last three years in a row.
10.4
About Slush
10.5
About Studio Lovelock
www.stateofeuropeantech.com
In Partnership with
&
Once again we’ve partnered with Slush
to
10.4
About Slush
10.5
About Studio Lovelock
www.stateofeuropeantech.com
In Partnership with
&
Once again we’ve partnered with Slush
to
But why are so many people flocking
to Helsinki in November?
Branding to engage and inspire
Studio Lovelock partners with ambitious scale-ups ready to embrace the power of brand to drive growth
Slush is a student-driven, not-for-profit movement with the mission
to create and help the next generation of groundbreaking entrepreneurs.
The Slush year culminates in Helsinki in November, when 25,000 founders, investors, media and executives from 130+ countries gather in Helsinki.
Held during the darkest time of the year, Slush has always been characterized by a unique energy and enthusiasm.
Slush is run by a community of students who want to radically change how entrepreneurship is perceived in Northern Europe and beyond. Several successful entrepreneurs, from the founders of Supercell and Spotify among others, have already become a part of the not-for-profit initiative that has already become a movement
of global magnitude.
Studio Lovelock is a branding and communications design agency based in London.
We are a collection of open-minded, smart and creatively restless folk, driven to help the businesses we believe in achieve great things. We are founded on the belief that creativity and clear design thinking are critical components in the long term success of any business. We pride ourselves on our willingness to push beyond our comfort zone and the quality of the relationships we’ve built with our clients.
Being friendly, helpful and reliable doesn’t hurt either. View more of our work at studiolovelock.com
11
Appendix
Last but not least
www.stateofeuropeantech.com
In Partnership with
&
11
Appendix
Last but not least
www.stateofeuropeantech.com
In Partnership with
&
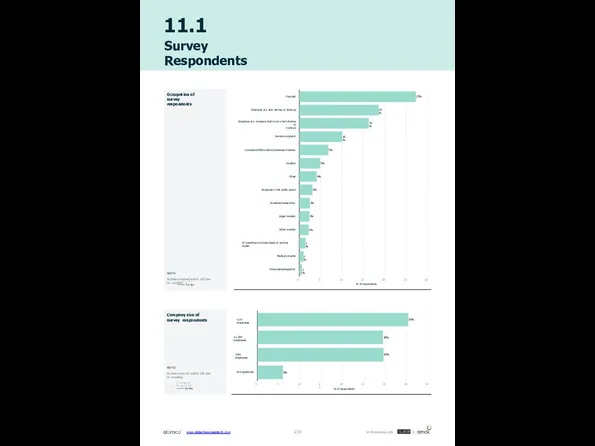
11.1
Survey Respondents
27%
19%
16%
10%
7%
5%
4%
3%
2%
2%
2%
1%
1%
1%
Founder
Employee at a tech startup or scale-up
Employee at a company
11.1
Survey Respondents
27%
19%
16%
10%
7%
5%
4%
3%
2%
2%
2%
1%
1%
1%
Founder
Employee at a tech startup or scale-up
Employee at a company
scale-up
Venture capitalist
Consultant/M&A advisor/investment banker
Student
Other
Employee in the public sector
Academic/researcher
Angel investor
Other investor
LP investing in private equity & venture capital
Media/journalist
Policymaker/regulator
0
5
10
15
% of respondents
20
25
30
Occupation of survey respondents
NOTE:
Numbers may not add to 100 due to rounding.
35%
29%
30%
6%
≤10 employees
11-100 employees
100+ employees
Not applicable
0
5
10
15
20
% of respondents
25
30
35
40
Company size of survey respondents
NOTE:
Numbers may not add to 100 due to rounding.
www.stateofeuropeantech.com
In Partnership with
&
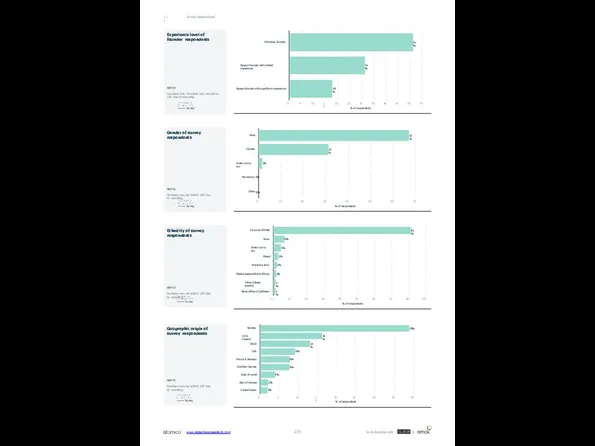
Survey Respondents
11.1
67%
31%
2%
Male
Female
Prefer not to say
Non-binary 0%
Other 0%
0
10
20
30
40
% of respondents
50
60
70
Gender of survey
Survey Respondents
11.1
67%
31%
2%
Male
Female
Prefer not to say
Non-binary 0%
Other 0%
0
10
20
30
40
% of respondents
50
60
70
Gender of survey
NOTE:
Numbers may not add to 100 due to rounding.
% of respondents
51%
31%
18%
First-time founder
Repeat founder with limited experience
Repeat founder with significant experience
0
5
10
15
20
25
30
35
40
45
50
55
Experience level of founder respondents
NOTE:
Founders only. Numbers may not add to 100 due to rounding.
81%
6%
4%
3%
2%
2%
1%
1%
Caucasian/White
Asian
Prefer not to say
Mixed
Hispanic/Latinx
Middle Eastern/North African
Other (please specify)
Black/African/Caribbean
0
10
20
30
40
50
% of respondents
60
70
80
90
Ethnicity of survey respondents
NOTE:
Numbers may not add to 100 due to rounding.
39%
16%
13%
9%
8%
8%
4%
2%
2%
Nordics
UK & Ireland
DACH
CEE
France & Benelux
Southern Europe
Rest of world
Rest of Europe
United States
0
5
10
15
20 25
% of respondents
30
35
40
Geographic origin of survey respondents
NOTE:
Numbers may not add to 100 due to rounding.
www.stateofeuropeantech.com
In Partnership with
&
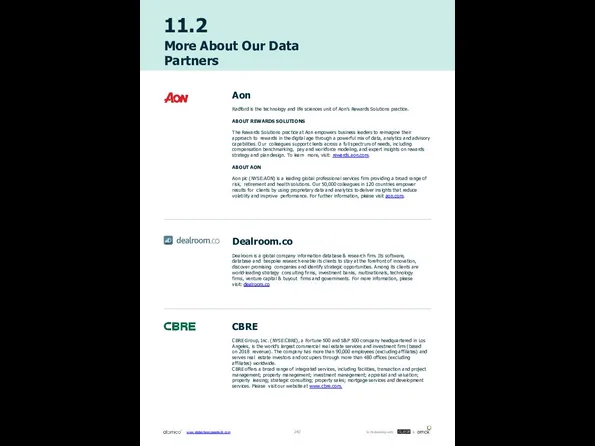
11.2
More About Our Data Partners
Aon
Radford is the technology and life sciences
11.2
More About Our Data Partners
Aon
Radford is the technology and life sciences
ABOUT REWARDS SOLUTIONS
The Rewards Solutions practice at Aon empowers business leaders to reimagine their approach to rewards in the digital age through a powerful mix of data, analytics and advisory capabilities. Our colleagues support clients across a full spectrum of needs, including compensation benchmarking, pay and workforce modeling, and expert insights on rewards strategy and plan design. To learn more, visit: rewards.aon.com.
ABOUT AON
Aon plc (NYSE:AON) is a leading global professional services firm providing a broad range of risk, retirement and health solutions. Our 50,000 colleagues in 120 countries empower results for clients by using proprietary data and analytics to deliver insights that reduce volatility and improve performance. For further information, please visit aon.com.
Dealroom.co
Dealroom is a global company information database & research firm. Its software, database and bespoke research enable its clients to stay at the forefront of innovation, discover promising companies and identify strategic opportunities. Among its clients are world-leading strategy consulting firms, investment banks, multinationals, technology firms, venture capital & buyout firms and governments. For more information, please visit: dealroom.co
CBRE
CBRE Group, Inc. (NYSE:CBRE), a Fortune 500 and S&P 500 company headquartered in Los Angeles, is the world’s largest commercial real estate services and investment firm (based on 2018 revenue). The company has more than 90,000 employees (excluding affiliates) and serves real estate investors and occupiers through more than 480 offices (excluding affiliates) worldwide.
CBRE offers a broad range of integrated services, including facilities, transaction and project management; property management; investment management; appraisal and valuation; property leasing; strategic consulting; property sales; mortgage services and development services. Please visit our website at www.cbre.com.
www.stateofeuropeantech.com
In Partnership with
&
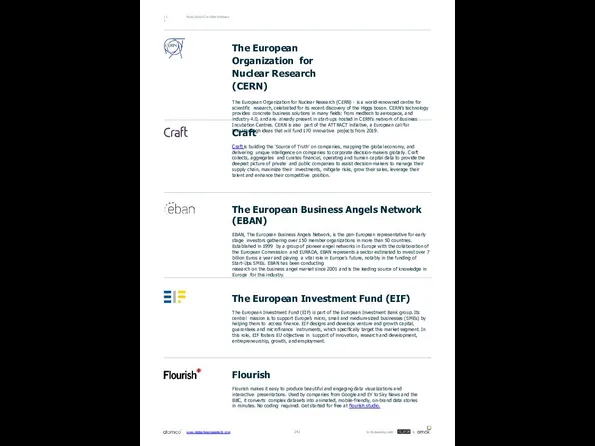
More About Our Data Partners
11.2
The European Business Angels Network (EBAN)
EBAN, The
More About Our Data Partners
11.2
The European Business Angels Network (EBAN)
EBAN, The
research on the business angel market since 2001 and is the leading source of knowledge in Europe for this industry.
Flourish
Flourish makes it easy to produce beautiful and engaging data visualizations and interactive presentations. Used by companies from Google and EY to Sky News and the BBC, it converts complex datasets into animated, mobile-friendly, on-brand data stories in minutes. No coding required. Get started for free at flourish.studio.
The European Investment Fund (EIF)
The European Investment Fund (EIF) is part of the European Investment Bank group. Its central mission is to support Europe’s micro, small and medium-sized businesses (SMEs) by helping them to access finance. EIF designs and develops venture and growth capital, guarantees and microfinance instruments, which specifically target this market segment. In this role, EIF fosters EU objectives in support of innovation, research and development, entrepreneurship, growth, and employment.
The European Organization for Nuclear Research (CERN)
The European Organization for Nuclear Research (CERN) - is a world-renowned centre for scientific research, celebrated for its recent discovery of the Higgs boson. CERN’s technology provides concrete business solutions in many fields: from medtech to aerospace, and industry 4.0, and are already present in start-ups hosted in CERN’s network of Business Incubation Centres. CERN is also part of the ATTRACT initiative, a European call for breakthrough ideas that will fund 170 innovative projects from 2019.
Craft
Craft is building the ‘Source of Truth’ on companies, mapping the global economy, and delivering unique intelligence on companies to corporate decision-makers globally. Craft collects, aggregates and curates financial, operating and human capital data to provide the deepest picture of private and public companies to assist decision-makers to manage their supply chain, maximize their investments, mitigate risks, grow their sales, leverage their talent and enhance their competitive position.
www.stateofeuropeantech.com
In Partnership with
&
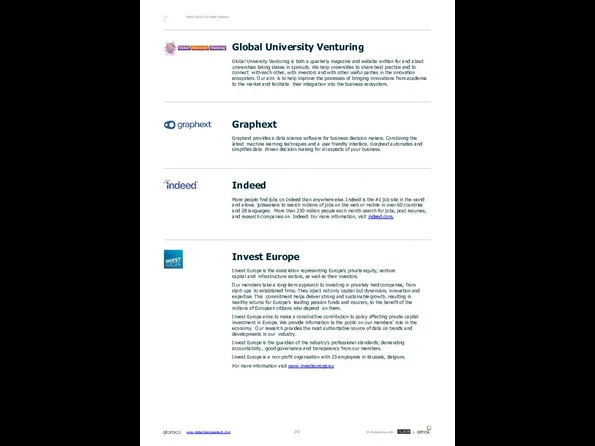
More About Our Data Partners
11.2
Graphext
Graphext provides a data science software for
More About Our Data Partners
11.2
Graphext
Graphext provides a data science software for
Indeed
More people find jobs on Indeed than anywhere else. Indeed is the #1 job site in the world and allows jobseekers to search millions of jobs on the web or mobile in over 60 countries and 28 languages. More than 250 million people each month search for jobs, post resumes, and research companies on Indeed. For more information, visit indeed.com.
Invest Europe
Invest Europe is the association representing Europe’s private equity, venture capital and infrastructure sectors, as well as their investors.
Our members take a long-term approach to investing in privately held companies, from start-ups to established firms. They inject not only capital but dynamism, innovation and expertise. This commitment helps deliver strong and sustainable growth, resulting in healthy returns for Europe’s leading pension funds and insurers, to the benefit of the millions of European citizens who depend on them.
Invest Europe aims to make a constructive contribution to policy affecting private capital investment in Europe. We provide information to the public on our members’ role in the economy. Our research provides the most authoritative source of data on trends and developments in our industry.
Invest Europe is the guardian of the industry’s professional standards, demanding accountability, good governance and transparency from our members.
Invest Europe is a non-profit organisation with 25 employees in Brussels, Belgium.
For more information visit www.investeurope.eu
Global University Venturing
Global University Venturing is both a quarterly magazine and website written for and about universities taking stakes in spinouts. We help universities to share best practice and to connect with each other, with investors and with other useful parties in the innovation ecosystem. Our aim is to help improve the processes of bringing innovations from academia to the market and facilitate their integration into the business ecosystem.
www.stateofeuropeantech.com
In Partnership with
&
More About Our Data Partners
11.2
London Stock Exchange
London Stock Exchange Group (LSE.L)
More About Our Data Partners
11.2
London Stock Exchange
London Stock Exchange Group (LSE.L)
The Group operates a broad range of international equity, bond and derivatives markets, including
London Stock Exchange; Borsa Italiana; MTS, Europe’s leading fixed income market; and the pan-European equities platform, Turquoise. Through its markets, the Group offers international business, and investors, unrivalled access to Europe’s capital markets.
Post trade and risk management services are a significant and growing part of the Group’s business operations. LSEG operates CC&G, the Rome headquartered CCP and Monte Titoli, the significant European settlement business, selected as a first wave T2S participant. The Group is also a majority owner of leading multi-asset global CCP, LCH.
The Group offers its customers an extensive range of real-time and reference data products, including Sedol, UnaVista and RNS. FTSE calculates thousands of unique indices that measure and benchmark markets and asset classes in more than 80 countries around the world.
London Stock Exchange Group is also a leading developer of high performance trading platforms and capital markets software. In addition to the Group’s own markets, over 40 other organisations and exchanges around the world use the Group’s MillenniumIT trading, surveillance
and post trade technology.
Headquartered in London, United Kingdom with significant operations in Italy, France, North
America and Sri Lanka, the Group employs approximately 4,700 people.
Meetup
Meetup is a global community platform that connects people in real life. It was founded with one simple idea: use technology to get people off technology. Our vision is to harness technology to remove the barriers to human connection and deliver real life community.
Meetup supports over 40 million members+, 320,000+ Meetup groups and 12,000 Meetups per day around the world. Meetup was acquired by WeWork in 2017. The two companies share a vision of the power of bringing people together, and together using technology to create new and innovative ways of building community. Follow us @Meetup on Twitter, @Meetup on Instagram and Facebook, or visit meetup.com to learn more.
POLITICO
POLITICO, a global nonpartisan politics and policy news organization, launched in Europe in April 2015. POLITICO Europe is a joint-venture between POLITICO LLC, based in the USA and Axel Springer, the leading publisher in Europe.
With operations based in Brussels and additional offices in London, Berlin, Paris, Rome, and Warsaw, POLITICO connects the dots between global power centers. In June 2018, an annual ComRes/Burson- Marsteller survey ranked POLITICO as the #1 most influential publication on European affairs, for the second year running.
POLITICO’s premium politics and policy news service, POLITICO Pro, empowers thousands of policy experts and decision-makers from over 900 organizations on key industries. Launched in 2015, Pro now covers 7 policy areas: Agriculture and Food, Energy and Climate, Financial Services, Healthcare, Technology, Trade, and Mobility. POLITICO Pro has 5 cross-industry products: Brexit Pro, Sustainability
Pro, Cybersecurity and Data Protection Pro, EU Budget Pro and Competition Pro. Subscribers include EU
and national government, corporations, trade associations, consultancies, law firms, and NGOs.
POLITICO Pro’s newest offering, Pro Intelligence, is an innovative platform which fuses the power of technology with the power of journalism, providing professionals with an overview of bills, legislation, voting behavior and attendance, tweets, activities, press releases, transcripts and more, at the touch of a button. Users can track information on the EU Institutions and national legislatures in the UK, France and Germany. Pro Intelligence was used by Atomico to research data on EU Tech legislation for this report.
www.stateofeuropeantech.com
In Partnership with
&
 Мировое хозяйство. (10 класс)
 Конкурентоспособность предприятия ОАО «Гроднохлебпром». Филиал «Лидский хлебозавод»
 Трендвотчер\форсайтер
 Участие США в международном движении капитала
 Задания по экономике
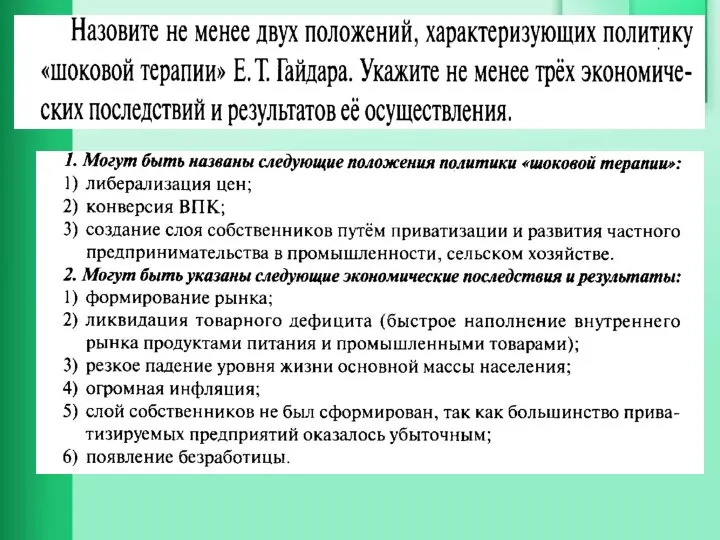 Радикальная рыночная реформа (шоковая терапия)
 Влияние миграции на демографическое развитие стран
 Презентация Стратегическое взаимодействие на рынке олигополии Парадокс Бертрана Разрешение парадокса Бертрана: повторяющиеся
  Предмет экономической науки
 Финансово-кредитный механизм привлечения инвестиций. (Тема 4)
 Основные вопросы экономики: что, как и для кого производить
 Дисциплина «Теория отраслевых рынков». Тема: «Размещение, специализация и концентрация отраслей»
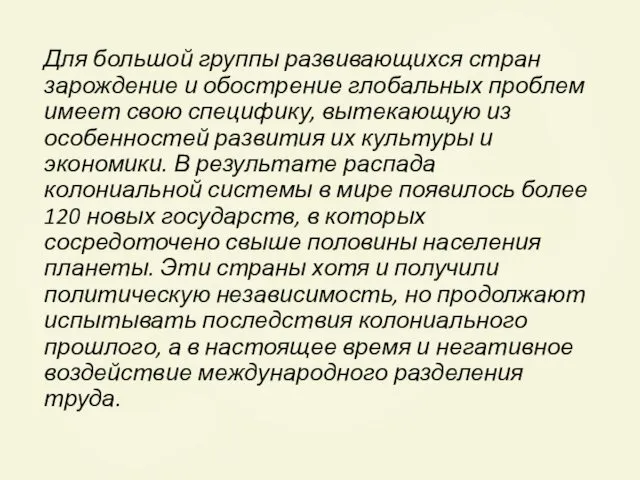 Проблема преодоления отсталости развивающихся стран
 Қр үкіметінің тұрақты экономикалық өсуді және жұмыспен қамтуды қамтамасыз етуге арналған дағдарысқа қарсы ден қою шаралары
 Перспективы развития новых туристских направлений
 Роль государства в экономике
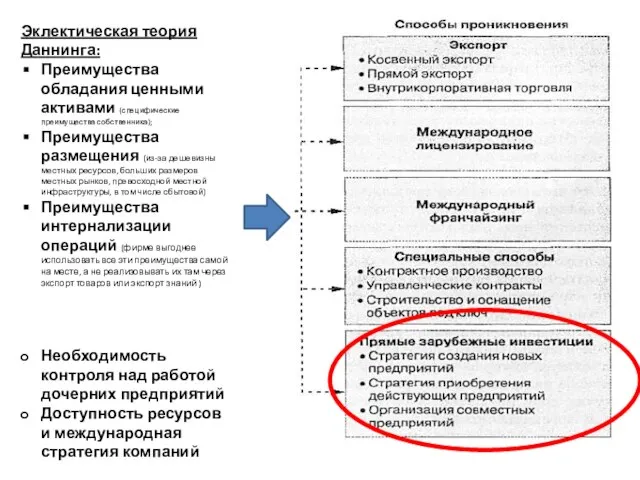 Международное движение капитала
 Спрос и предложение. 10 класс
 Методология классической политэкономии
 Теория и практика коммуникаций
 Global imbalances after 2008
 Основы теории спроса и предложения
 Экономическая теория. Предмет, методы познания, значение. (Тема 1.1)
 Koszty przedsiębiorstwa
 «Руководство Осло» редакция 1992 года (технологические инновации); редакция 2005 года (технологические продукты, услуги)
 Российская Федерация: поиск пути развития
 Методы государственного финансового регулирования экономики
 Model gospodarki rynkowej