- Lecture 1. Introduction to Econometrics

Содержание
- 2. The Subject of Econometrics Econometrics is the application of statistical methods to the quantification and critical
- 3. The Aims and Approaches of the Course The aims of the course are: - To develop
- 4. Methodology of Econometrics: 1. Statement of Theory or Hypothesis 2.Specification of Mathematical Model 3. Specification of
- 5. Economic Relationships and Models Considered in the Course Demand and Supply functions; Earnings functions; Production functions;
- 6. Econometric Analysis of ICEF Students UoL Exams Results Elements of Econometrics, 2012-2014 The model specification for
- 7. The Questions on the Model to be answered in the Course Is the model specification reliable?
- 8. Time Series Example: Price of Oil (Brent) and RuR/USD Exchange Rate (01/09/14-31/08/15) The relationship is available
- 9. Reading Main Textbook: Dougherty, Christopher. Introduction to Econometrics. Oxford University Press, 2011, 2006 (4th or 3rd
- 10. Main Electronic Resources: ICEF Information System: http://icef-info.hse.ru University of London site: http://www.londoninternational.ac.uk/community/students VLE Student Portal: http://my.londonexternal.ac.uk/london/portal
- 11. Statistical Glossary for Econometrics: Descriptive statistics: Mean, variance, standard deviation, covariance, correlation Random variables, Probability distributions:
- 12. Example: Plim rules Plim rule 1 plim (X + Y) = plim X + plim Y
- 13. Notation in the course (examples) Greek letters – true values, latin (or greek with hats) -
- 14. Types of Data and of Regression Model Data: cross-sections, time series, panel data. Model A: cross-sectional
- 15. Some issues which are important in applied analysis Correct specification (functional form, regressors availability) Endogeneity Sample
- 17. Скачать презентацию
The Subject of Econometrics
Econometrics is the application of statistical methods to
The Subject of Econometrics
Econometrics is the application of statistical methods to

The Aims and Approaches of the Course
The aims of the
The Aims and Approaches of the Course
The aims of the
Methodology of Econometrics:
1. Statement of Theory or Hypothesis
2.Specification of Mathematical Model
3.
Methodology of Econometrics:
1. Statement of Theory or Hypothesis
2.Specification of Mathematical Model
3.
Economic Relationships and Models Considered in the Course
Demand and Supply functions;
Earnings
Economic Relationships and Models Considered in the Course
Demand and Supply functions;
Earnings
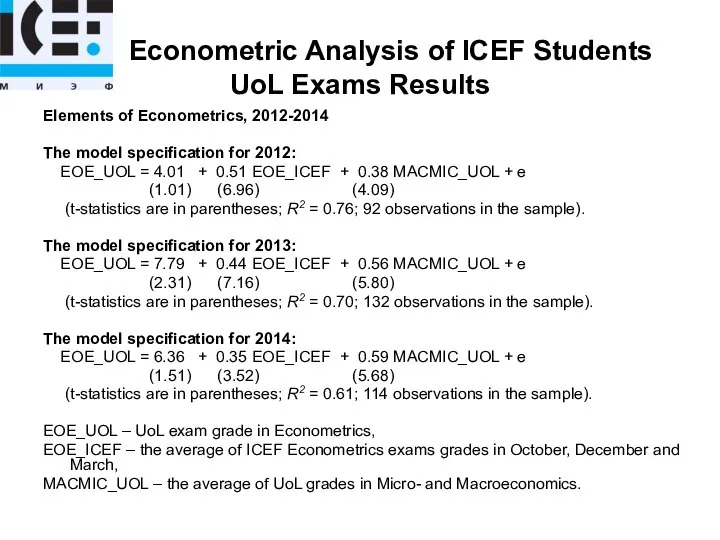
Econometric Analysis of ICEF Students UoL Exams Results
Elements of Econometrics,
Econometric Analysis of ICEF Students UoL Exams Results
Elements of Econometrics,
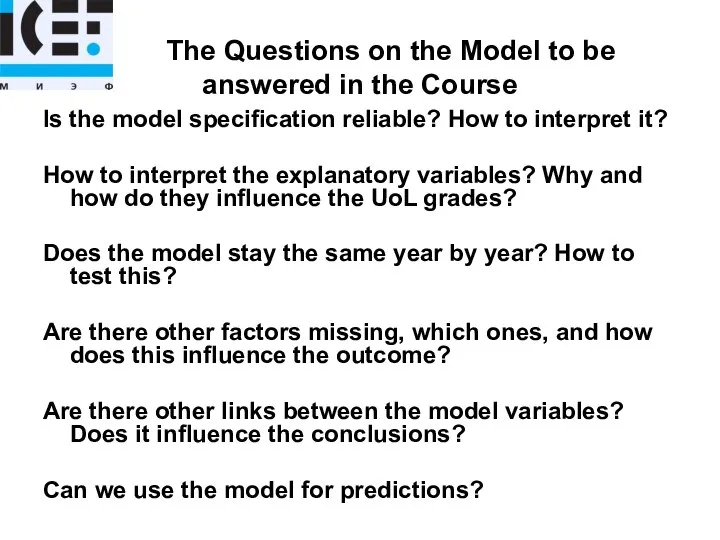
The Questions on the Model to be answered in the
The Questions on the Model to be answered in the

Time Series Example: Price of Oil (Brent) and RuR/USD Exchange
Time Series Example: Price of Oil (Brent) and RuR/USD Exchange
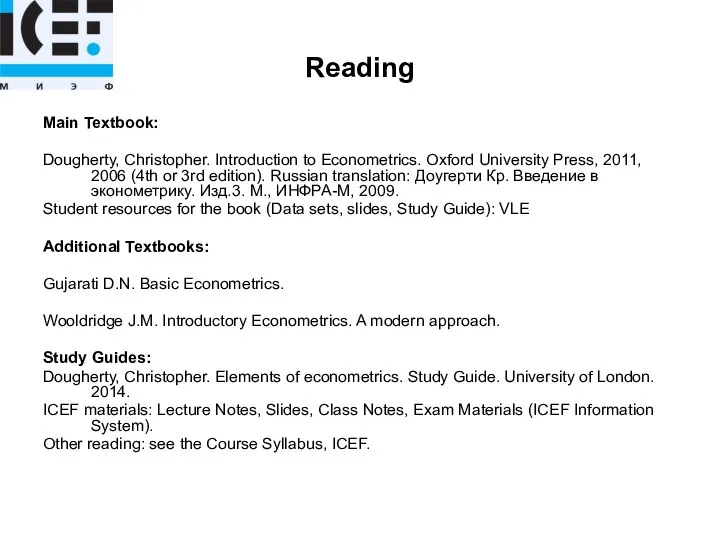
Reading
Main Textbook:
Dougherty, Christopher. Introduction to Econometrics. Oxford University Press, 2011,
Reading
Main Textbook:
Dougherty, Christopher. Introduction to Econometrics. Oxford University Press, 2011,
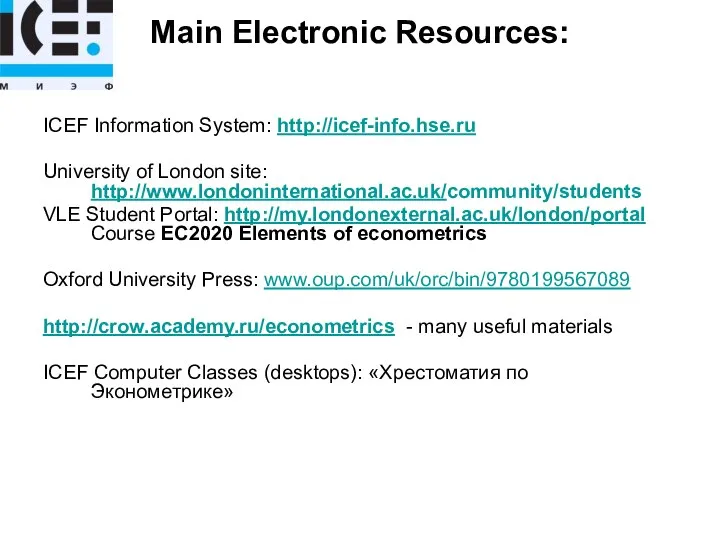
Main Electronic Resources:
ICEF Information System: http://icef-info.hse.ru
University of London site: http://www.londoninternational.ac.uk/community/students
VLE
Main Electronic Resources:
ICEF Information System: http://icef-info.hse.ru
University of London site: http://www.londoninternational.ac.uk/community/students
VLE
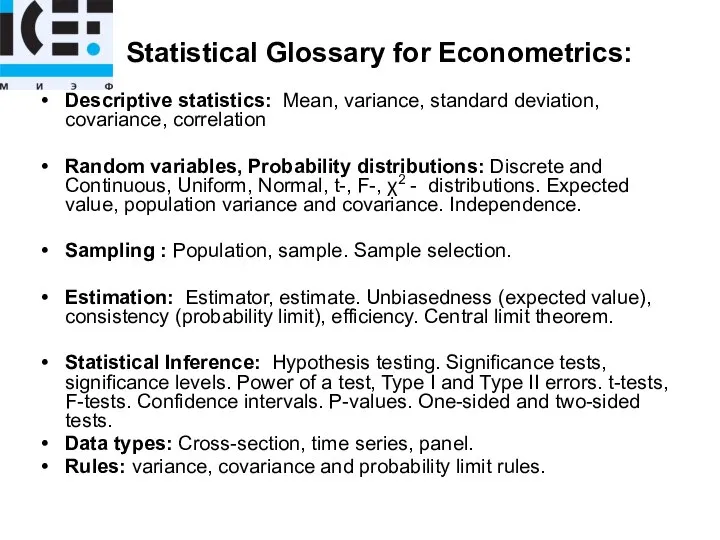
Statistical Glossary for Econometrics:
Descriptive statistics: Mean, variance, standard deviation, covariance,
Statistical Glossary for Econometrics:
Descriptive statistics: Mean, variance, standard deviation, covariance,

Example: Plim rules
Plim rule 1 plim (X + Y) = plim
Example: Plim rules
Plim rule 1 plim (X + Y) = plim
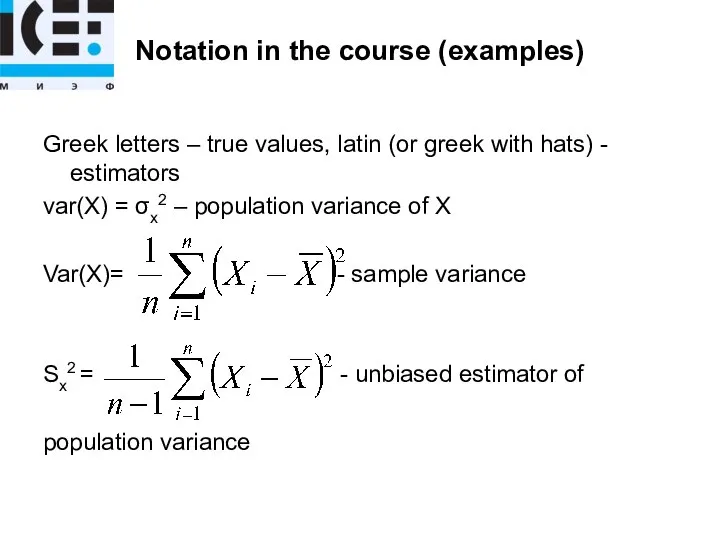
Notation in the course (examples)
Greek letters – true values, latin (or
Notation in the course (examples)
Greek letters – true values, latin (or
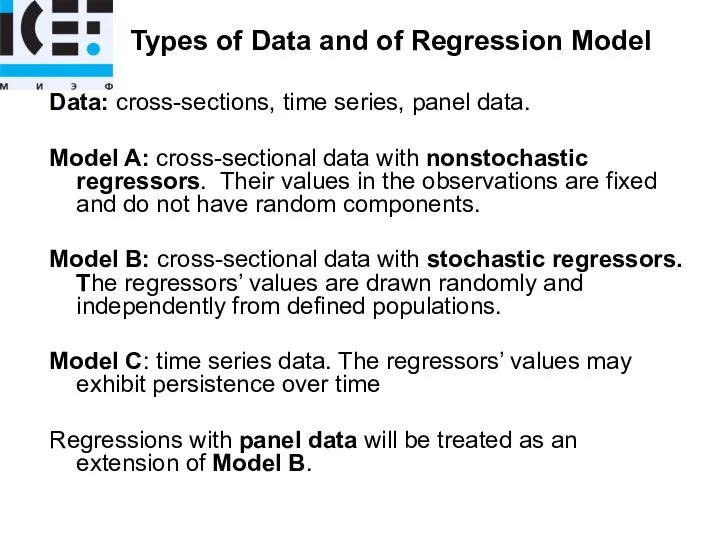
Types of Data and of Regression Model
Data: cross-sections, time series,
Types of Data and of Regression Model
Data: cross-sections, time series,

Some issues which are important in applied analysis
Correct specification (functional form,
Some issues which are important in applied analysis
Correct specification (functional form,
 Рынки близкие к совершенной конкуренции. Виды монополий
 Международные экономические отношения
 Статистика туризма. (Лекции 1-2)
 Влияние санкций на инновационное развитие российской экономики
 Часть I. Собственность. Конкуренция. Экономическая свобода
 Основные средства предприятия
 Основные фонды предприятий
 Основные экономические законы
 Микроэкономикалық талдаудың әдіснамасы мен негізгі әдістері
 Предмет макроэкономики и особенности макроэкономического анализа. Тема 1
 Презентация по экономике Тема: НАЦИОНАЛЬНАЯ ЭКОНОМИКА _
 Система национальных счетов и основные макроэкономические показатели
 Исследование изменений темпов экономического роста страны в долгосрочном периоде
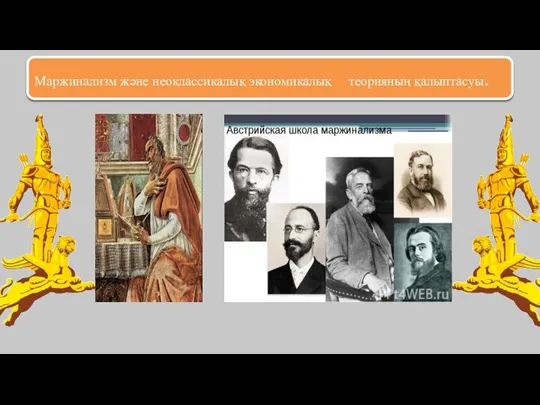 Маржинализм және неоклассикалық экономикалық теорияның қалыптасуы
 Институциональные аспекты рыночного хозяйства
 Современное ювелирное производство – прочный сплав творчества и высоких технологий
 Разработка и исследование энергоэффективности зданий образовательных учреждений
 Опытное производство. Правовые и экономические аспекты использования опытных образцов
 Aggregate Demand I. Building the IS–LM Model
 Введение в микроэкономику
 Распределение доходов. Доходы граждан и прожиточный минимум. Неравенство доходов (обществознание, 8 класс)
 Макроэкономические аспекты международной энергетики
 Организация внешнеэкономической деятельности. Внешнеэкономический контракт
 Национальное счетоводство
 Детерминанты развития экономико-исторического процесса
 Спрос и предложение на факторы производства. Виды факторных доходов. (Модуль 7.1)
 Теории И. Фишера
 Антикризисное управление как система экономического оздоровления предприятия