- Macroeconomics Productivity GDP per capita Venezuela. (Lecture 6)

Содержание
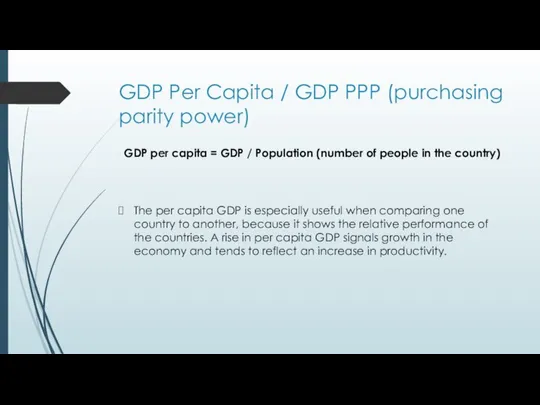
- 2. GDP Per Capita / GDP PPP (purchasing parity power) GDP per capita = GDP / Population
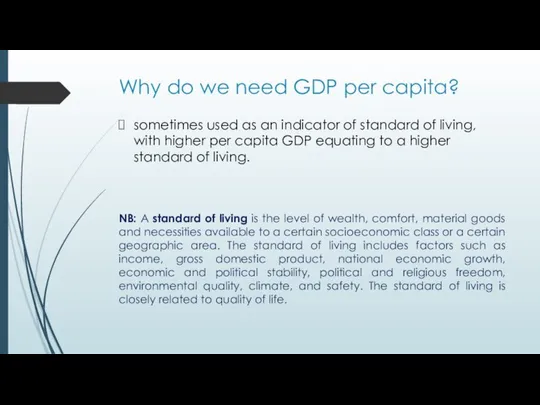
- 3. Why do we need GDP per capita? sometimes used as an indicator of standard of living,
- 4. GDP (2016) GDP per capita (2016)
- 5. Why do we need GDP per capita? can also be used to measure the productivity of
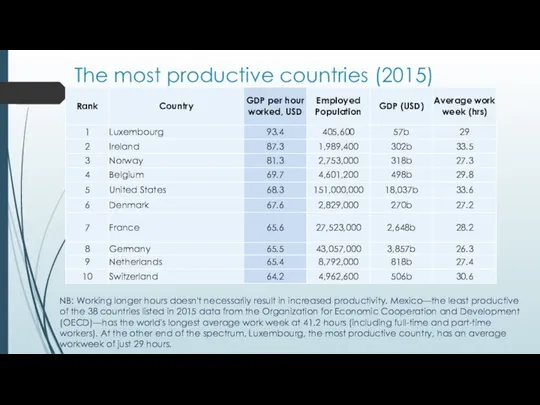
- 6. The most productive countries (2015) NB: Working longer hours doesn't necessarily result in increased productivity. Mexico—the
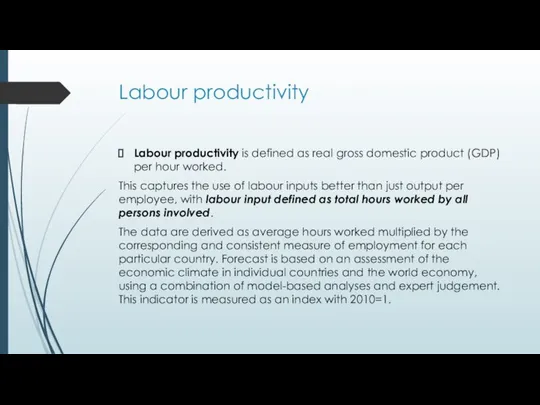
- 8. Labour productivity Labour productivity is defined as real gross domestic product (GDP) per hour worked. This
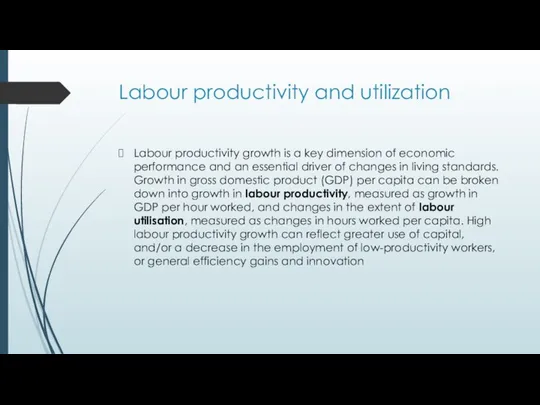
- 10. Labour productivity and utilization Labour productivity growth is a key dimension of economic performance and an
- 12. Multifactor productivity Multifactor productivity (MFP) reflects the overall efficiency with which labour and capital inputs are
- 14. What Is Purchasing Power Parity? Macroeconomic analysis relies on several different metrics to compare economic productivity
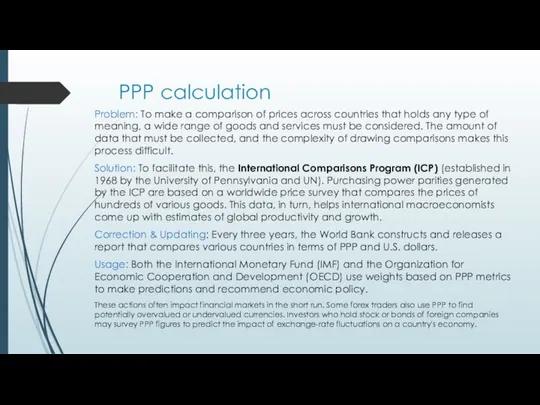
- 15. PPP calculation Problem: To make a comparison of prices across countries that holds any type of
- 16. The Big Mac Index: an example of PPP (The Economist) Prehistory: The Economist has tracked the
- 18. GDP with PPP Example: One way to think of what GDP with PPP represents is to
- 19. Transport Costs: Goods that are not available locally will need to be imported, resulting in transport
- 20. Venezuela case
- 21. From the 10 years of military dictatorship between 1948-1958 to the impeachment of Carlos Andrés Pérez
- 22. By 1950, as the rest of the world was struggling to recover from World War II,
- 23. The Downfall of Venezuela’s Economy From 1950 to the early 1980s, the Venezuelan economy experienced steady
- 25. Although oil revenues are tempting to rely on to maintain social order, they come with a
- 26. The graphic shows Venezuela’s oil revenues (in 2000 dollars) against the rate of inflation – and
- 27. Nicolás Maduro, who took over after the death of his predecessor, saw oil prices crash almost
- 29. Скачать презентацию
GDP Per Capita / GDP PPP (purchasing parity power)
GDP per
GDP Per Capita / GDP PPP (purchasing parity power)
GDP per
Why do we need GDP per capita?
sometimes used as an indicator
Why do we need GDP per capita?
sometimes used as an indicator

GDP (2016)
GDP per capita (2016)
GDP (2016)
GDP per capita (2016)

Why do we need GDP per capita?
can also be used to
Why do we need GDP per capita?
can also be used to
The most productive countries (2015)
NB: Working longer hours doesn't necessarily result
The most productive countries (2015)
NB: Working longer hours doesn't necessarily result

Labour productivity
Labour productivity is defined as real gross domestic product (GDP)
Labour productivity
Labour productivity is defined as real gross domestic product (GDP)

Labour productivity and utilization
Labour productivity growth is a key dimension of
Labour productivity and utilization
Labour productivity growth is a key dimension of


Multifactor productivity
Multifactor productivity (MFP) reflects the overall efficiency with which labour
Multifactor productivity
Multifactor productivity (MFP) reflects the overall efficiency with which labour


What Is Purchasing Power Parity?
Macroeconomic analysis relies on several different metrics
What Is Purchasing Power Parity?
Macroeconomic analysis relies on several different metrics
PPP calculation
Problem: To make a comparison of prices across countries that
PPP calculation
Problem: To make a comparison of prices across countries that

The Big Mac Index: an example of PPP
(The Economist)
Prehistory: The Economist
The Big Mac Index: an example of PPP
(The Economist)
Prehistory: The Economist


GDP with PPP
Example: One way to think of what GDP with
GDP with PPP
Example: One way to think of what GDP with

Transport Costs: Goods that are not available locally will need to
Transport Costs: Goods that are not available locally will need to

Venezuela case
Venezuela case
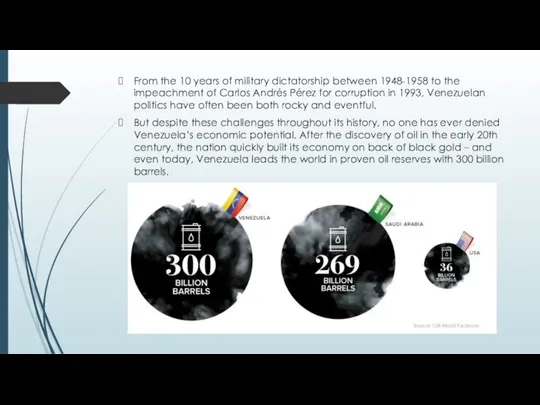
From the 10 years of military dictatorship between 1948-1958 to the
From the 10 years of military dictatorship between 1948-1958 to the

By 1950, as the rest of the world was struggling to
By 1950, as the rest of the world was struggling to

The Downfall of Venezuela’s Economy
From 1950 to the early 1980s, the
The Downfall of Venezuela’s Economy
From 1950 to the early 1980s, the


Although oil revenues are tempting to rely on to maintain social
Although oil revenues are tempting to rely on to maintain social

The graphic shows Venezuela’s oil revenues (in 2000 dollars) against the
The graphic shows Venezuela’s oil revenues (in 2000 dollars) against the

Nicolás Maduro, who took over after the death of his predecessor,
Nicolás Maduro, who took over after the death of his predecessor,
 Потребности человека
 Муниципальное образование «город Обнинск»
 Экономическая стратегия как система развития конкурентных преимуществ в бизнесе
 Стоимостная оценка рисков
 Програма ЄС «Підтримка політики регіонального розвитку України”. Агропромисловий комплекс Волині
 Национальные экономические модели рыночной экономики
 Риск в экономике
 Глобалізація та її негативний вплив
 Ресурсный потенциал и отраслевая структура мировой экономики
 Внешняя среда организации и ее анализ. PEST
 Методы экономического анализа и стратегическое управление промышленным производством: БКГ- анализ
 Предмет, метод и основные этапы развития экономической теории. (Тема 1)
 Теория и практика коммуникаций
 Основы теории спроса и предложения. 2018
 Презентация Модели политических систем
 Технопарки в Китае
 The labour market
 Планирование и прогнозирование промышленности
 Экономика общественного сектора. Функции государства. (Лекции 1-2)
 Економічна система суспільства та форми організації суспільного виробництва
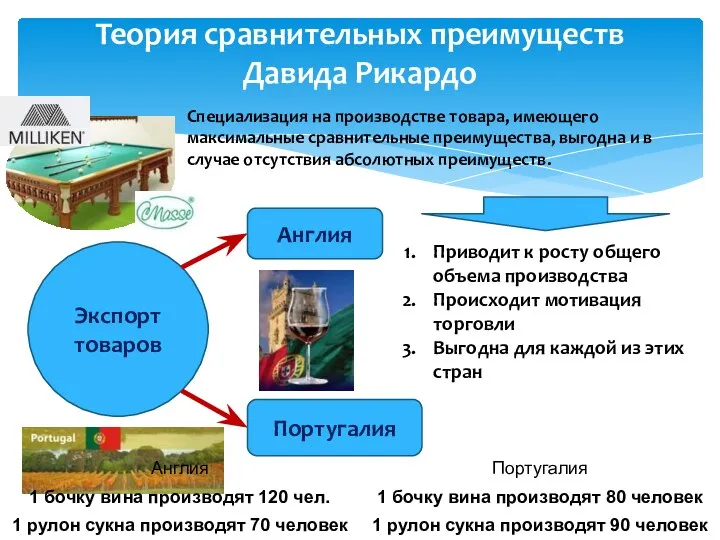 Теория сравнительных преимуществ Давида Рикардо
 Организация и информационная база экономического анализа. (Тема 2)
 Структура переработки молока в 2015 год в сравнении с 2014 годом
 Теория поведения потребителя
 Учет персонала и кадровый учет организаций
 Основы теории потребительского поведения
 Комплексный экономический анализ. Понятие и назначение системного подхода. (Тема 3)
 Моделирование устойчивого развития экономических систем