- Equity Valuation

Содержание
- 2. Deck 2 Agenda Free Cash flows & financing cash flows Financial statement analysis Common sized financial
- 3. Section I Free Cash flows & financing cash flows
- 4. Let’s dive into Cash Flows CF versus profit Firms with recurring negative cash flows can go
- 5. Cash flows? Free Cash Flow ? cash flow from assets FCF = Operating cash flow +
- 6. CF statement The CF Statement shows the financial flows (cash received or disbursed) when they actually
- 7. Sections in the Cash Flow Statement Cash flow from operations includes the cash flow consequences of
- 8. Free Cash Flow Free Cash Flow (FCF): cash flow that is free and available to be
- 9. Operating cash flows Cash flows linked to the core activities. Positive operating cash flow generally indicates
- 10. Computing Operating CF Operating CF = EBIT + Depreciation – taxes NB: this approach differ from
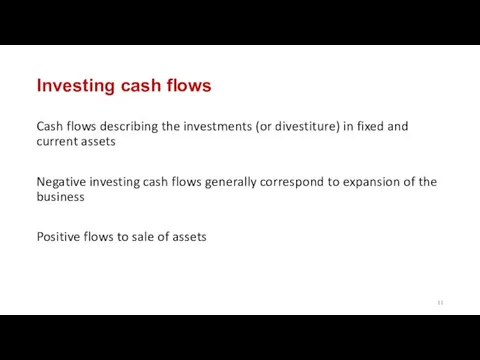
- 11. Investing cash flows Cash flows describing the investments (or divestiture) in fixed and current assets Negative
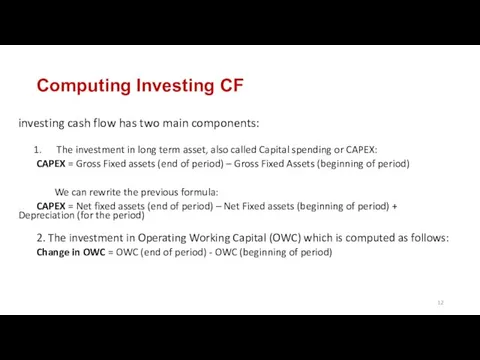
- 12. Computing Investing CF investing cash flow has two main components: The investment in long term asset,
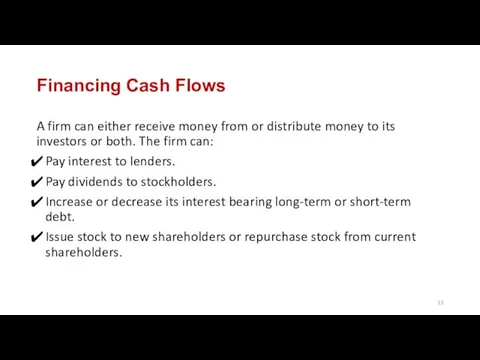
- 13. Financing Cash Flows A firm can either receive money from or distribute money to its investors
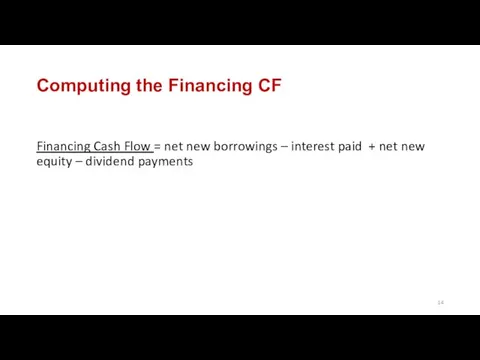
- 14. Computing the Financing CF Financing Cash Flow = net new borrowings – interest paid + net
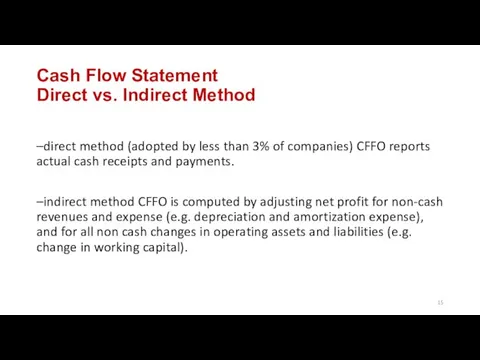
- 15. Cash Flow Statement Direct vs. Indirect Method –direct method (adopted by less than 3% of companies)
- 16. FCF FCF = Operating CF + investing CF When negative implies a need for further financing
- 17. Interpreting Free Cash Flows Does Positive or Negative free cash flow maximize shareholder wealth? Need more
- 18. Incremental cash flows Further, after-tax free cash flows must be measured incrementally. Determining incremental free cash
- 19. Beware of diverted cash flows Not all incremental free cash flow is relevant. Thus new product
- 20. Working capital requirement New projects require infusion of working capital (such as inventory to stock the
- 21. Sunk Costs Sunk costs are cash flows that have already occurred (such as marketing research) and
- 22. Opportunity Costs Opportunity cost refers to cash flows that are lost because of accepting the current
- 23. Overhead Costs Incremental overhead costs or costs that were incurred as a result of the project
- 24. Interest Payments and Financing Costs Interest payments and other financing cash flows that might result from
- 25. What is FCFF? The Free Cash Flow to Firm (FCFF) is a measure of the (after
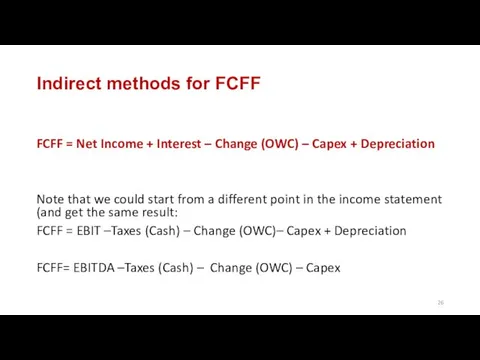
- 26. Indirect methods for FCFF FCFF = Net Income + Interest – Change (OWC) – Capex +
- 27. Section II Financial statement analysis
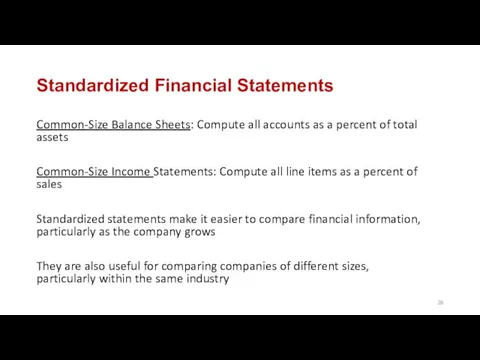
- 28. Standardized Financial Statements Common-Size Balance Sheets: Compute all accounts as a percent of total assets Common-Size
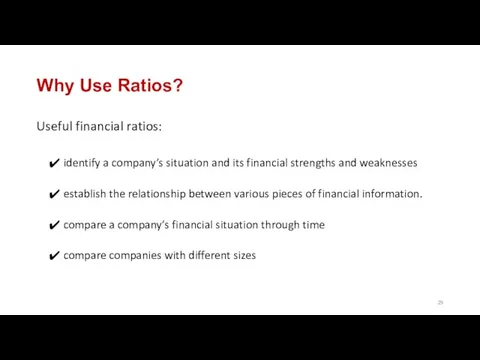
- 29. Why Use Ratios? Useful financial ratios: identify a company’s situation and its financial strengths and weaknesses
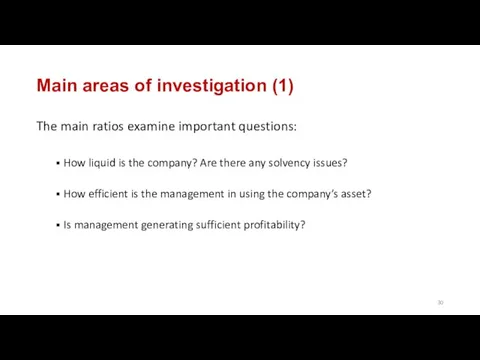
- 30. Main areas of investigation (1) The main ratios examine important questions: How liquid is the company?
- 31. Main areas of investigation (2) For publicly traded companies, market ratios: Assess relationship between Market price
- 32. Short-term Solvency ratios Current Ratio = current assets/current liabilities Quick Ratio = (Current assets – inventory)
- 33. Long-term solvency measures Debt ratio is the % of assets financed by debt Debt ratio= Total
- 34. Efficiency ratios (1) Inventory Turnover: How many times is inventory rolled over during the year? (*Note)
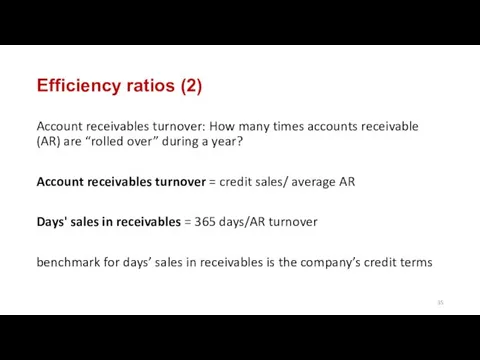
- 35. Efficiency ratios (2) Account receivables turnover: How many times accounts receivable (AR) are “rolled over” during
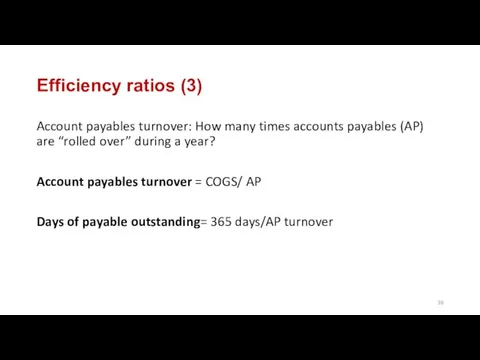
- 36. Efficiency ratios (3) Account payables turnover: How many times accounts payables (AP) are “rolled over” during
- 37. Cash Conversion Cycle Sum of the days of sales outstanding (average collection period) and days of
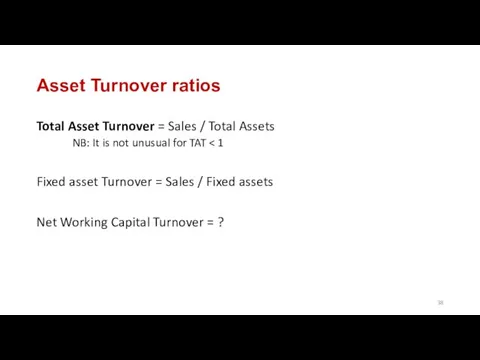
- 38. Asset Turnover ratios Total Asset Turnover = Sales / Total Assets NB: It is not unusual
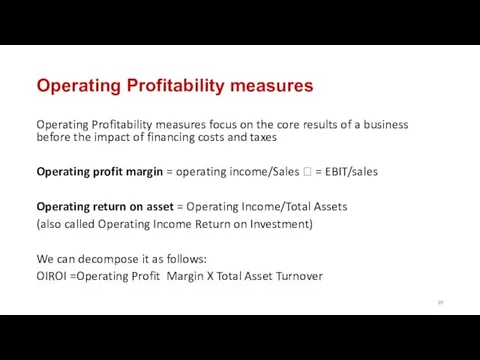
- 39. Operating Profitability measures Operating Profitability measures focus on the core results of a business before the
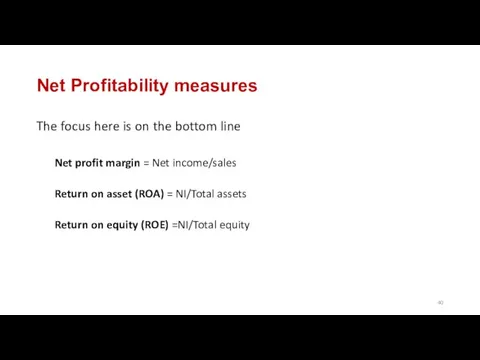
- 40. Net Profitability measures The focus here is on the bottom line Net profit margin = Net
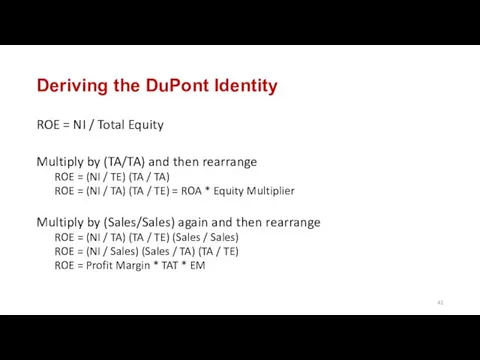
- 41. Deriving the DuPont Identity ROE = NI / Total Equity Multiply by (TA/TA) and then rearrange
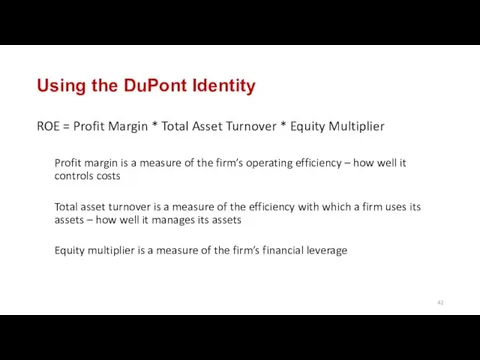
- 42. Using the DuPont Identity ROE = Profit Margin * Total Asset Turnover * Equity Multiplier Profit
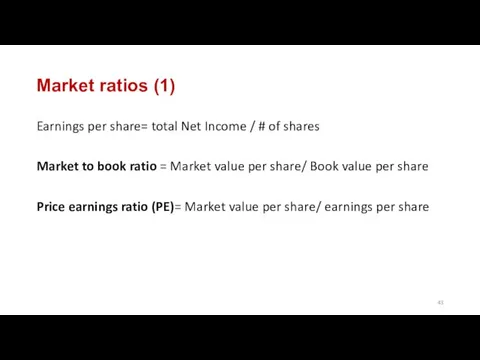
- 43. Market ratios (1) Earnings per share= total Net Income / # of shares Market to book
- 44. Market ratios (2) Market ratios reflect investors’ expectations How could you interpret a high PE versus
- 45. Remember why we compute ratios A ratio needs to tell you something about the company you
- 46. Benchmarking (1): Trend analysis Analyzing data through time: Quarterly evolutions: spots seasonality and or extraordinary events
- 47. Benchmarking (2): Peer group and competitor analysis Makes sense both from a managerial and an investment
- 48. Limitations of Ratio analysis Differences in accounting practices Subjectivity in the interpretation of ratios Seasonal biases
- 50. Скачать презентацию
Deck 2
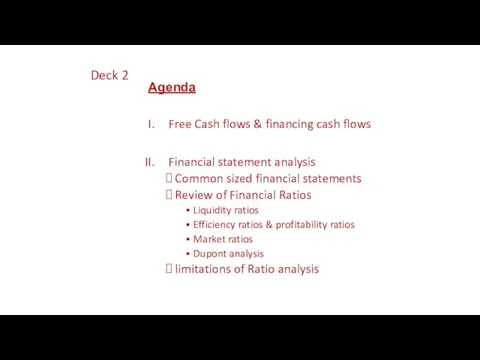
Agenda
Free Cash flows & financing cash flows
Financial statement analysis
Common sized
Deck 2
Agenda
Free Cash flows & financing cash flows
Financial statement analysis
Common sized

Section I
Free Cash flows & financing cash flows
Section I
Free Cash flows & financing cash flows
Let’s dive into Cash Flows
CF versus profit
Firms with recurring negative cash
Let’s dive into Cash Flows
CF versus profit
Firms with recurring negative cash
Cash flows?
Free Cash Flow ? cash flow from assets
FCF = Operating
Cash flows?
Free Cash Flow ? cash flow from assets
FCF = Operating
CF statement
The CF Statement shows the financial flows (cash received or
CF statement
The CF Statement shows the financial flows (cash received or
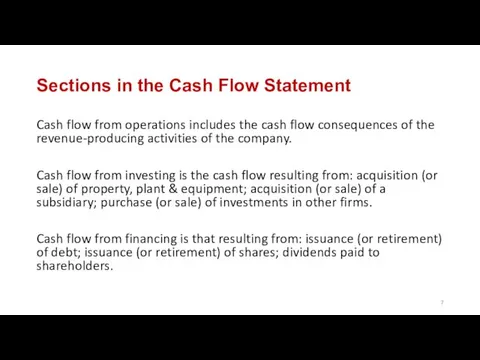
Sections in the Cash Flow Statement
Cash flow from operations includes the
Sections in the Cash Flow Statement
Cash flow from operations includes the
Free Cash Flow
Free Cash Flow (FCF): cash flow that is free
Free Cash Flow
Free Cash Flow (FCF): cash flow that is free
Operating cash flows
Cash flows linked to the core activities.
Positive operating
Operating cash flows
Cash flows linked to the core activities.
Positive operating
Computing Operating CF
Operating CF = EBIT + Depreciation – taxes
NB: this
Computing Operating CF
Operating CF = EBIT + Depreciation – taxes
NB: this
Investing cash flows
Cash flows describing the investments (or divestiture) in fixed
Investing cash flows
Cash flows describing the investments (or divestiture) in fixed
Computing Investing CF
investing cash flow has two main components:
The investment in
Computing Investing CF
investing cash flow has two main components:
The investment in
Financing Cash Flows
A firm can either receive money from or distribute
Financing Cash Flows
A firm can either receive money from or distribute
Computing the Financing CF
Financing Cash Flow = net new borrowings –
Computing the Financing CF
Financing Cash Flow = net new borrowings –
Cash Flow Statement
Direct vs. Indirect Method
–direct method (adopted by less than
Cash Flow Statement
Direct vs. Indirect Method
–direct method (adopted by less than
FCF
FCF = Operating CF + investing CF
When negative implies a need
FCF
FCF = Operating CF + investing CF
When negative implies a need
Interpreting Free Cash Flows
Does Positive or Negative free cash flow maximize
Interpreting Free Cash Flows
Does Positive or Negative free cash flow maximize
Incremental cash flows
Further, after-tax free cash flows must be measured incrementally.
Incremental cash flows
Further, after-tax free cash flows must be measured incrementally.
Beware of diverted cash flows
Not all incremental free cash flow is
Beware of diverted cash flows
Not all incremental free cash flow is
Working capital requirement
New projects require infusion of working capital (such as
Working capital requirement
New projects require infusion of working capital (such as
Sunk Costs
Sunk costs are cash flows that have already occurred (such
Sunk Costs
Sunk costs are cash flows that have already occurred (such
Opportunity Costs
Opportunity cost refers to cash flows that are lost because
Opportunity Costs
Opportunity cost refers to cash flows that are lost because
Overhead Costs
Incremental overhead costs or costs that were incurred as a
Overhead Costs
Incremental overhead costs or costs that were incurred as a
Interest Payments and Financing Costs
Interest payments and other financing cash flows
Interest Payments and Financing Costs
Interest payments and other financing cash flows
What is FCFF?
The Free Cash Flow to Firm (FCFF) is a
What is FCFF?
The Free Cash Flow to Firm (FCFF) is a
Indirect methods for FCFF
FCFF = Net Income + Interest – Change
Indirect methods for FCFF
FCFF = Net Income + Interest – Change
Section II
Financial statement analysis
Section II
Financial statement analysis
Standardized Financial Statements
Common-Size Balance Sheets: Compute all accounts as a percent
Standardized Financial Statements
Common-Size Balance Sheets: Compute all accounts as a percent
Why Use Ratios?
Useful financial ratios:
identify a company’s situation and its financial
Why Use Ratios?
Useful financial ratios:
identify a company’s situation and its financial
Main areas of investigation (1)
The main ratios examine important questions:
How liquid
Main areas of investigation (1)
The main ratios examine important questions:
How liquid
Main areas of investigation (2)
For publicly traded companies, market ratios:
Assess relationship
Main areas of investigation (2)
For publicly traded companies, market ratios:
Assess relationship
Short-term Solvency ratios
Current Ratio = current assets/current liabilities
Quick Ratio = (Current assets
Short-term Solvency ratios
Current Ratio = current assets/current liabilities
Quick Ratio = (Current assets
Long-term solvency measures
Debt ratio is the % of assets financed by
Long-term solvency measures
Debt ratio is the % of assets financed by
Efficiency ratios (1)
Inventory Turnover: How many times is inventory rolled over
Efficiency ratios (1)
Inventory Turnover: How many times is inventory rolled over
Efficiency ratios (2)
Account receivables turnover: How many times accounts receivable (AR)
Efficiency ratios (2)
Account receivables turnover: How many times accounts receivable (AR)
Efficiency ratios (3)
Account payables turnover: How many times accounts payables (AP)
Efficiency ratios (3)
Account payables turnover: How many times accounts payables (AP)

Cash Conversion Cycle
Sum of the days of sales outstanding (average collection
Cash Conversion Cycle
Sum of the days of sales outstanding (average collection
Asset Turnover ratios
Total Asset Turnover = Sales / Total Assets
NB: It
Asset Turnover ratios
Total Asset Turnover = Sales / Total Assets
NB: It
Operating Profitability measures
Operating Profitability measures focus on the core results of
Operating Profitability measures
Operating Profitability measures focus on the core results of
Net Profitability measures
The focus here is on the bottom line
Net profit
Net Profitability measures
The focus here is on the bottom line
Net profit
Deriving the DuPont Identity
ROE = NI / Total Equity
Multiply by (TA/TA)
Deriving the DuPont Identity
ROE = NI / Total Equity
Multiply by (TA/TA)
Using the DuPont Identity
ROE = Profit Margin * Total Asset Turnover
Using the DuPont Identity
ROE = Profit Margin * Total Asset Turnover
Market ratios (1)
Earnings per share= total Net Income / # of
Market ratios (1)
Earnings per share= total Net Income / # of
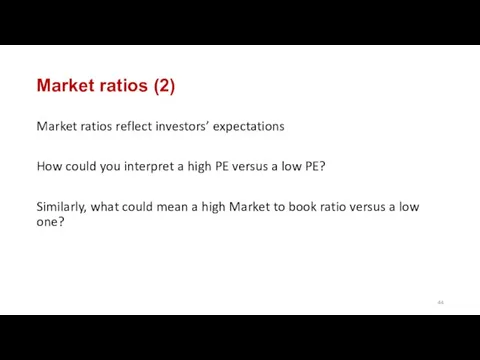
Market ratios (2)
Market ratios reflect investors’ expectations
How could you interpret a
Market ratios (2)
Market ratios reflect investors’ expectations
How could you interpret a
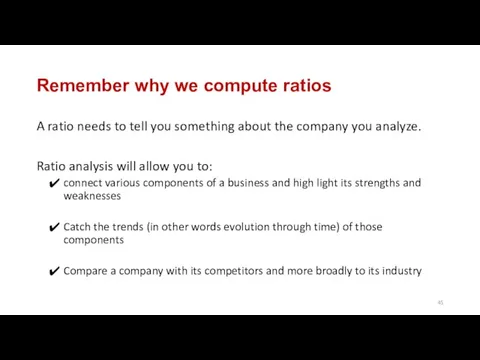
Remember why we compute ratios
A ratio needs to tell you something
Remember why we compute ratios
A ratio needs to tell you something
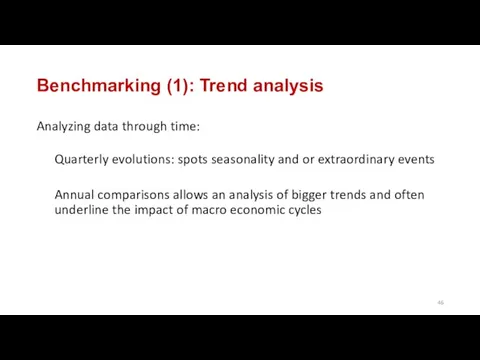
Benchmarking (1): Trend analysis
Analyzing data through time:
Quarterly evolutions: spots seasonality and
Benchmarking (1): Trend analysis
Analyzing data through time:
Quarterly evolutions: spots seasonality and
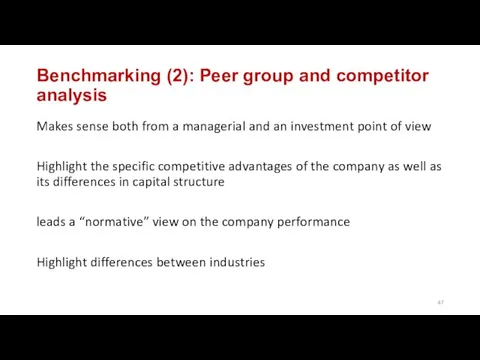
Benchmarking (2): Peer group and competitor analysis
Makes sense both from a
Benchmarking (2): Peer group and competitor analysis
Makes sense both from a
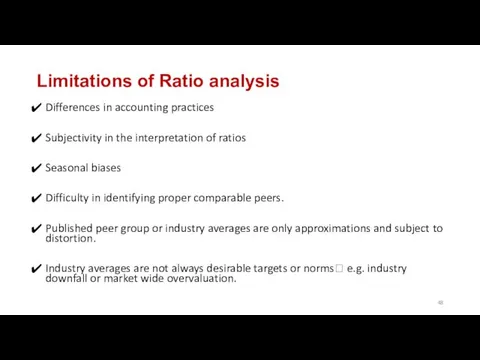
Limitations of Ratio analysis
Differences in accounting practices
Subjectivity in the interpretation
Limitations of Ratio analysis
Differences in accounting practices
Subjectivity in the interpretation
 Бюджет семьи. Доходная и расходная части бюджета
 Вклады, проценты по вкладам
 Вопросы государственного пенсионного обеспечения. Инновации в пенсионной сфере
 Анализ финансового состояния
 РоссельхозБанк. Государственная программа Комплексное развитие сельских территорий
 Тема 5. Планирование изменения себестоимости продукции
 Курс Основы финансовой грамотности. Принципы инвестирования
 Управление инвестиционным портфелем
 Банки и управление активами. Финансовые, денежно-кредитные методы регулирования экономики. Венчурное и мезонинное финансирование
 Системы электронных паспортов транспортных средств и электронных паспортов самоходных машин и других видов техники
 Международные финансы
 Наращение и дисконтирование. Тема 2
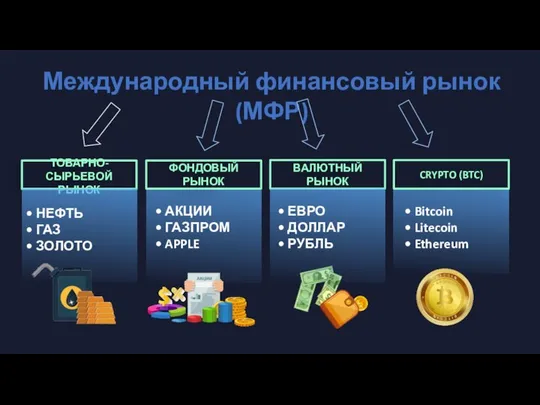 Международный финансовый рынок. Валютный рынок Forex
 Ндфл. Налогоплательщики
 Бухгалтерский учет и аудит в малом предприятии
 Федеральная программа по стимулированию предпринимательской активности молодежи
 Risc si asigurari
 Денежно-кредитная политика: основные направления, инструменты, проблемы
 Бухгалтерский учет финансовых результатов деятельности организации ООО Лидер строй
 Изменение порядка применения КОСГУ в 2019 году
 Организация безналичных расчетов
 Банковские денежные отношения
 Банковская система: экономико-правовой аспект
 Деньги и их функции. Инфляция
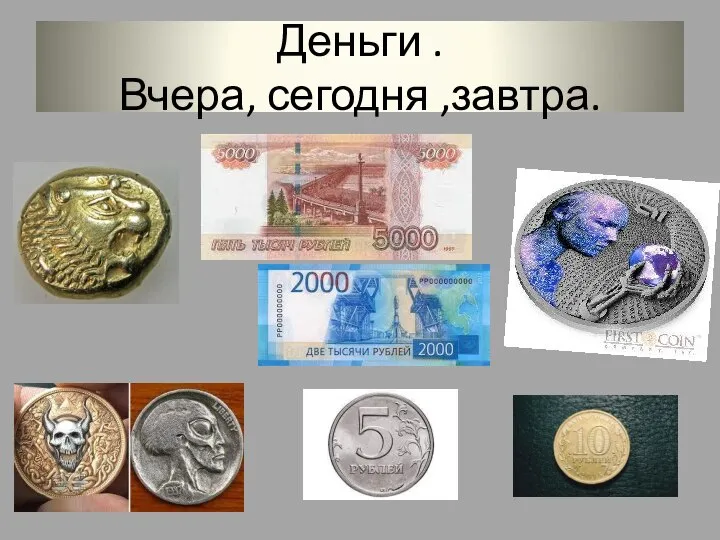 Деньги. Вчера, сегодня ,завтра
 Создание Центра мониторинга и реагирования на компьютерные атаки в кредитно-финансовой сфере
 Метод бухгалтерского учета
 Статистический анализ рисков при формировании кредитного портфеля банка