- Иммунохимические методы детекции

Содержание
- 32. Перенос антигенов в буферном растворе Влажный или полусухой перенос антигенов на мембрану
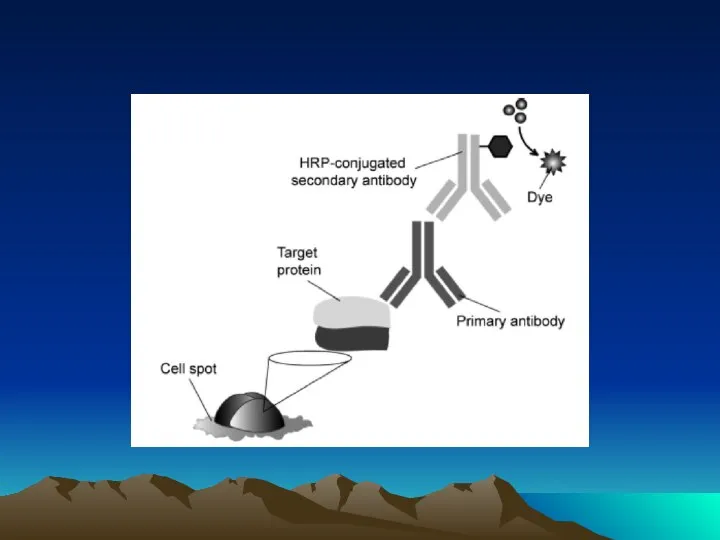
- 33. How it Works Traditional western blotting takes a variety of formats and reagent conditions to accomplish.
- 34. How it Works – reagent flows Gentle Rocking Reagents diffuse slowly into membrane Reagents rapidly driven
- 35. Standard vs. SNAP i.d. - concentrations Concentrations Blocking concentrations are limited to prevent clogging of blot
- 36. Compatible Blocking Reagents and Recommended Concentrations From page 8 of the SNAP i.d. User Guide
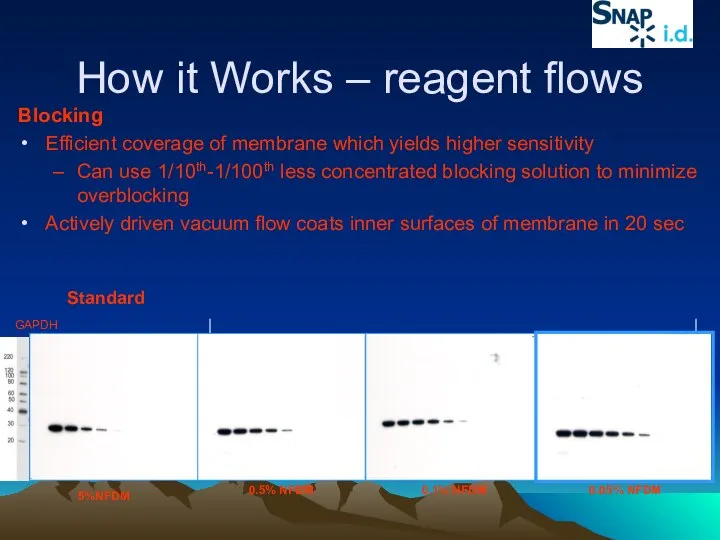
- 37. How it Works – reagent flows Blocking Efficient coverage of membrane which yields higher sensitivity Can
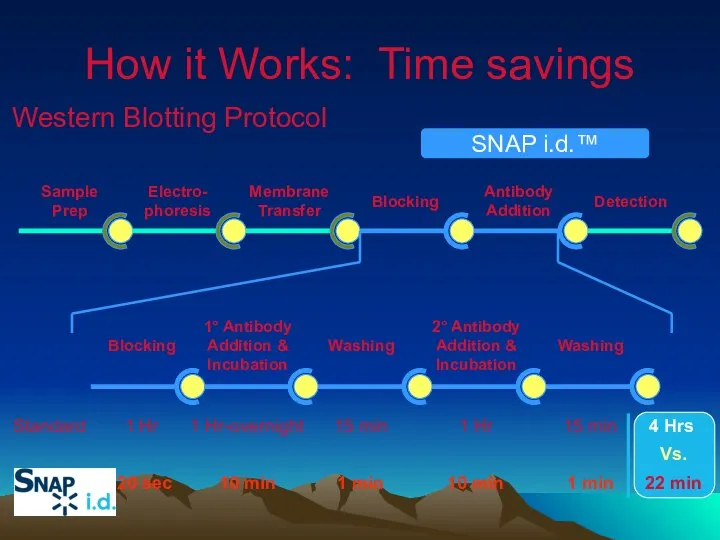
- 38. 1° Antibody Addition & Incubation Washing 2° Antibody Addition & Incubation Washing Blocking 1 Hr 1
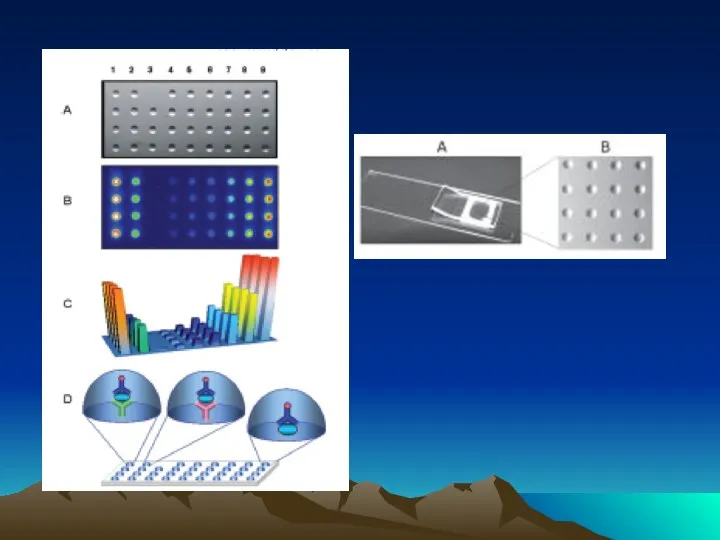
- 42. Fig. 1. The diffusion dependence of solid-phase immunoassay and methods used to reduce its influence. (A)
- 49. Методы коньюгации – иммобилизации антител на квантовых наночастицах
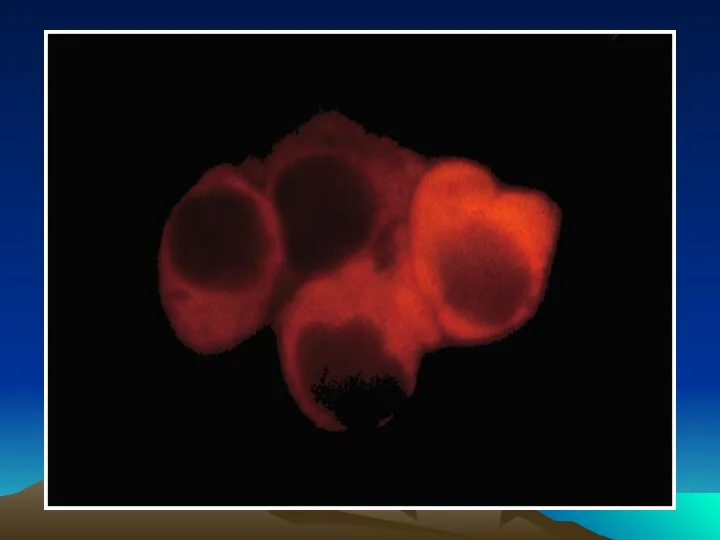
- 50. Иммунофлюоресцентный анализ среза ткани с использованием антител, меченных квантовыми наночастицами
- 53. Магнитные Наночастицы покрытые стрептавидином Биотинилированные антитела против токсина Меченные рутением вторые антитела против токсина
- 54. Чиповая технология с использованием сандвич варианта ИФА и стрептавидин биотиновой ститемы Иммобилизация первых антител на чип,
- 56. Структура нейротоксинов клостридий и молекулярные мишени Молекулы - мишени бактериальных нейротоксинов клостридий Молекула токсина предшественника Претеолитическое
- 57. Липосомы-ПЦР иммуноанализ биотоксинов Антитела Определяемый токсин Липосомы, содержащие на поверхности рецептор токсина и фрагменты ДНК внутри
- 58. Схема иммунохроматографического анализа Реагент для детекции комплексКолоидное золото-кроличьи антитела против Токсина Контрольные антитела Тест антитела Тест
- 72. Conjugated to the amino group carrying platform using tyrosinase. To assess the orientation of immobilized antibodies,
- 77. Representative atomic force microscope images of self-assembled oligomeric DNA–STV conjugates (a) and DNA–STV nanocircles (b). The
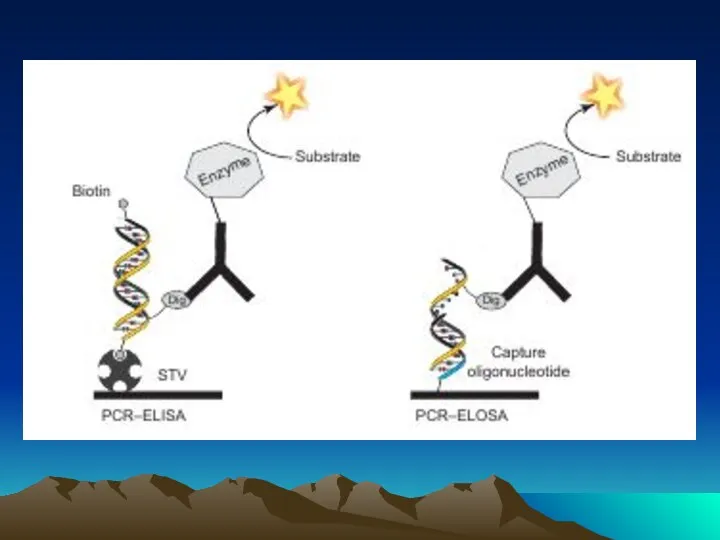
- 78. The evolution of immuno-PCR (IPCR): (A) the set-up of ELISA and IPCR is similar. Instead of
- 79. Typical results of immuno-PCR (IPCR) experiments. (A) Comparison of IPCR, the analogous conventional ELISA for the
- 80. Statistical analysis of references reporting DNA-enhanced immunoassays: (A) summary of detection limits reported. The majority of
- 81. Comparison of the most prominent methods for the detection and quantification of DNA amplicons generated in
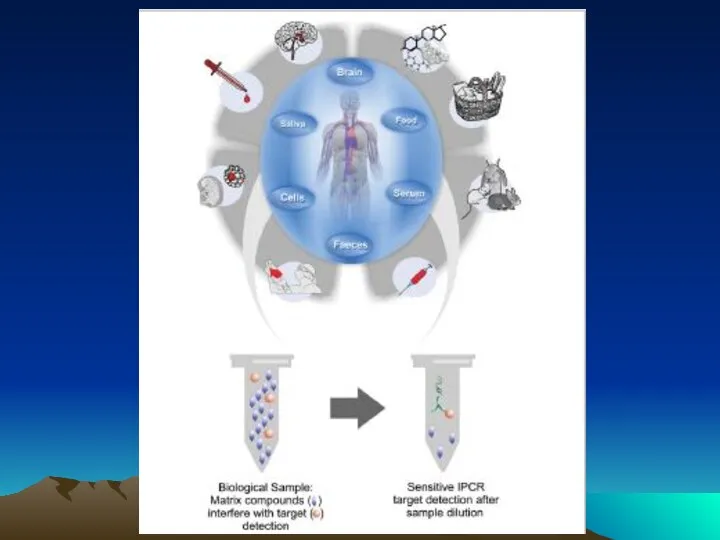
- 86. Multiplex and polyplex assays for the detection of several antigens in a single sample: in multiplex
- 88. Schematic representing the flow of reactions involved in the immuno-PCR signal amplification assay for detection of
- 89. iPCR-SA assay detection of SEA (A) or SEB (B) spiked into tryptic soy broth at select
- 90. iPCR-SA assay detection of staphylococcal enterotoxins A and B produced bySEz S. aureus strains incubated in
- 105. Скачать презентацию


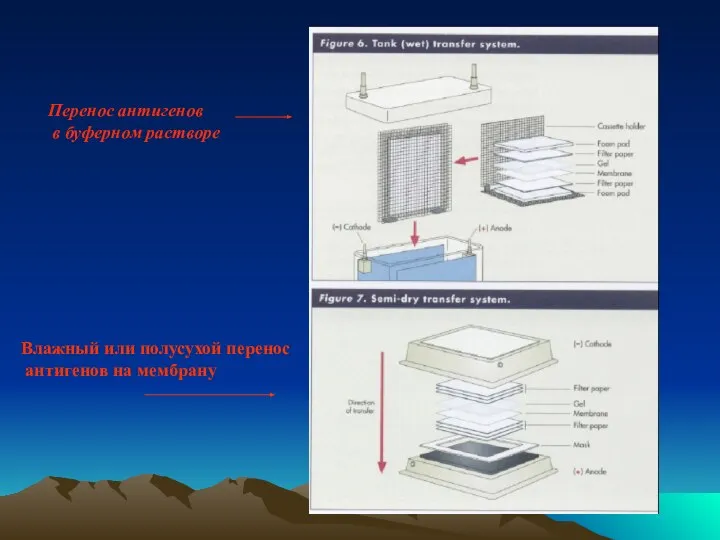
Перенос антигенов
в буферном растворе
Влажный или полусухой перенос
антигенов на мембрану
Перенос антигенов
в буферном растворе
Влажный или полусухой перенос
антигенов на мембрану
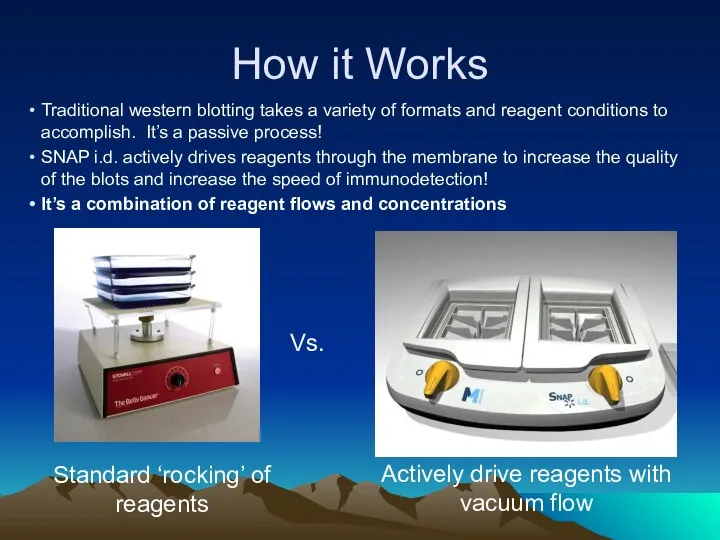
How it Works
Traditional western blotting takes a variety of formats and
How it Works
Traditional western blotting takes a variety of formats and

How it Works – reagent flows
Gentle Rocking
Reagents diffuse
slowly into membrane
Reagents rapidly
driven
How it Works – reagent flows
Gentle Rocking
Reagents diffuse
slowly into membrane
Reagents rapidly
driven
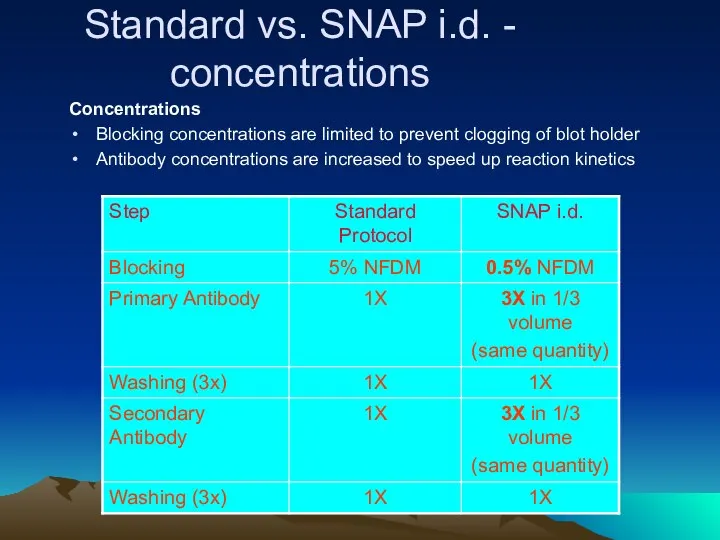
Standard vs. SNAP i.d. - concentrations
Concentrations
Blocking concentrations are limited to prevent
Standard vs. SNAP i.d. - concentrations
Concentrations
Blocking concentrations are limited to prevent
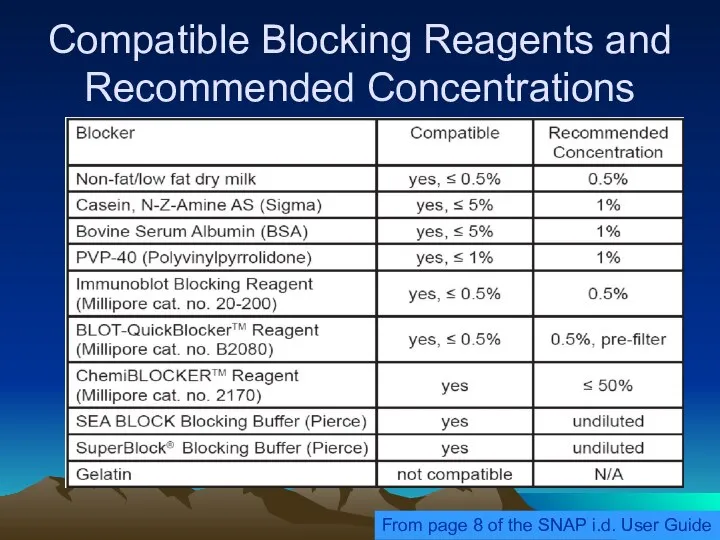
Compatible Blocking Reagents and Recommended Concentrations
From page 8 of the SNAP
Compatible Blocking Reagents and Recommended Concentrations
From page 8 of the SNAP
How it Works – reagent flows
Blocking
Efficient coverage of membrane which yields
How it Works – reagent flows
Blocking
Efficient coverage of membrane which yields
1° Antibody
Addition &
Incubation
Washing
2° Antibody
Addition &
Incubation
Washing
Blocking
1 Hr
1 Hr-overnight
15 min
1 Hr
15 min
How it
1° Antibody
Addition &
Incubation
Washing
2° Antibody
Addition &
Incubation
Washing
Blocking
1 Hr
1 Hr-overnight
15 min
1 Hr
15 min
How it


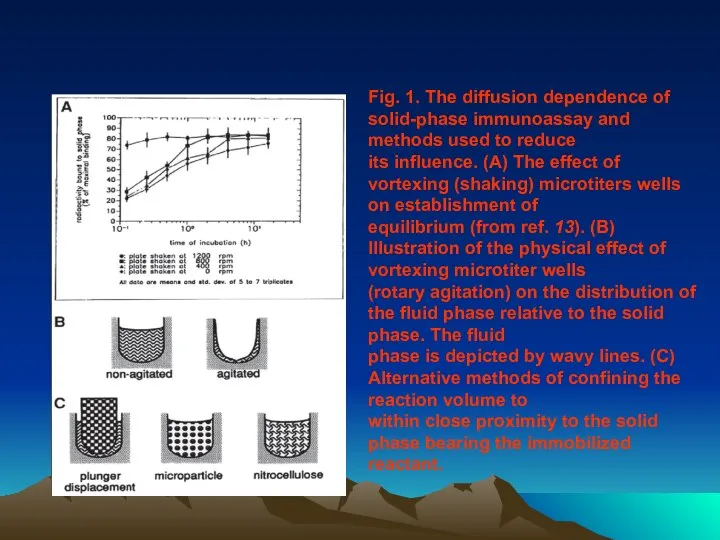
Fig. 1. The diffusion dependence of solid-phase immunoassay and methods used
Fig. 1. The diffusion dependence of solid-phase immunoassay and methods used


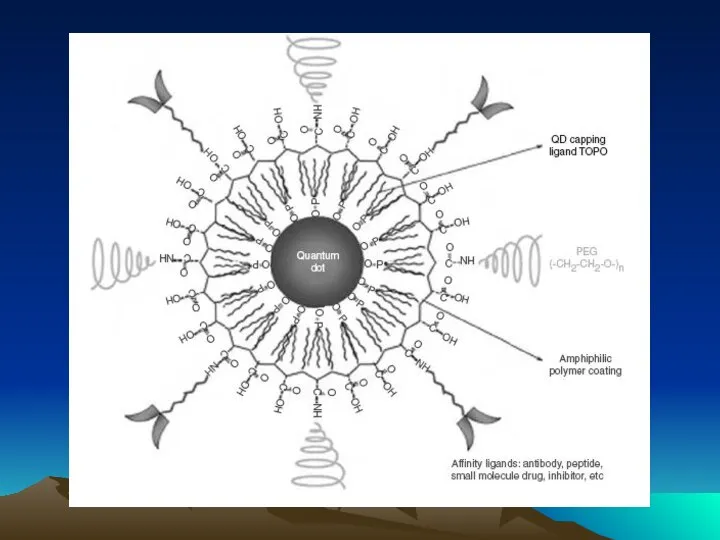
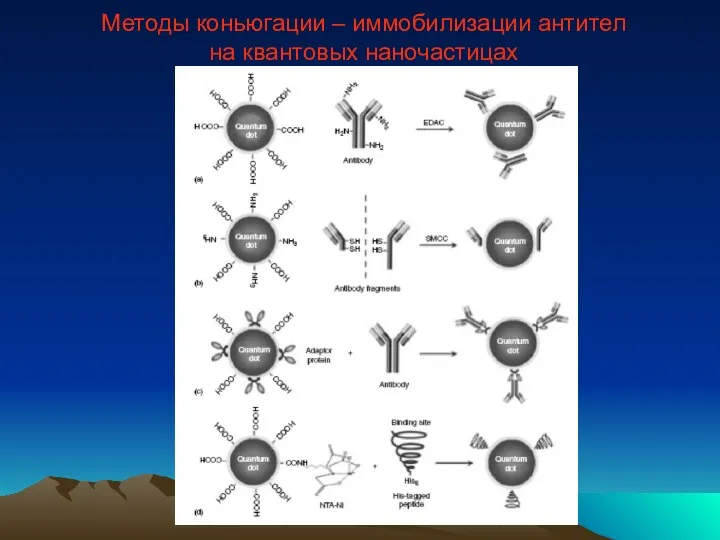
Методы коньюгации – иммобилизации антител
на квантовых наночастицах
Методы коньюгации – иммобилизации антител
на квантовых наночастицах
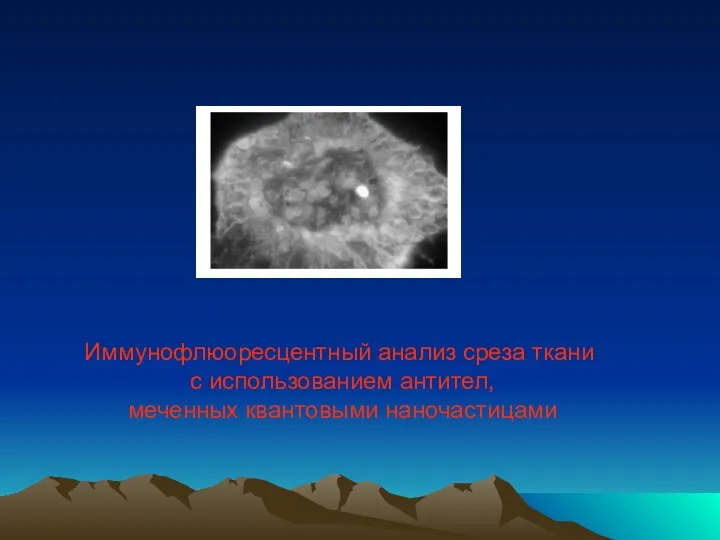
Иммунофлюоресцентный анализ среза ткани
с использованием антител,
меченных квантовыми наночастицами
Иммунофлюоресцентный анализ среза ткани
с использованием антител,
меченных квантовыми наночастицами


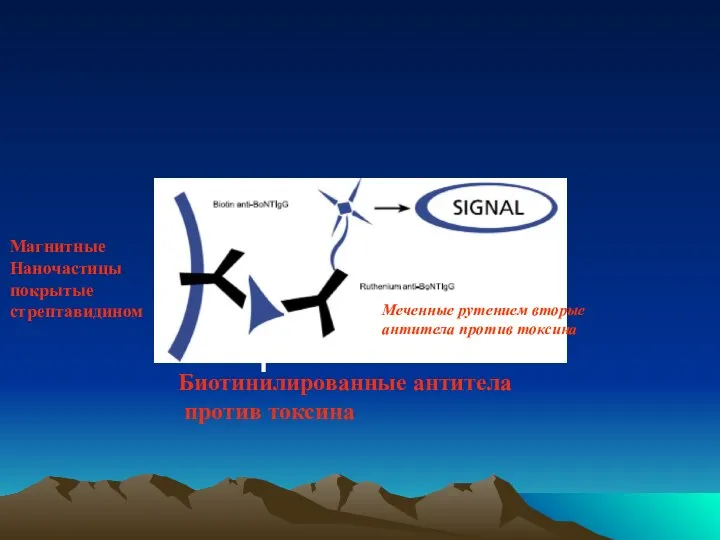
Магнитные
Наночастицы
покрытые
стрептавидином
Биотинилированные антитела
против токсина
Меченные рутением вторые
антитела против
Магнитные
Наночастицы
покрытые
стрептавидином
Биотинилированные антитела
против токсина
Меченные рутением вторые
антитела против
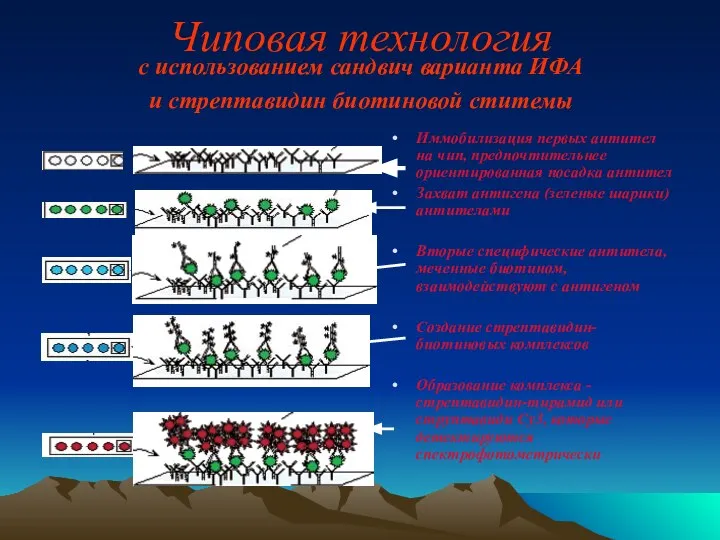
Чиповая технология
с использованием сандвич варианта ИФА
и стрептавидин биотиновой ститемы
Иммобилизация
Чиповая технология
с использованием сандвич варианта ИФА
и стрептавидин биотиновой ститемы
Иммобилизация
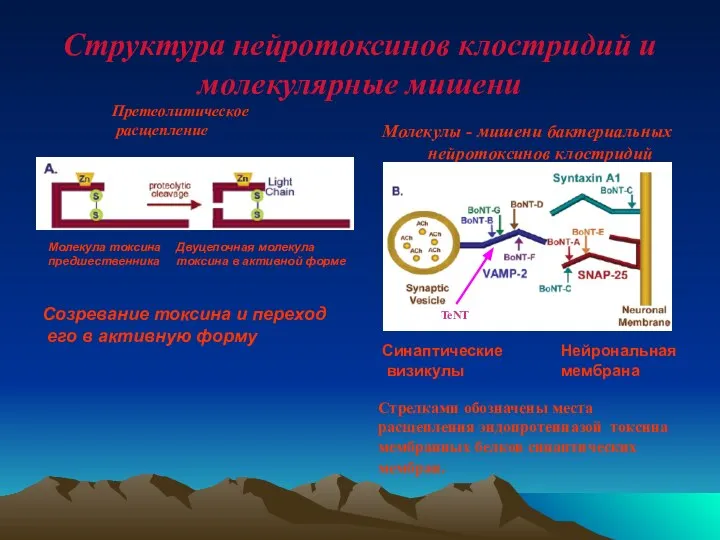
Структура нейротоксинов клостридий и молекулярные мишени
Молекулы - мишени бактериальных нейротоксинов клостридий
Молекула
Структура нейротоксинов клостридий и молекулярные мишени
Молекулы - мишени бактериальных нейротоксинов клостридий
Молекула
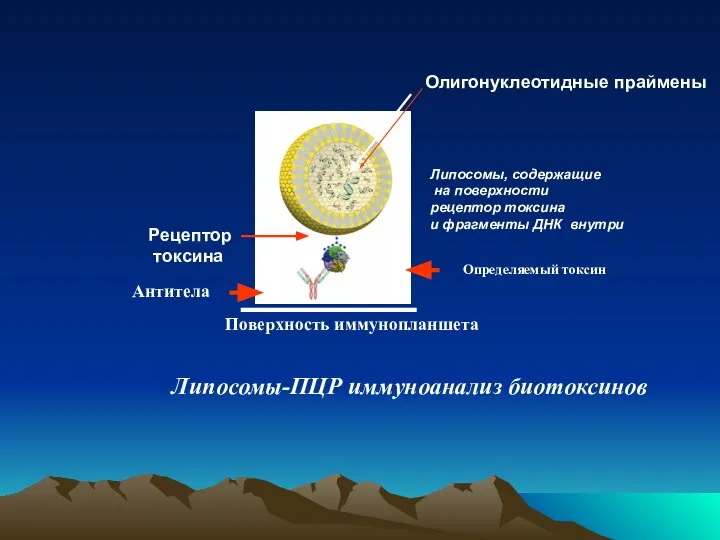
Липосомы-ПЦР иммуноанализ биотоксинов
Антитела
Определяемый токсин
Липосомы, содержащие
на поверхности
рецептор токсина
и фрагменты
Липосомы-ПЦР иммуноанализ биотоксинов
Антитела
Определяемый токсин
Липосомы, содержащие
на поверхности
рецептор токсина
и фрагменты
Схема иммунохроматографического анализа
Реагент для детекции
комплексКолоидное
золото-кроличьи антитела
против Токсина
Контрольные
антитела
Тест
Схема иммунохроматографического анализа
Реагент для детекции
комплексКолоидное
золото-кроличьи антитела
против Токсина
Контрольные
антитела
Тест


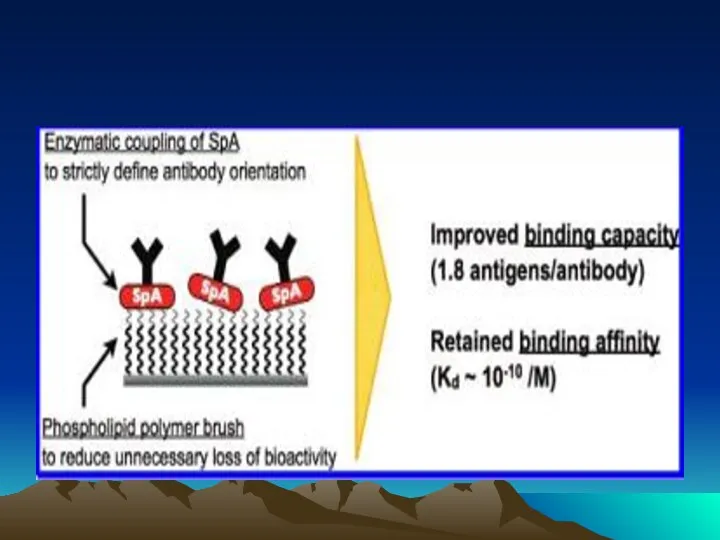

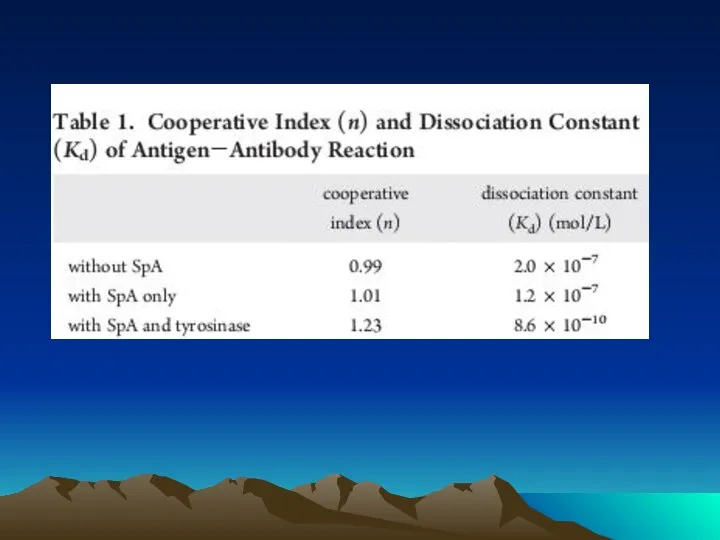
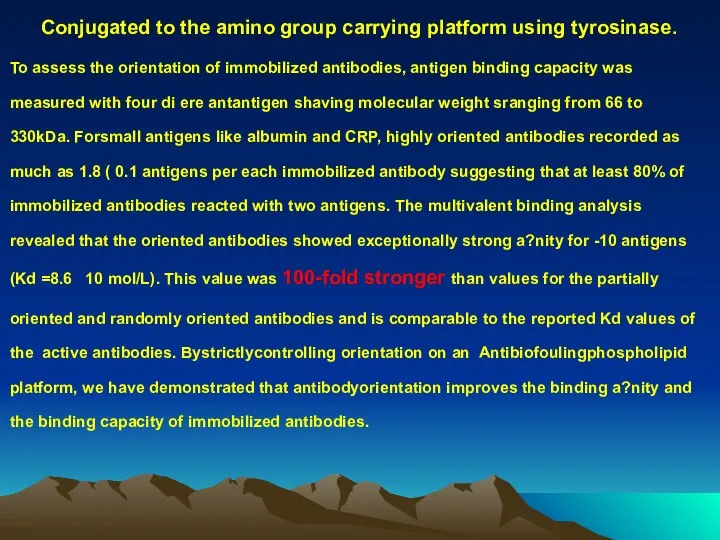
Conjugated to the amino group carrying platform using tyrosinase.
To assess
Conjugated to the amino group carrying platform using tyrosinase.
To assess


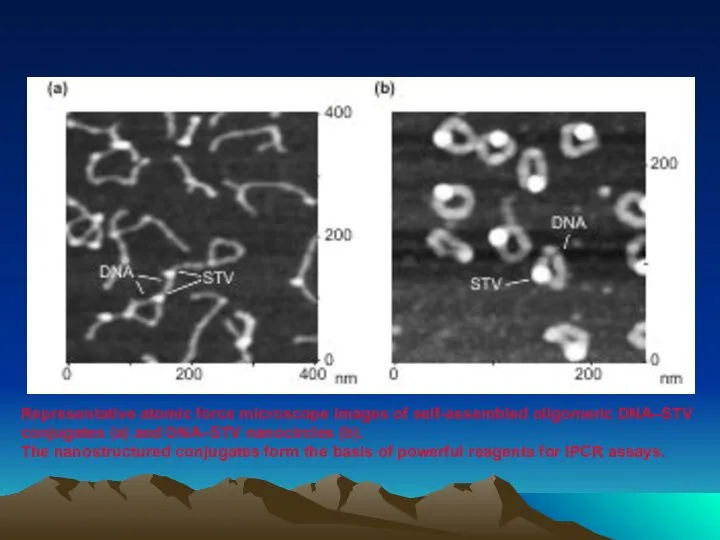
Representative atomic force microscope images of self-assembled oligomeric DNA–STV conjugates (a)
Representative atomic force microscope images of self-assembled oligomeric DNA–STV conjugates (a)
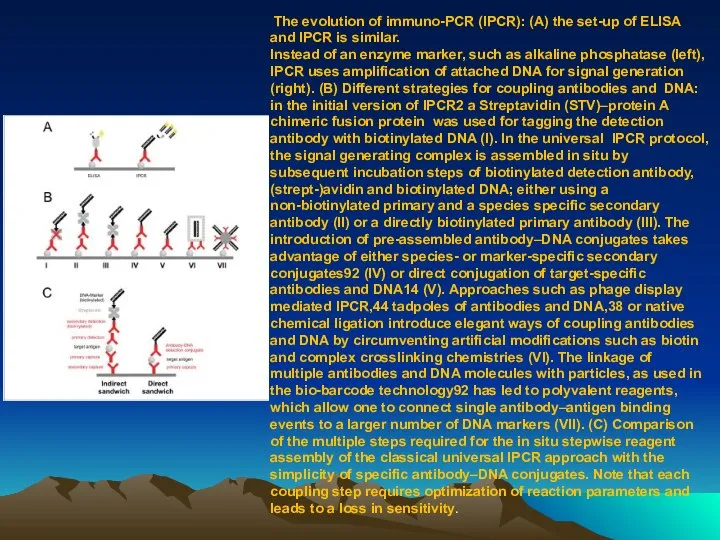
The evolution of immuno-PCR (IPCR): (A) the set-up of ELISA
The evolution of immuno-PCR (IPCR): (A) the set-up of ELISA

Typical results of immuno-PCR (IPCR) experiments. (A) Comparison of IPCR, the
analogous
Typical results of immuno-PCR (IPCR) experiments. (A) Comparison of IPCR, the
analogous
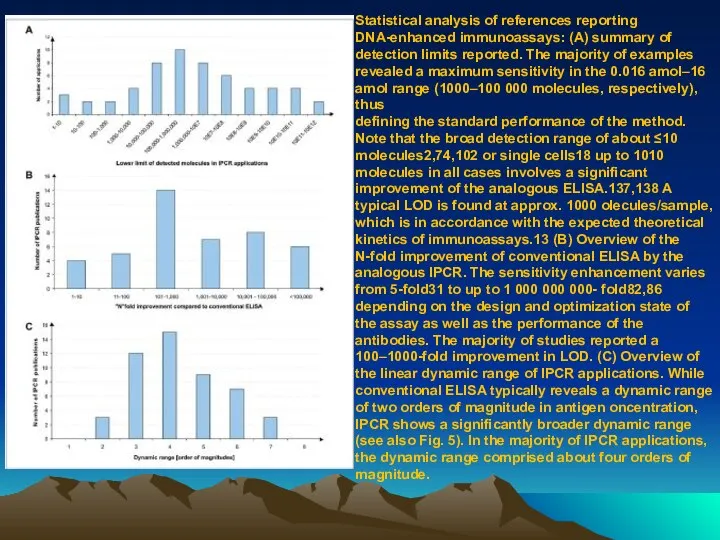
Statistical analysis of references reporting DNA-enhanced immunoassays: (A) summary of detection
Statistical analysis of references reporting DNA-enhanced immunoassays: (A) summary of detection
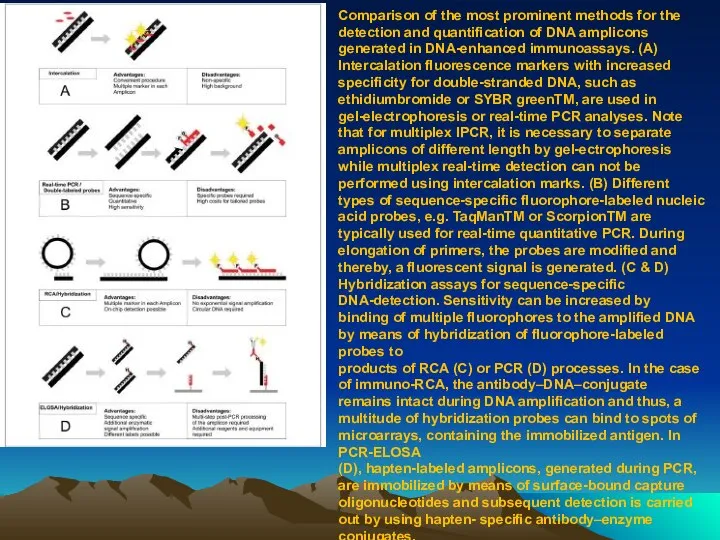
Comparison of the most prominent methods for the detection and quantification
Comparison of the most prominent methods for the detection and quantification


Multiplex and polyplex assays for the detection of several antigens in
Multiplex and polyplex assays for the detection of several antigens in
Schematic representing the flow of reactions involved in the immuno-PCR signal
Schematic representing the flow of reactions involved in the immuno-PCR signal
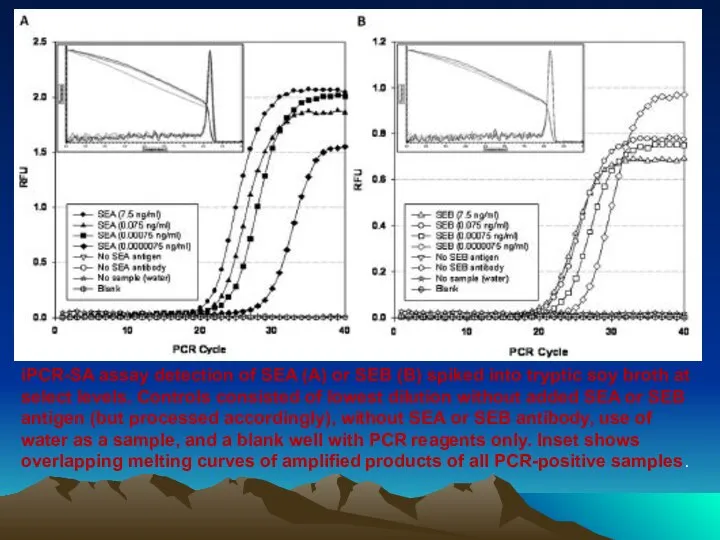
iPCR-SA assay detection of SEA (A) or SEB (B) spiked into
iPCR-SA assay detection of SEA (A) or SEB (B) spiked into
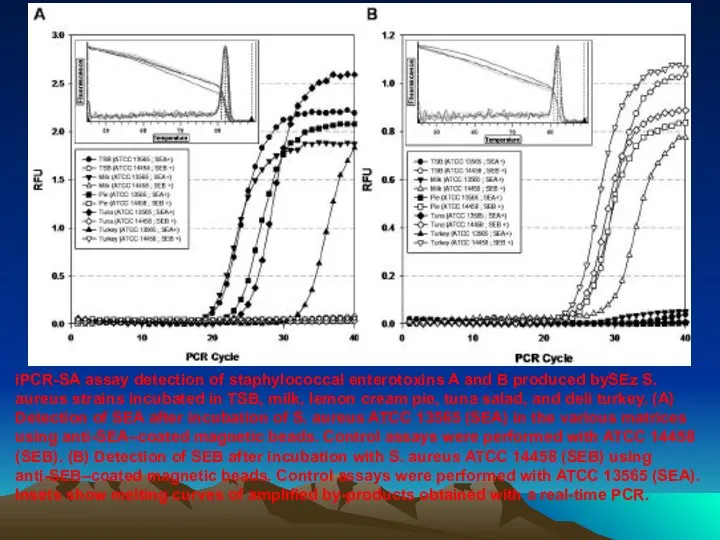
iPCR-SA assay detection of staphylococcal enterotoxins A and B produced bySEz
iPCR-SA assay detection of staphylococcal enterotoxins A and B produced bySEz


 Альдегиды и кетоны
 Машиностроительные материалы
 Изучение свойств пластичных масс для лепки
 Нанотехнологии. Методы получения наноматериалов. (Лекция 2)
 Химический диктант как метод формирующего оценивания
 Тағамдық қоспалардың функционалдық жүктелуі және олардың сипаттамасы
 Сравнительный анализ Фармакопейных статей для субстанций, представленных в мировых Фармакопеях
 Решение задач на нахождение молекулярной формулы органических веществ
 Дисахариды и полисахариды
 Атомның электрондық конфегурациясы
 Скорость химической реакции
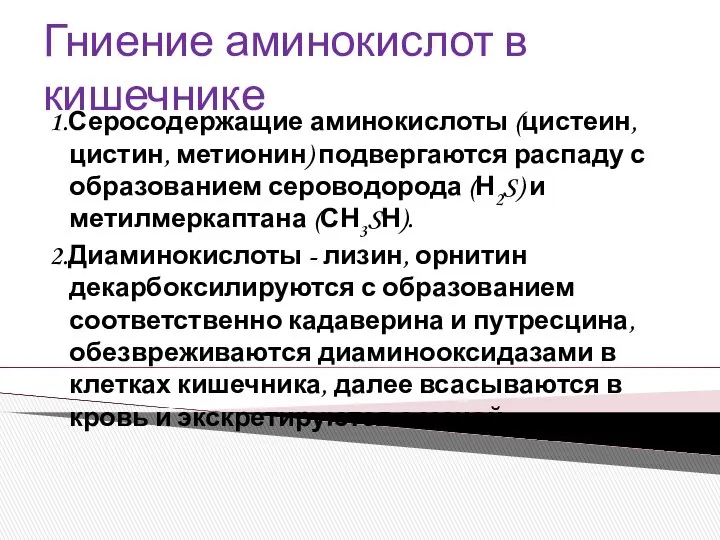 Гниение аминокислот в кишечнике
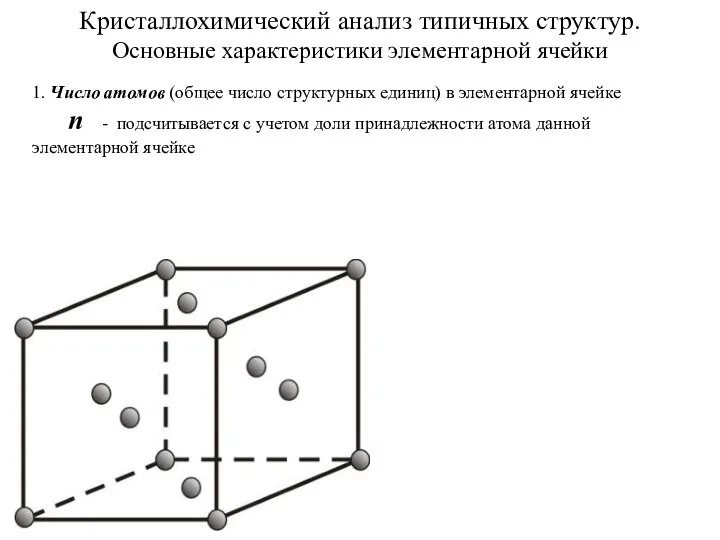 Кристаллохимический анализ типичных структур. Основные характеристики элементарной ячейки
 Растворы. Термодинамическая теория растворов
 Элементы группы VII B
 Экологический проект Тема: Лабораторное исследование химического состава чипсов Работу выполнила Купавцева Татьяна
  Изучение фотокатализа в химии
 Основное уравнение молекулярно-кинетической теории
 Яблочная кладовая Автор работы: Быстрова Анастасия, ученица 9«А» класса Руководитель: Баранова Алевтина Владимировна 2010
 Презентация по Химии "Белки" - скачать смотреть _
 Металлы. Общая характеристика
 Своя игра «Знаешь ли ты химические элементы?»
 Свойства металла. Подготовительная группа 2
 Адсорбционные равновесия и процессы на подвижных и неподвижных границах раздела фаз
 Закон сохранения массы веществ Омельянчук Т.Е. учитель химии МАОУ ДСОШ №2 г. Домодедово
 Основы МКТ
 Жири. Жири в природі. Біологічна роль жирів. Жири. Жири в природі. Біологічна роль жирів.
  ДИВІНИЛОВИЙ КАУЧУК Підготували Реутенко А., Даниленко А., 11-А