- Simultaneous games. Oligopoly. (Lecture 2)

Содержание
- 2. Oligopoly Extreme forms of market structure are uncomplicated: Monopoly: one producer, no strategic interaction Perfect competition:
- 3. Strategic interactions and oligopoly When making strategic decisions (on prices, quantity, advertising, innovation etc.) the oligopolist
- 4. Demand and costs Demand: The market price is a function of the total quantity produced in
- 5. Monopoly The monopolist chooses Q to maximize profit: Outcome: Low output to keep prices high and
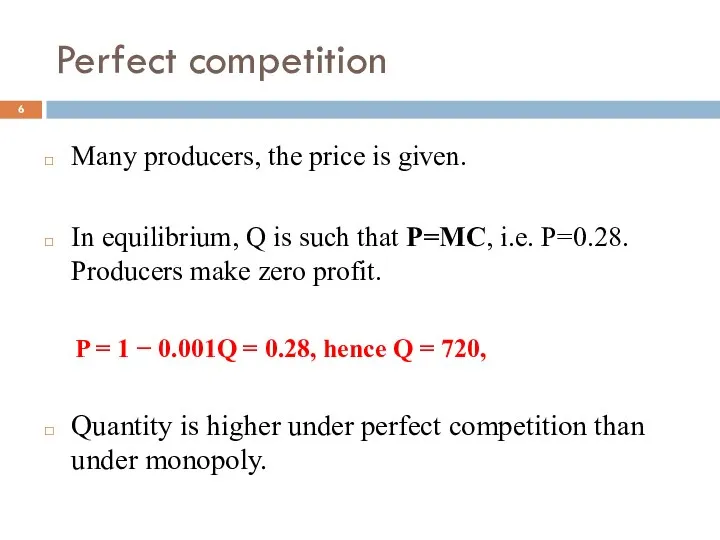
- 6. Perfect competition Many producers, the price is given. In equilibrium, Q is such that P=MC, i.e.
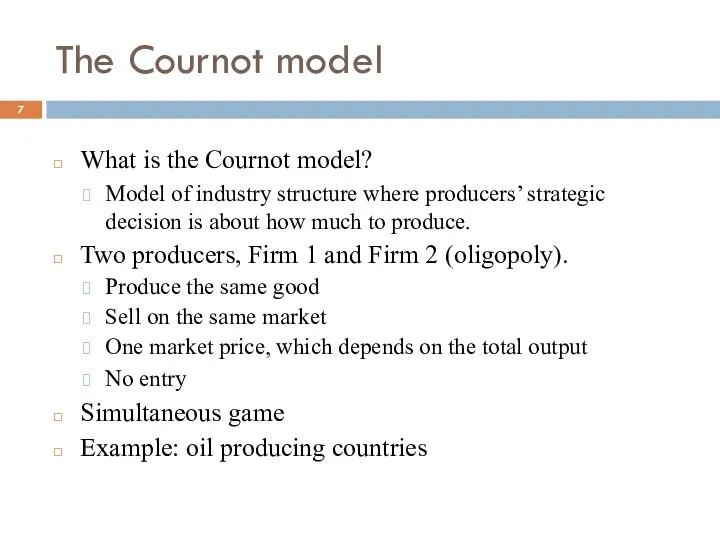
- 7. The Cournot model What is the Cournot model? Model of industry structure where producers’ strategic decision
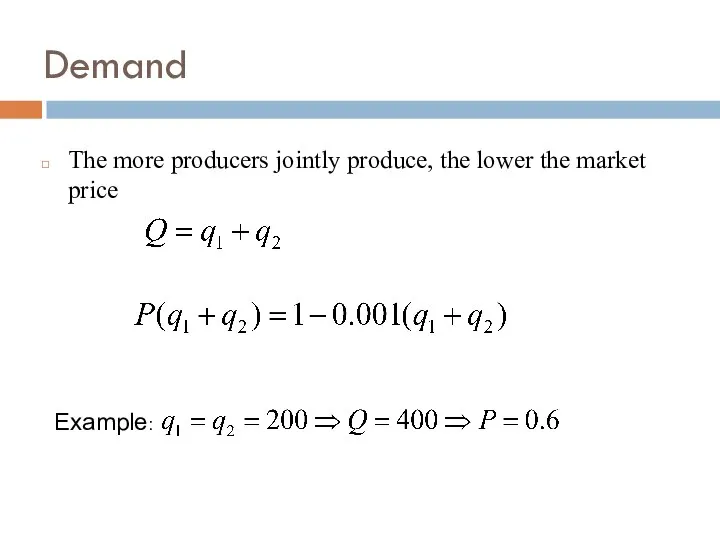
- 8. Demand The more producers jointly produce, the lower the market price Example:
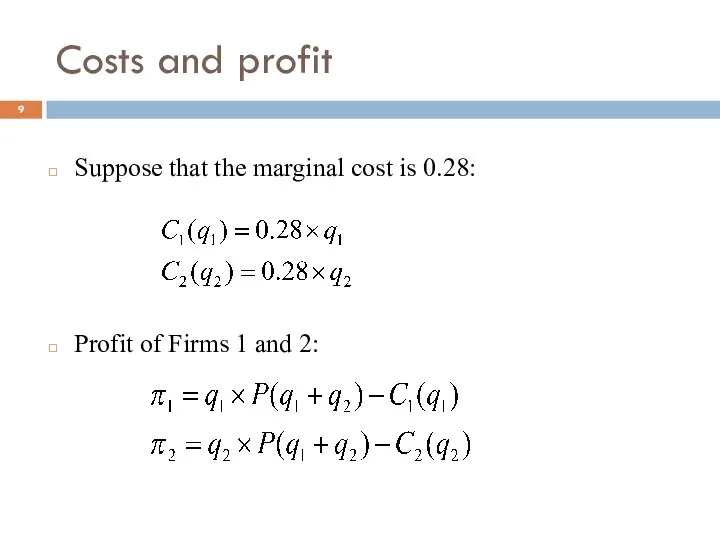
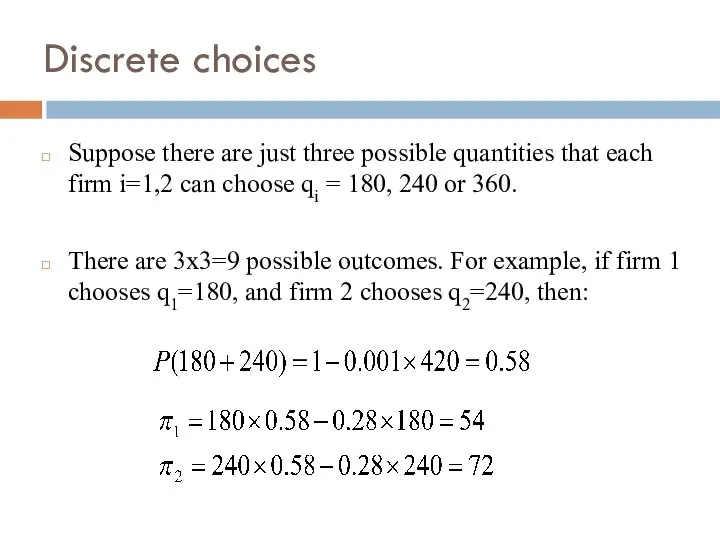
- 9. Costs and profit Suppose that the marginal cost is 0.28: Profit of Firms 1 and 2:
- 10. Discrete choices Suppose there are just three possible quantities that each firm i=1,2 can choose qi
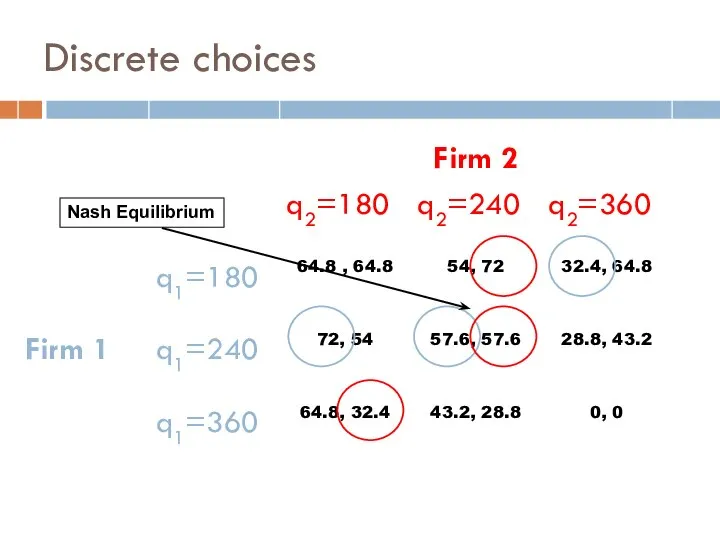
- 11. Discrete choices Nash Equilibrium
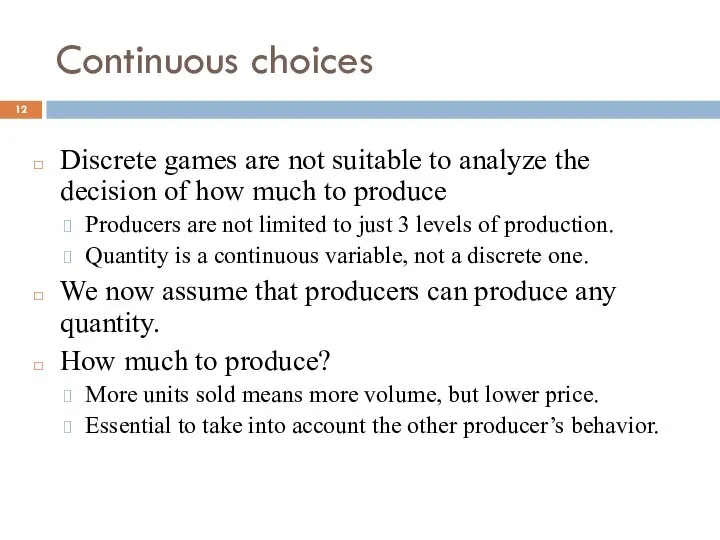
- 12. Continuous choices Discrete games are not suitable to analyze the decision of how much to produce
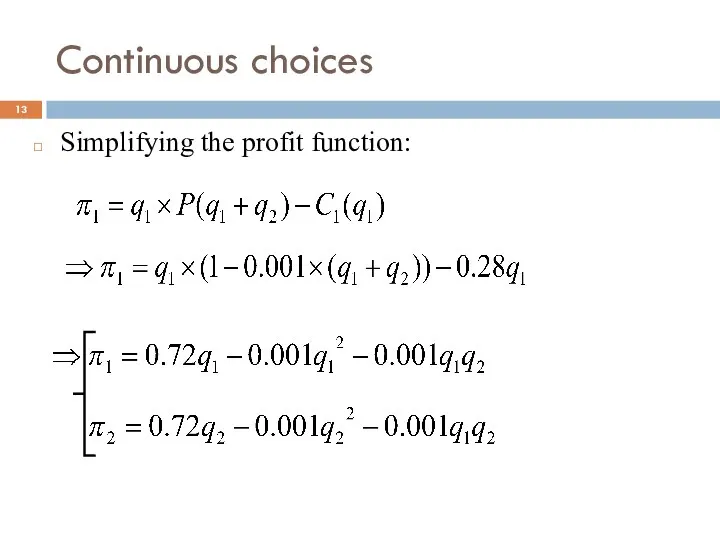
- 13. Continuous choices Simplifying the profit function:
- 14. Best responses We find the Nash equilibrium by deriving the best response functions. To maximize profit,
- 15. Best responses
- 16. Best responses 360 720 q1 q2 0 The more Firm 2 produces, the lower the market
- 17. 360 720 q1 q2 Best responses Firm 2’s best response The more Firm 1 produces, the
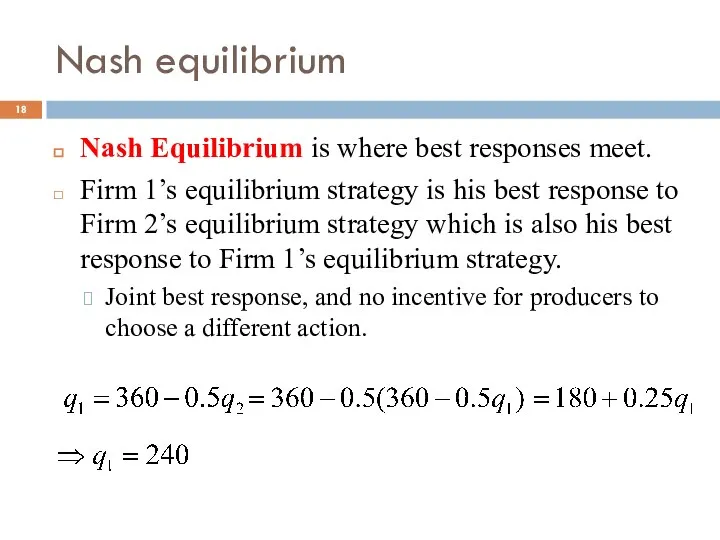
- 18. Nash equilibrium Nash Equilibrium is where best responses meet. Firm 1’s equilibrium strategy is his best
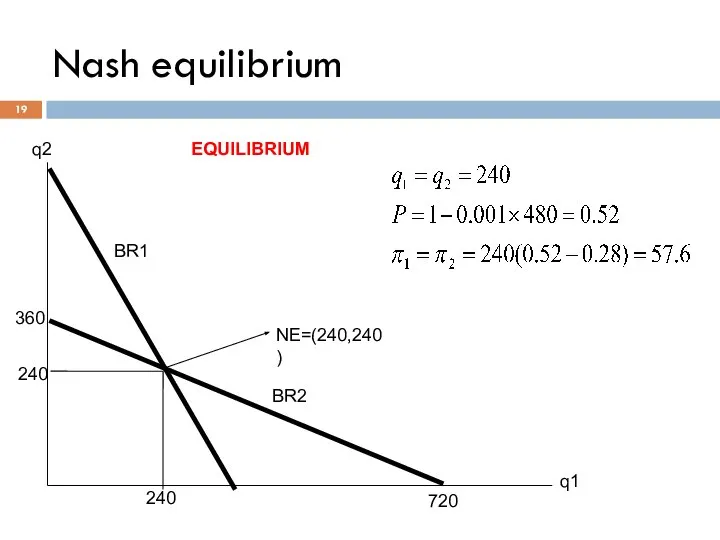
- 19. 360 720 q1 q2 NE=(240,240) Nash equilibrium EQUILIBRIUM BR1 BR2 240 240
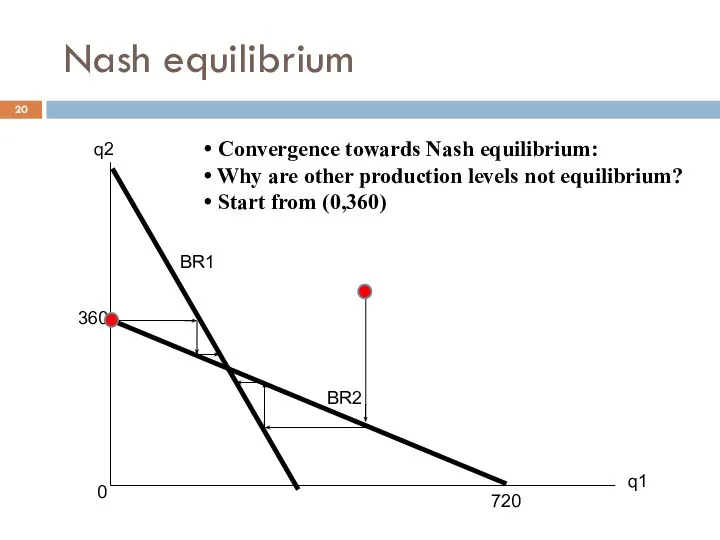
- 20. Nash equilibrium 360 720 q1 q2 Convergence towards Nash equilibrium: Why are other production levels not
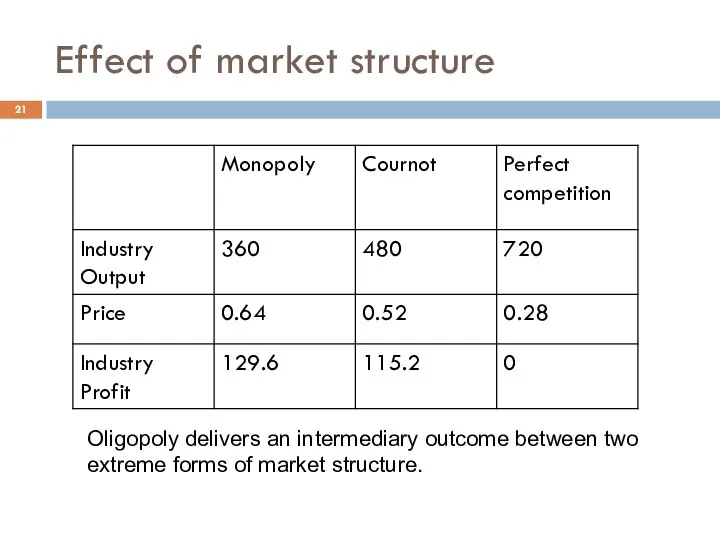
- 21. Effect of market structure Oligopoly delivers an intermediary outcome between two extreme forms of market structure.
- 22. Effect of market structure Cournot with more than 2 producers:
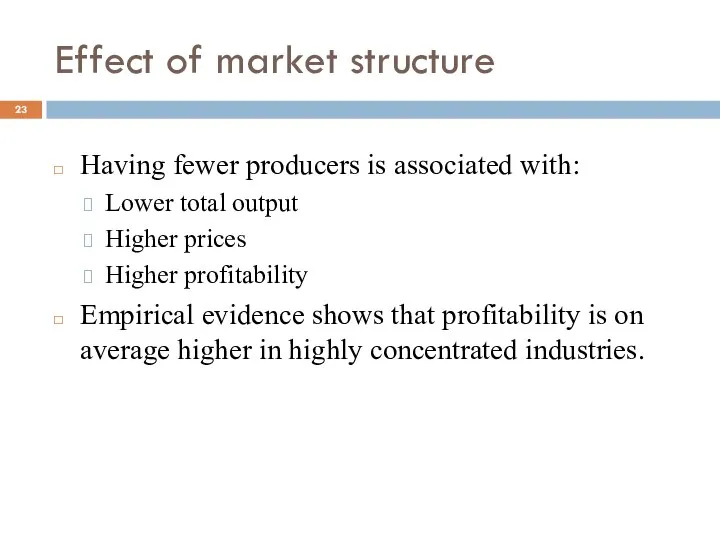
- 23. Effect of market structure Having fewer producers is associated with: Lower total output Higher prices Higher
- 24. Wouldn’t the two producers be better off cooperating rather than competing? YES Both producers could maximize
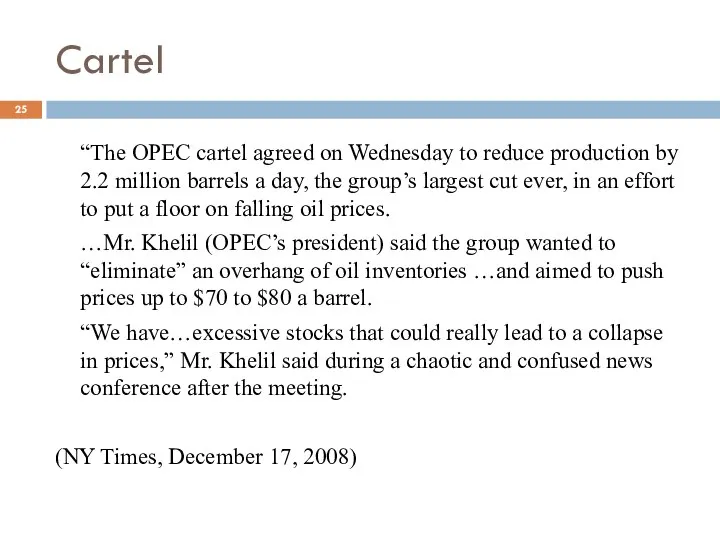
- 25. Cartel “The OPEC cartel agreed on Wednesday to reduce production by 2.2 million barrels a day,
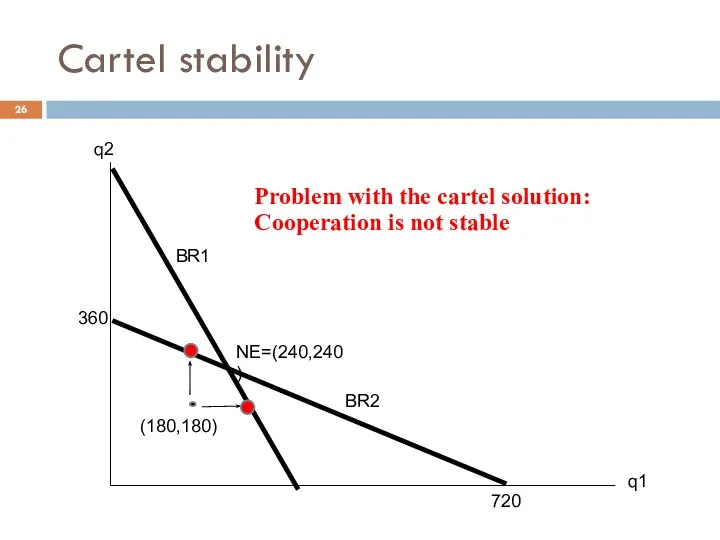
- 26. 360 720 q1 q2 NE=(240,240) Cartel stability BR1 BR2 (180,180) Problem with the cartel solution: Cooperation
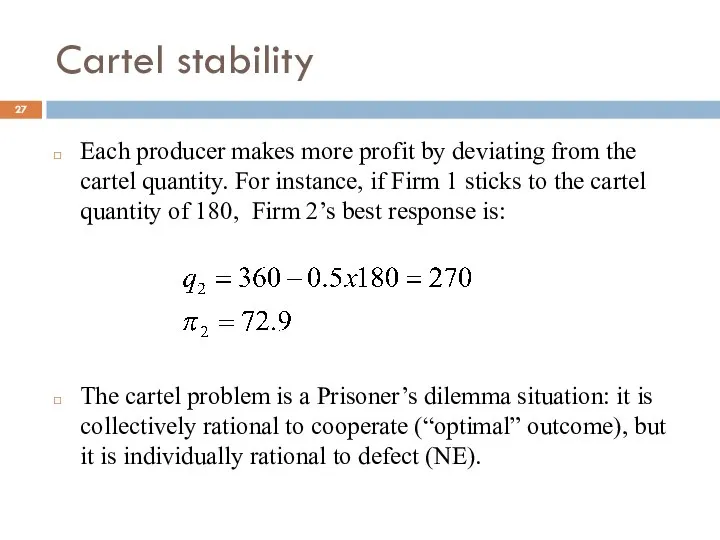
- 27. Cartel stability Each producer makes more profit by deviating from the cartel quantity. For instance, if
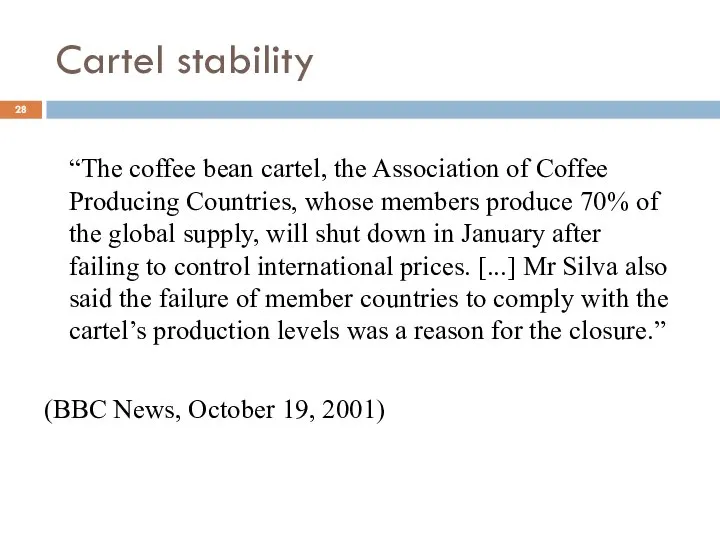
- 28. Cartel stability “The coffee bean cartel, the Association of Coffee Producing Countries, whose members produce 70%
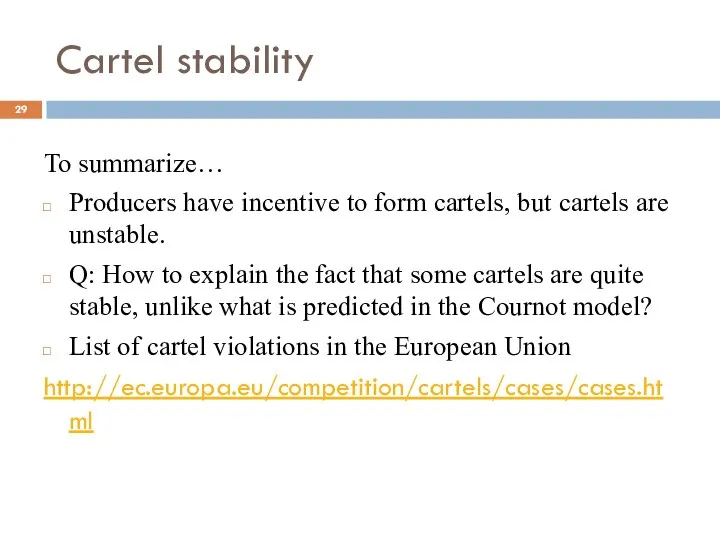
- 29. Cartel stability To summarize… Producers have incentive to form cartels, but cartels are unstable. Q: How
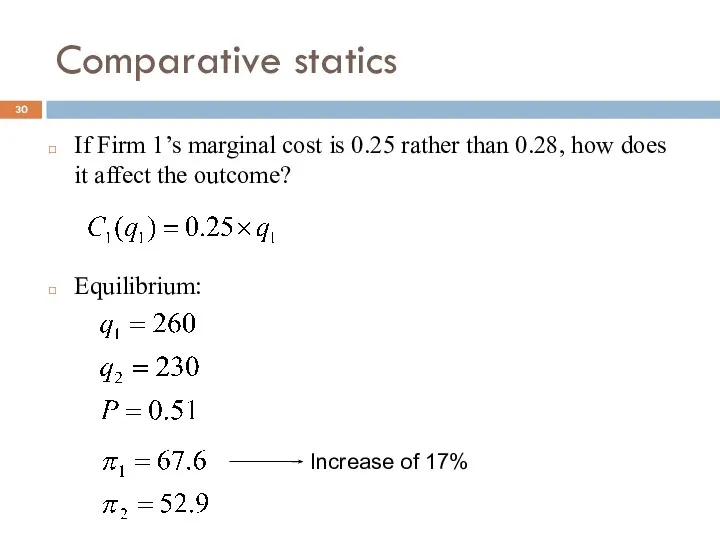
- 30. Comparative statics If Firm 1’s marginal cost is 0.25 rather than 0.28, how does it affect
- 32. Скачать презентацию
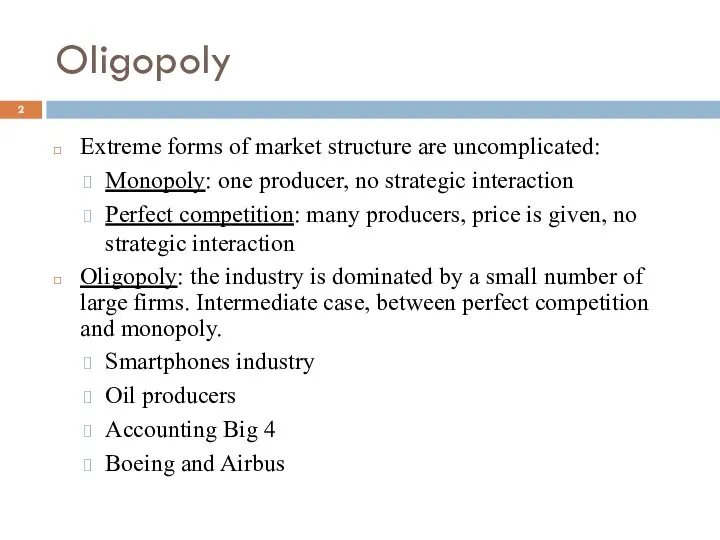
Oligopoly
Extreme forms of market structure are uncomplicated:
Monopoly: one producer, no strategic
Oligopoly
Extreme forms of market structure are uncomplicated:
Monopoly: one producer, no strategic
Strategic interactions and oligopoly
When making strategic decisions (on prices, quantity, advertising,
Strategic interactions and oligopoly
When making strategic decisions (on prices, quantity, advertising,
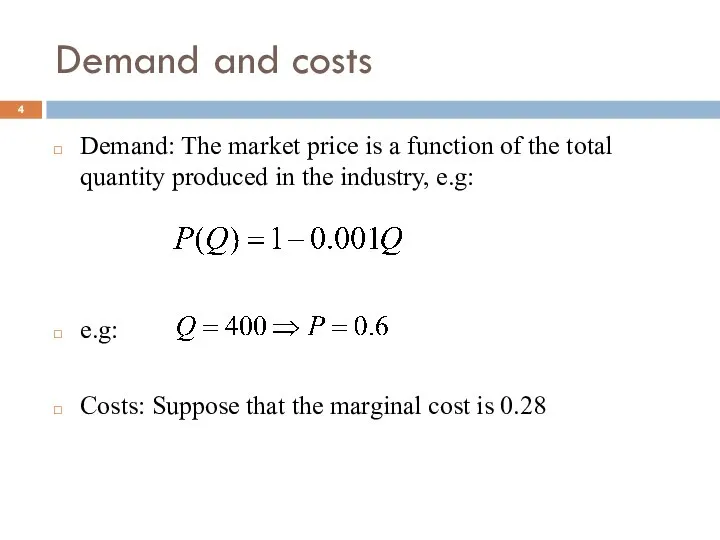
Demand and costs
Demand: The market price is a function of the
Demand and costs
Demand: The market price is a function of the
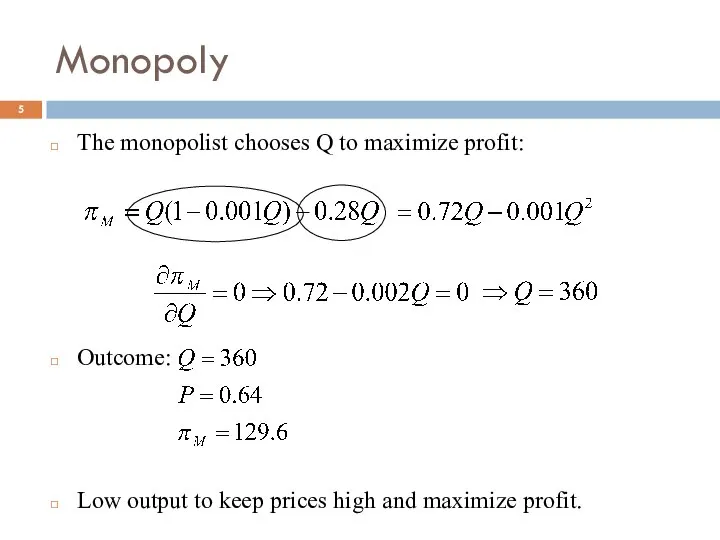
Monopoly
The monopolist chooses Q to maximize profit:
Outcome:
Low output to keep prices
Monopoly
The monopolist chooses Q to maximize profit:
Outcome:
Low output to keep prices
Perfect competition
Many producers, the price is given.
In equilibrium, Q is such
Perfect competition
Many producers, the price is given.
In equilibrium, Q is such
The Cournot model
What is the Cournot model?
Model of industry structure where
The Cournot model
What is the Cournot model?
Model of industry structure where
Demand
The more producers jointly produce, the lower the market price
Example:
Demand
The more producers jointly produce, the lower the market price
Example:
Costs and profit
Suppose that the marginal cost is 0.28:
Profit of Firms
Costs and profit
Suppose that the marginal cost is 0.28:
Profit of Firms
Discrete choices
Suppose there are just three possible quantities that each firm
Discrete choices
Suppose there are just three possible quantities that each firm
Discrete choices
Nash Equilibrium
Discrete choices
Nash Equilibrium
Continuous choices
Discrete games are not suitable to analyze the decision of
Continuous choices
Discrete games are not suitable to analyze the decision of
Continuous choices
Simplifying the profit function:
Continuous choices
Simplifying the profit function:
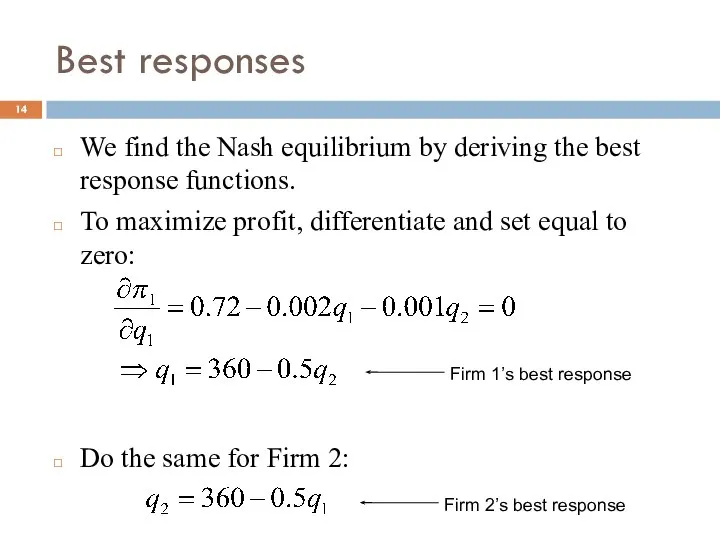
Best responses
We find the Nash equilibrium by deriving the best response
Best responses
We find the Nash equilibrium by deriving the best response
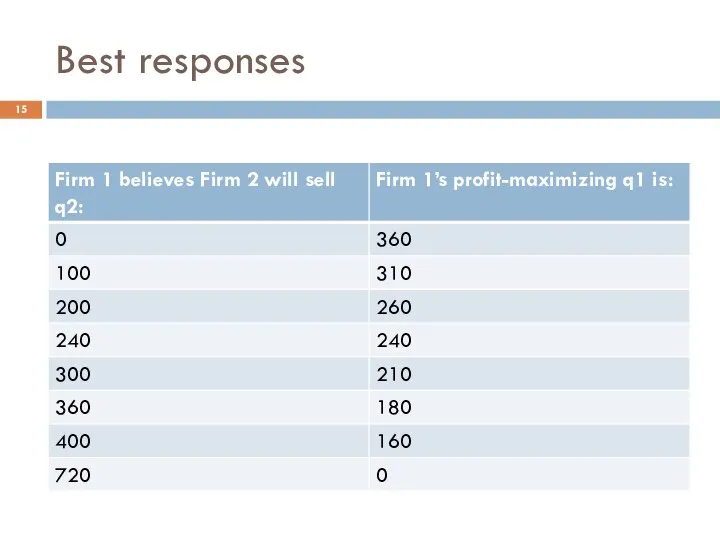
Best responses
Best responses
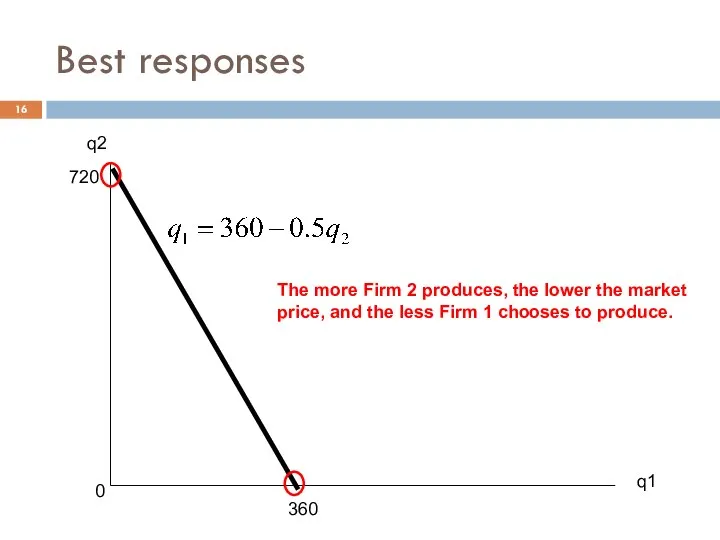
Best responses
360
720
q1
q2
0
The more Firm 2 produces, the lower the market
price, and
Best responses
360
720
q1
q2
0
The more Firm 2 produces, the lower the market
price, and
360
720
q1
q2
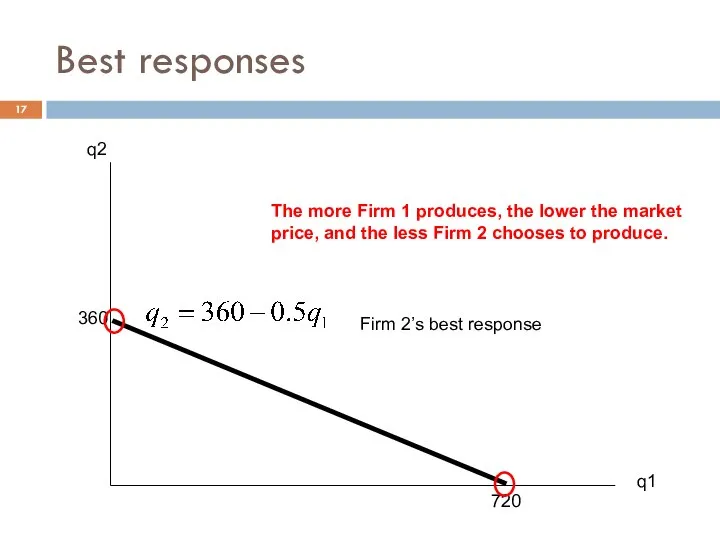
Best responses
Firm 2’s best response
The more Firm 1 produces, the lower
360
720
q1
q2
Best responses
Firm 2’s best response
The more Firm 1 produces, the lower
Nash equilibrium
Nash Equilibrium is where best responses meet.
Firm 1’s equilibrium strategy
Nash equilibrium
Nash Equilibrium is where best responses meet.
Firm 1’s equilibrium strategy
360
720
q1
q2
NE=(240,240)
Nash equilibrium
EQUILIBRIUM
BR1
BR2
240
240
360
720
q1
q2
NE=(240,240)
Nash equilibrium
EQUILIBRIUM
BR1
BR2
240
240
Nash equilibrium
360
720
q1
q2
Convergence towards Nash equilibrium:
Why are other production levels
Nash equilibrium
360
720
q1
q2
Convergence towards Nash equilibrium:
Why are other production levels
Effect of market structure
Oligopoly delivers an intermediary outcome between two
extreme forms
Effect of market structure
Oligopoly delivers an intermediary outcome between two
extreme forms

Effect of market structure
Cournot with more than 2 producers:
Effect of market structure
Cournot with more than 2 producers:
Effect of market structure
Having fewer producers is associated with:
Lower total output
Higher
Effect of market structure
Having fewer producers is associated with:
Lower total output
Higher
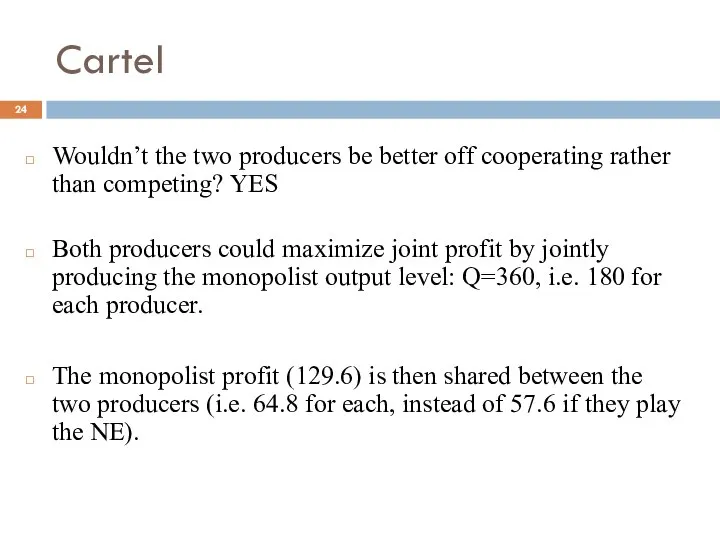
Wouldn’t the two producers be better off cooperating rather than competing?
Wouldn’t the two producers be better off cooperating rather than competing?
Cartel
“The OPEC cartel agreed on Wednesday to reduce production by 2.2
Cartel
“The OPEC cartel agreed on Wednesday to reduce production by 2.2
360
720
q1
q2
NE=(240,240)
Cartel stability
BR1
BR2
(180,180)
Problem with the cartel solution:
Cooperation is not stable
360
720
q1
q2
NE=(240,240)
Cartel stability
BR1
BR2
(180,180)
Problem with the cartel solution:
Cooperation is not stable
Cartel stability
Each producer makes more profit by deviating from the cartel
Cartel stability
Each producer makes more profit by deviating from the cartel
Cartel stability
“The coffee bean cartel, the Association of Coffee Producing Countries,
Cartel stability
“The coffee bean cartel, the Association of Coffee Producing Countries,
Cartel stability
To summarize…
Producers have incentive to form cartels, but cartels are
Cartel stability
To summarize…
Producers have incentive to form cartels, but cartels are
Comparative statics
If Firm 1’s marginal cost is 0.25 rather than 0.28,
Comparative statics
If Firm 1’s marginal cost is 0.25 rather than 0.28,
 Функция y = x2 и её график
 Техника формирования граф логических структур
 Презентация на тему Разложение на простые множители
 Ранний детский аутизм (РДА)
 Прямоугольный параллелепипед
 Количественные характеристики случайных переменных
 Доверительный интервал и его друзья
 Предмет цель и задачи теории массового обслуживания
 РЕШЕНИЕ ТРИГОНОМЕТРИЧЕСКИХ УРАВНЕНИЙ НА ИНТЕРВАЛЕ. Урок № 18
  Математические основы описания результатов исследования
 Логика предикатов
 Готовимся к ЕГЭ
 Arccos. Решение уравнений cost=a
 Гармония и геометрия
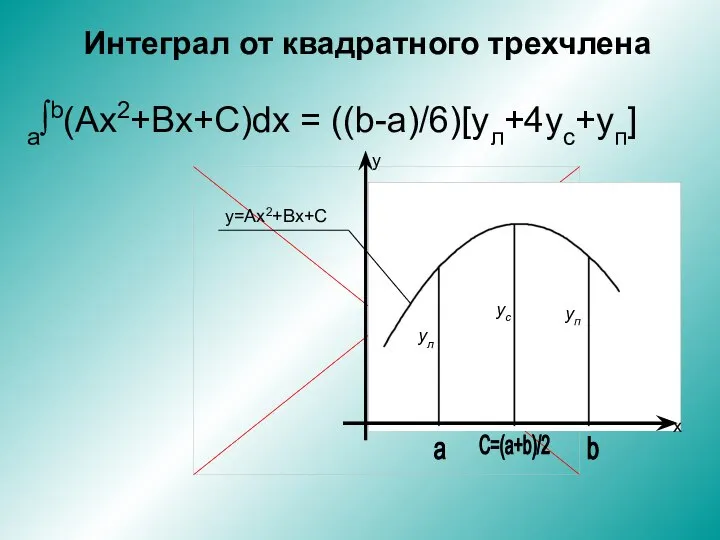 Интеграл от квадратного трехчлена
 Приём умножения и деления на 10
 Математическая логика. (Тема 2)
 Системы линейных уравнений
 Презентация по математике "Линейные уравнения с одной переменной" - скачать
  Геометрические задачи С2, по материалам ЕГЭ
 Презентация по математике "Решение уравнений n-й степени, n>2. Нахождение корней многочленов" - скачать
  Решение пределов
 Рациональные числа и действия над ними
 График функции
 Задачи военно-прикладного характера Вклад ученых математиков в оборонную мощь страны во время Великой Отечественной войны.
 Тема урока: Приращение функции
 Применение производных в математике и физике
 Презентация по математике "Решение неравенств методом интервалов" - скачать бесплатно