- Using numerical measures to describe data. Measures of the center. Week 3 (2)

Содержание
- 2. Using numerical measures to describe data «Is the data in the sample centered or located around
- 3. Using numerical measures to describe data The histogram gives an idea whether the data is centered
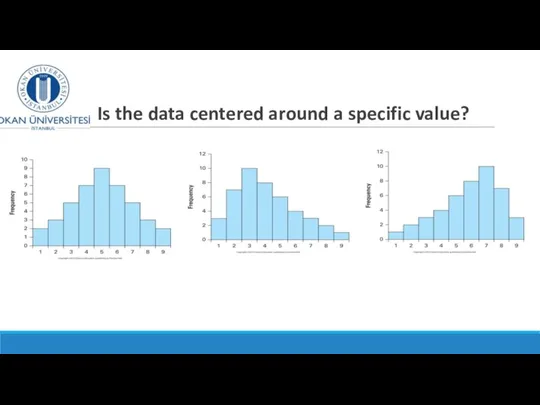
- 4. Is the data centered around a specific value?
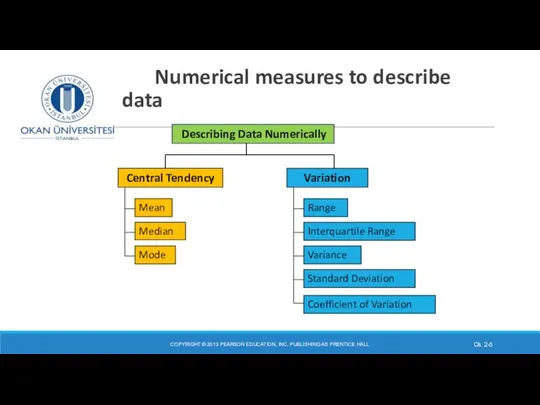
- 5. Numerical measures to describe data COPYRIGHT © 2013 PEARSON EDUCATION, INC. PUBLISHING AS PRENTICE HALL Ch.
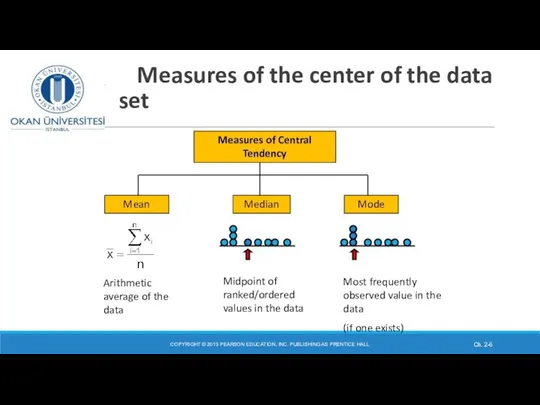
- 6. Measures of the center of the data set COPYRIGHT © 2013 PEARSON EDUCATION, INC. PUBLISHING AS
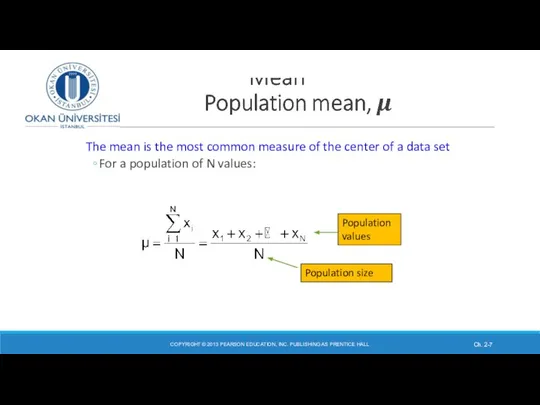
- 7. The mean is the most common measure of the center of a data set For a
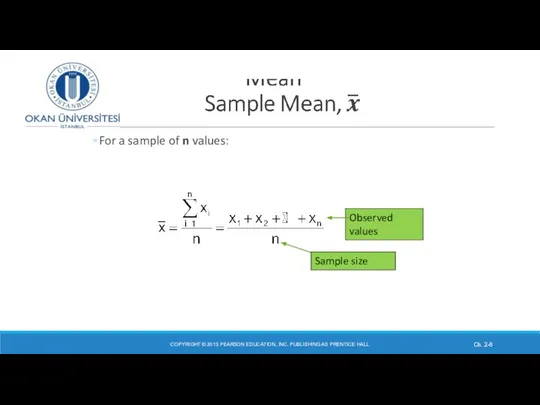
- 8. For a sample of n values: COPYRIGHT © 2013 PEARSON EDUCATION, INC. PUBLISHING AS PRENTICE HALL
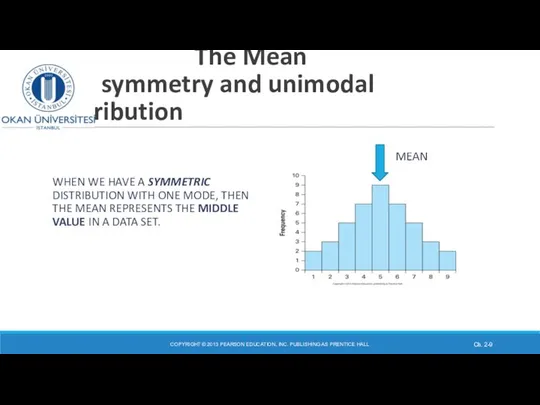
- 9. The Mean symmetry and unimodal distribution WHEN WE HAVE A SYMMETRIC DISTRIBUTION WITH ONE MODE, THEN
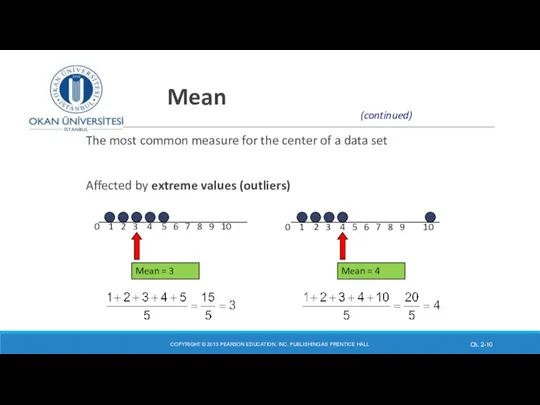
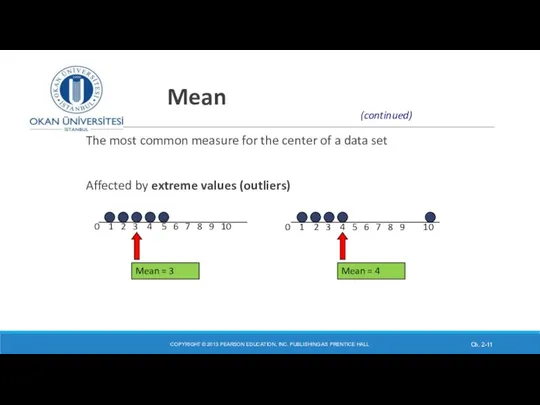
- 10. Mean The most common measure for the center of a data set Affected by extreme values
- 11. Mean The most common measure for the center of a data set Affected by extreme values
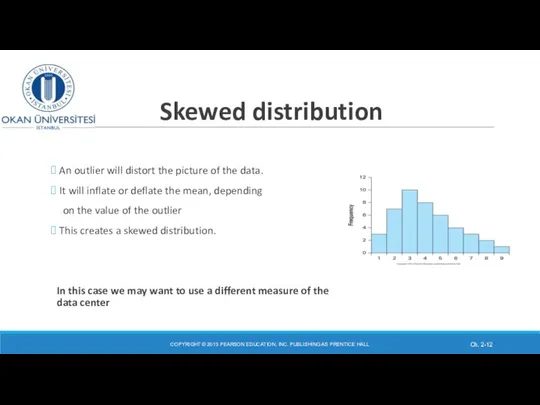
- 12. Skewed distribution An outlier will distort the picture of the data. It will inflate or deflate
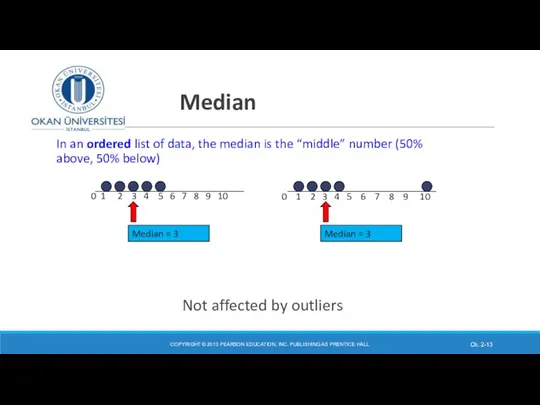
- 13. Median In an ordered list of data, the median is the “middle” number (50% above, 50%
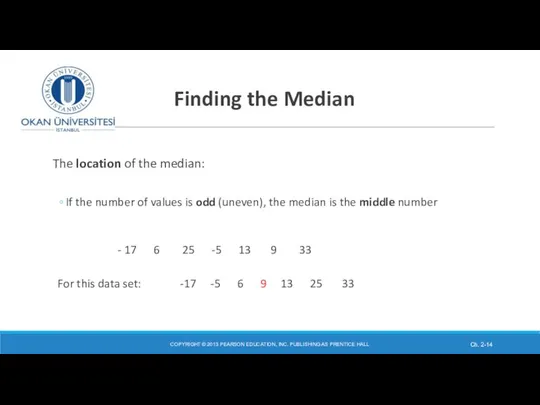
- 14. Finding the Median The location of the median: If the number of values is odd (uneven),
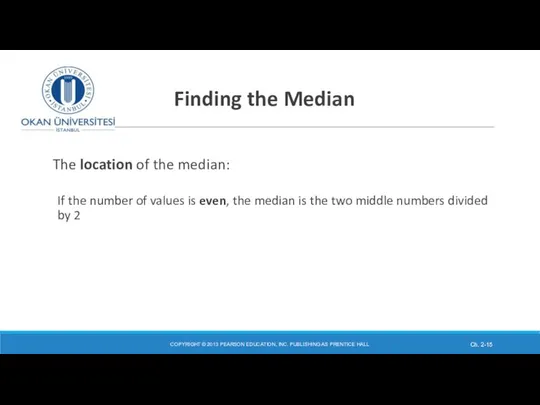
- 15. Finding the Median The location of the median: If the number of values is even, the
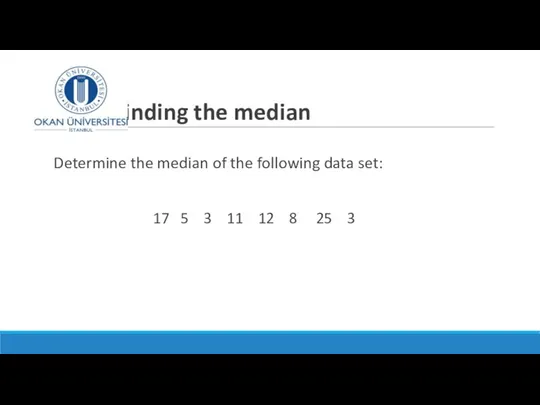
- 16. Finding the median Determine the median of the following data set: 17 5 3 11 12
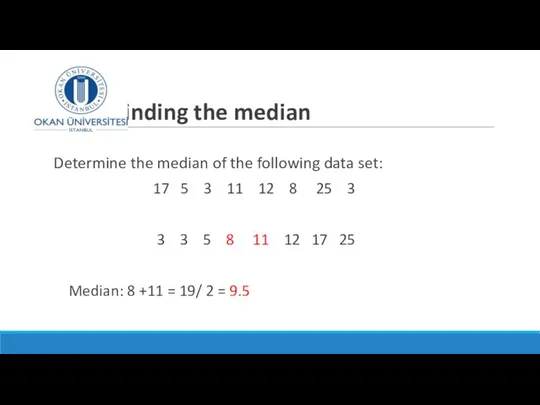
- 17. Finding the median Determine the median of the following data set: 17 5 3 11 12
- 18. Mode Value that occurs most often in the data set Not affected by outliers Used for
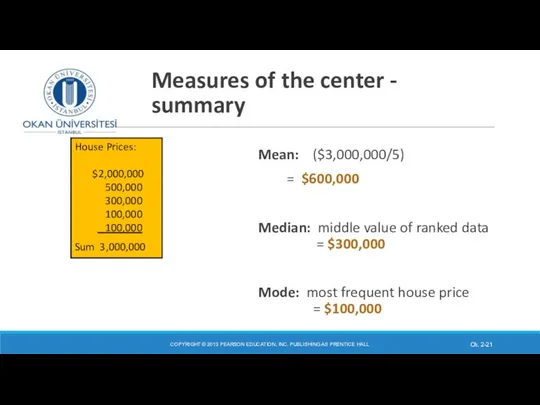
- 19. Measures of the center summary data COPYRIGHT © 2013 PEARSON EDUCATION, INC. PUBLISHING AS PRENTICE HALL
- 20. Measures of the center summary data COPYRIGHT © 2013 PEARSON EDUCATION, INC. PUBLISHING AS PRENTICE HALL
- 21. COPYRIGHT © 2013 PEARSON EDUCATION, INC. PUBLISHING AS PRENTICE HALL Ch. 2- Mean: ($3,000,000/5) = $600,000
- 22. When is which measure of the center the “best”? COPYRIGHT © 2013 PEARSON EDUCATION, INC. PUBLISHING
- 23. Shape of a Distribution Describe the shape of a distribution Describes how data is distributed The
- 24. Histogram of annual salaries (in $) for a sample of U.S. marketing managers: Describe the shape
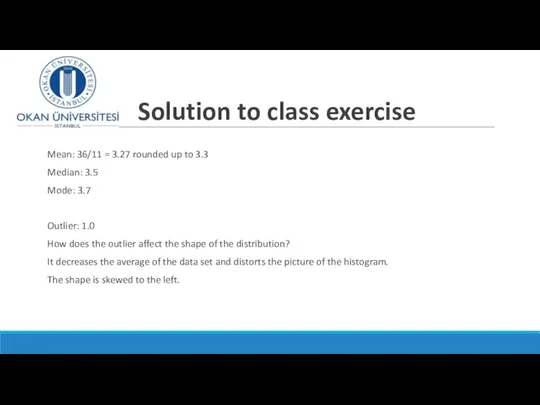
- 25. Class exercise Eleven economists were asked to predict the percentage growth in the Consumer Price Index
- 26. Solution to class exercise Mean: 36/11 = 3.27 rounded up to 3.3 Median: 3.5 Mode: 3.7
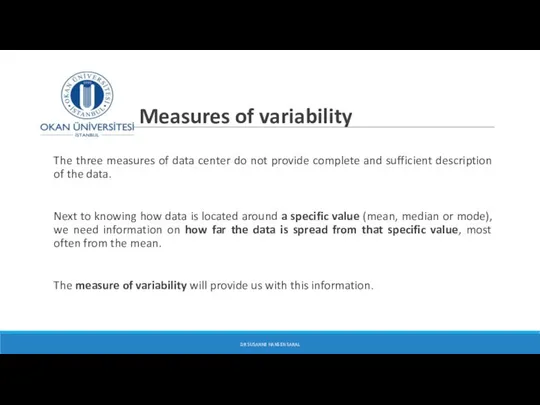
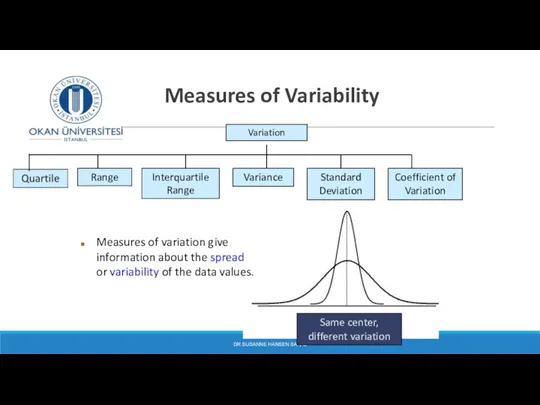
- 27. Measures of variability The three measures of data center do not provide complete and sufficient description
- 28. Measures of Variability DR SUSANNE HANSEN SARAL Same center, different variation Variation Variance Standard Deviation Coefficient
- 29. Quartiles DR SUSANNE HANSEN SARAL
- 30. Quartiles DR SUSANNE HANSEN SARAL 25% 25% 25% 25% Q1 Q2 Q3
- 31. How to calculate quartiles manually DR SUSANNE HANSEN SARAL Find a quartile by determining the value
- 32. Quartiles DR SUSANNE HANSEN SARAL (n = 9 1st Quartile = the value located in the
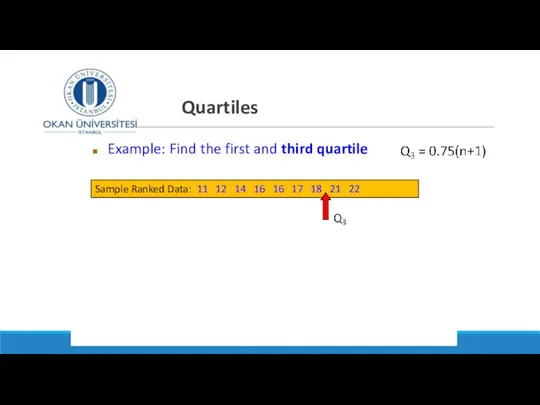
- 33. Quartiles DR SUSANNE HANSEN SARAL Sample Ranked Data: 11 12 14 16 16 17 18 21
- 34. Quartiles and Enron case
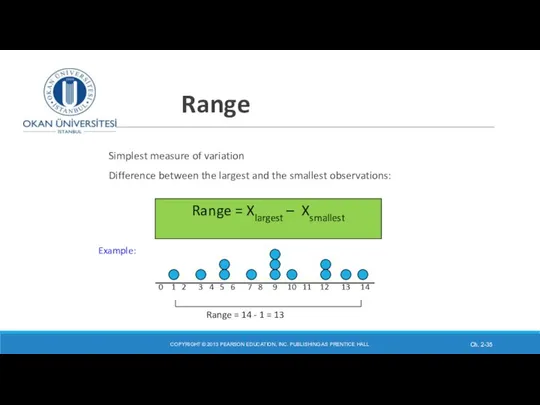
- 35. Range Simplest measure of variation Difference between the largest and the smallest observations: COPYRIGHT © 2013
- 36. Range – Example Enron case Range = Maximum value – minimum value Enron data range =
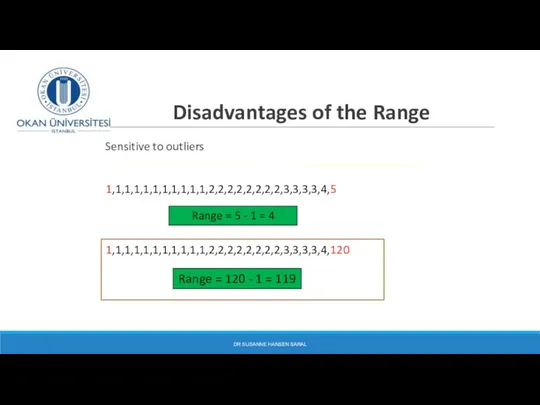
- 37. Disadvantages of the Range Ignores the way in which data is distributed DR SUSANNE HANSEN SARAL
- 38. Disadvantages of the Range Sensitive to outliers DR SUSANNE HANSEN SARAL 1,1,1,1,1,1,1,1,1,1,1,2,2,2,2,2,2,2,2,3,3,3,3,4,5 1,1,1,1,1,1,1,1,1,1,1,2,2,2,2,2,2,2,2,3,3,3,3,4,120 Range = 5
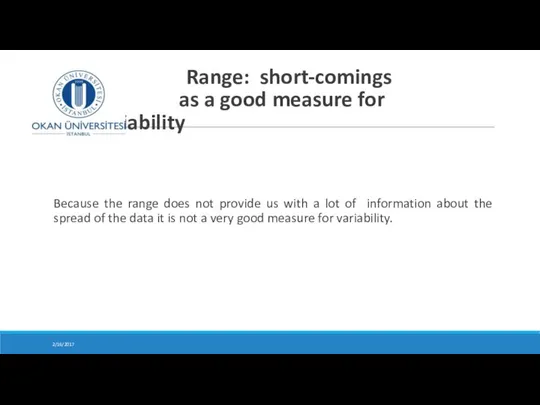
- 39. Range: short-comings as a good measure for variability Because the range does not provide us with
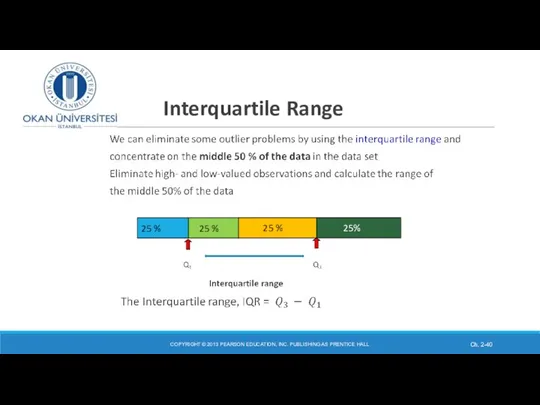
- 40. Interquartile Range COPYRIGHT © 2013 PEARSON EDUCATION, INC. PUBLISHING AS PRENTICE HALL Ch. 2- 25 %
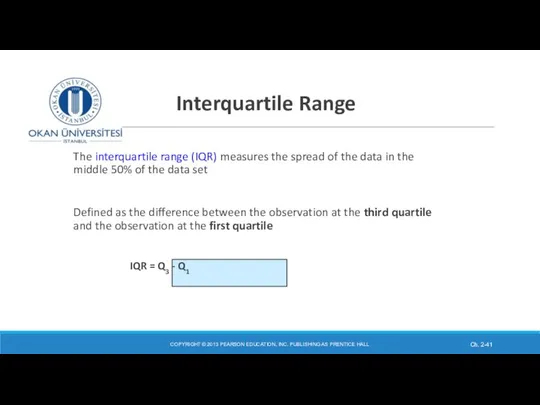
- 41. Interquartile Range The interquartile range (IQR) measures the spread of the data in the middle 50%
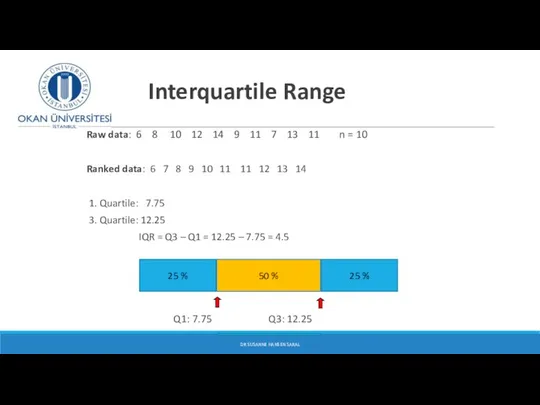
- 42. Interquartile Range Raw data: 6 8 10 12 14 9 11 7 13 11 n =
- 44. Скачать презентацию
Using numerical measures to describe data
«Is the data in the
Using numerical measures to describe data
«Is the data in the
Using numerical measures to describe data
The histogram gives an
Using numerical measures to describe data
The histogram gives an
Is the data centered around a specific value?
Is the data centered around a specific value?
Numerical measures to describe data
COPYRIGHT © 2013 PEARSON EDUCATION,
Numerical measures to describe data
COPYRIGHT © 2013 PEARSON EDUCATION,
Measures of the center of the data set
COPYRIGHT © 2013
Measures of the center of the data set
COPYRIGHT © 2013
The mean is the most common measure of the center of
The mean is the most common measure of the center of
For a sample of n values:
COPYRIGHT © 2013 PEARSON EDUCATION, INC.
For a sample of n values:
COPYRIGHT © 2013 PEARSON EDUCATION, INC.
The Mean symmetry and unimodal distribution
WHEN WE HAVE A SYMMETRIC
The Mean symmetry and unimodal distribution
WHEN WE HAVE A SYMMETRIC
Mean
The most common measure for the center of a data
Mean
The most common measure for the center of a data
Mean
The most common measure for the center of a data
Mean
The most common measure for the center of a data
Skewed distribution
An outlier will distort the picture of the
Skewed distribution
An outlier will distort the picture of the
Median
In an ordered list of data, the median is the
Median
In an ordered list of data, the median is the
Finding the Median
The location of the median:
If the number of
Finding the Median
The location of the median:
If the number of
Finding the Median
The location of the median:
If the number of
Finding the Median
The location of the median:
If the number of
Finding the median
Determine the median of the following data set:
17
Finding the median
Determine the median of the following data set:
17
Finding the median
Determine the median of the following data set:
17
Finding the median
Determine the median of the following data set:
17
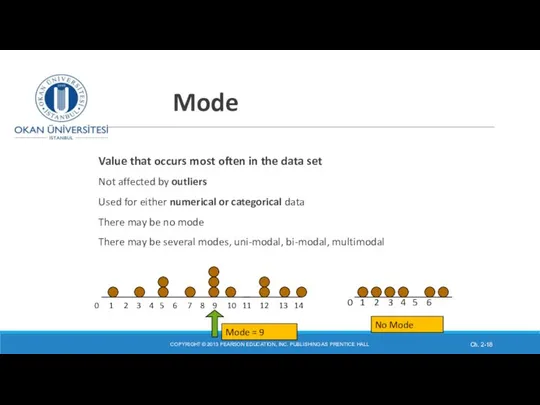
Mode
Value that occurs most often in the data set
Not affected by
Mode
Value that occurs most often in the data set
Not affected by
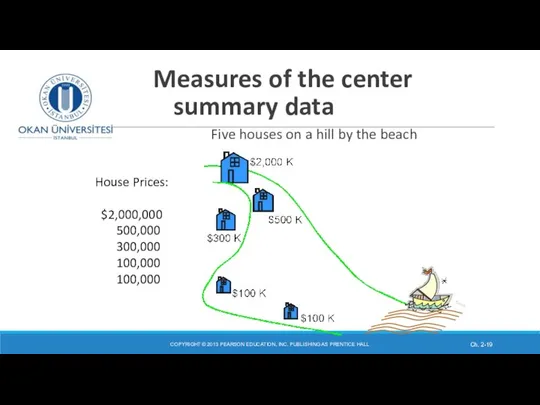
Measures of the center summary data
COPYRIGHT © 2013 PEARSON EDUCATION, INC.
Measures of the center summary data
COPYRIGHT © 2013 PEARSON EDUCATION, INC.
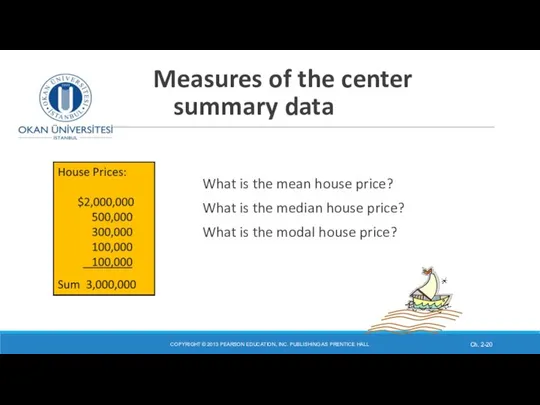
Measures of the center summary data
COPYRIGHT © 2013 PEARSON EDUCATION, INC.
Measures of the center summary data
COPYRIGHT © 2013 PEARSON EDUCATION, INC.
COPYRIGHT © 2013 PEARSON EDUCATION, INC. PUBLISHING AS PRENTICE HALL
Ch.
COPYRIGHT © 2013 PEARSON EDUCATION, INC. PUBLISHING AS PRENTICE HALL
Ch.
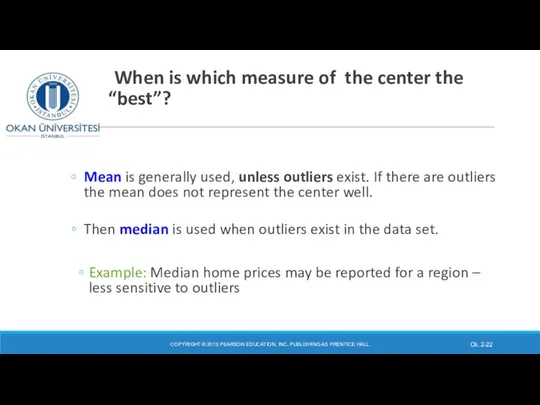
When is which measure of the center the “best”?
COPYRIGHT ©
When is which measure of the center the “best”?
COPYRIGHT ©
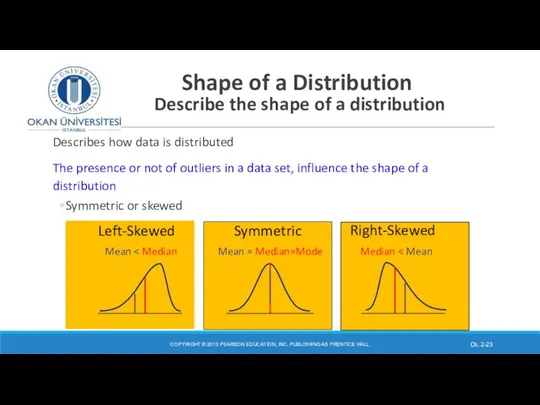
Shape of a Distribution
Describe the shape of a distribution
Describes how
Shape of a Distribution
Describe the shape of a distribution
Describes how
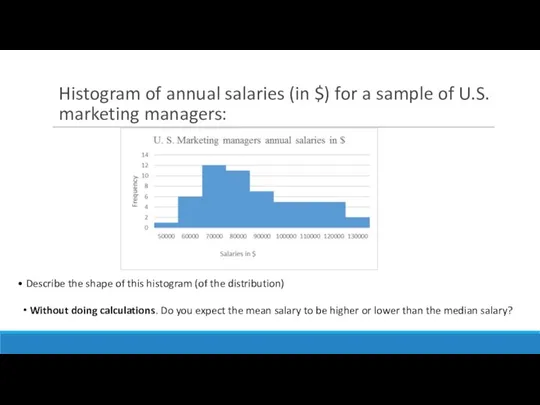
Histogram of annual salaries (in $) for a sample of U.S.
Histogram of annual salaries (in $) for a sample of U.S.
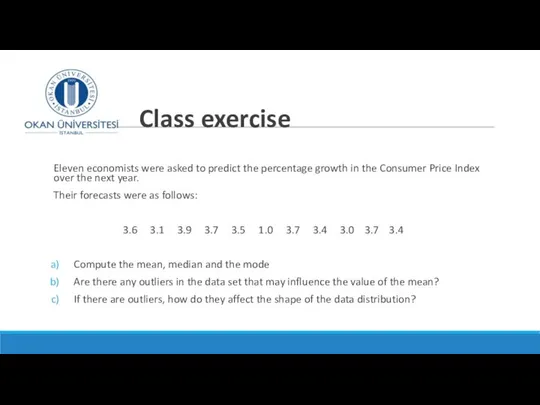
Class exercise
Eleven economists were asked to predict the percentage growth in
Class exercise
Eleven economists were asked to predict the percentage growth in
Solution to class exercise
Mean: 36/11 = 3.27 rounded up to
Solution to class exercise
Mean: 36/11 = 3.27 rounded up to
Measures of variability
The three measures of data center do not provide
Measures of variability
The three measures of data center do not provide
Measures of Variability
DR SUSANNE HANSEN SARAL
Same center,
different variation
Variation
Variance
Standard Deviation
Coefficient of
Measures of Variability
DR SUSANNE HANSEN SARAL
Same center,
different variation
Variation
Variance
Standard Deviation
Coefficient of
Quartiles
DR SUSANNE HANSEN SARAL
Quartiles
DR SUSANNE HANSEN SARAL
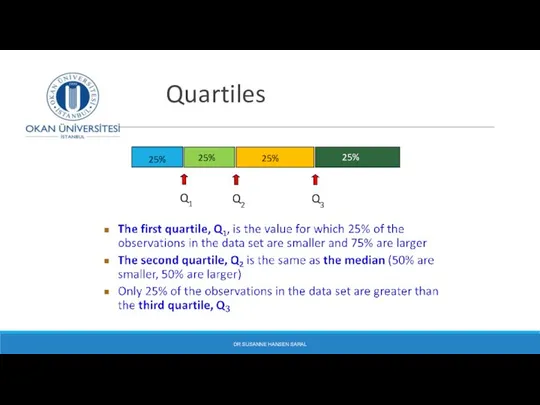
Quartiles
DR SUSANNE HANSEN SARAL
25%
25%
25%
25%
Q1
Q2
Q3
Quartiles
DR SUSANNE HANSEN SARAL
25%
25%
25%
25%
Q1
Q2
Q3
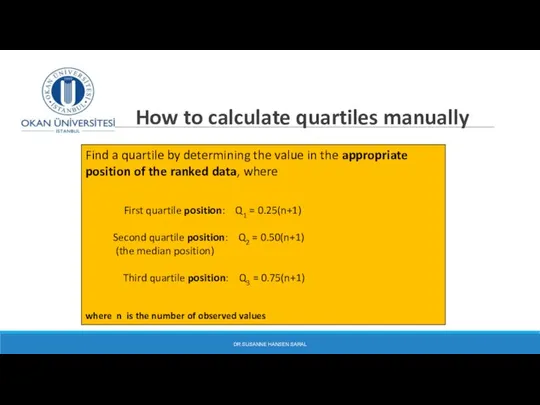
How to calculate quartiles manually
DR SUSANNE HANSEN SARAL
Find a quartile by
How to calculate quartiles manually
DR SUSANNE HANSEN SARAL
Find a quartile by
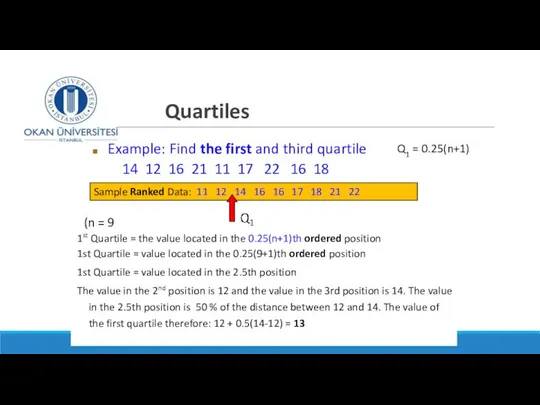
Quartiles
DR SUSANNE HANSEN SARAL
(n = 9
1st Quartile = the
Quartiles
DR SUSANNE HANSEN SARAL
(n = 9
1st Quartile = the
Quartiles
DR SUSANNE HANSEN SARAL
Sample Ranked Data: 11 12 14 16 16
Quartiles
DR SUSANNE HANSEN SARAL
Sample Ranked Data: 11 12 14 16 16
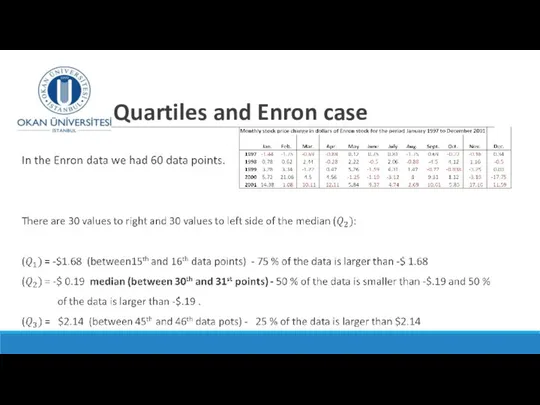
Quartiles and Enron case
Quartiles and Enron case
Range
Simplest measure of variation
Difference between the largest and the smallest observations:
COPYRIGHT
Range
Simplest measure of variation
Difference between the largest and the smallest observations:
COPYRIGHT
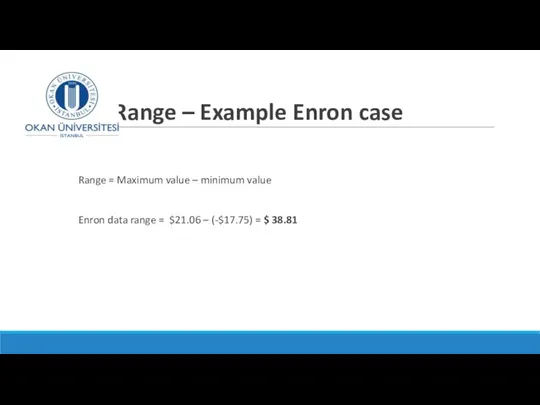
Range – Example Enron case
Range = Maximum value – minimum
Range – Example Enron case
Range = Maximum value – minimum
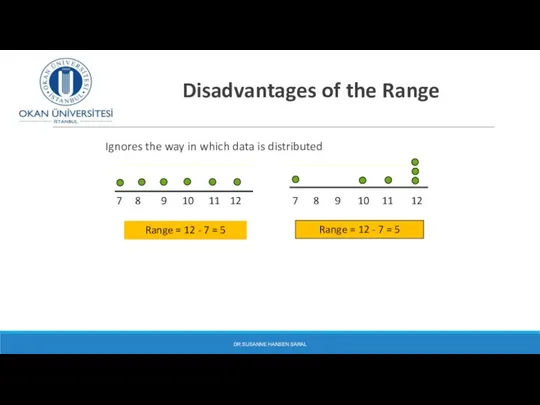
Disadvantages of the Range
Ignores the way in which data is
Disadvantages of the Range
Ignores the way in which data is
Disadvantages of the Range
Sensitive to outliers
DR SUSANNE HANSEN SARAL
1,1,1,1,1,1,1,1,1,1,1,2,2,2,2,2,2,2,2,3,3,3,3,4,5
1,1,1,1,1,1,1,1,1,1,1,2,2,2,2,2,2,2,2,3,3,3,3,4,120
Range =
Disadvantages of the Range
Sensitive to outliers
DR SUSANNE HANSEN SARAL
1,1,1,1,1,1,1,1,1,1,1,2,2,2,2,2,2,2,2,3,3,3,3,4,5
1,1,1,1,1,1,1,1,1,1,1,2,2,2,2,2,2,2,2,3,3,3,3,4,120
Range =
Range: short-comings as a good measure for variability
Because the range
Range: short-comings as a good measure for variability
Because the range
Interquartile Range
COPYRIGHT © 2013 PEARSON EDUCATION, INC. PUBLISHING AS PRENTICE HALL
Ch.
Interquartile Range
COPYRIGHT © 2013 PEARSON EDUCATION, INC. PUBLISHING AS PRENTICE HALL
Ch.
Interquartile Range
The interquartile range (IQR) measures the spread of the data
Interquartile Range
The interquartile range (IQR) measures the spread of the data
Interquartile Range
Raw data: 6 8 10 12 14 9
Interquartile Range
Raw data: 6 8 10 12 14 9
 Извлечение квадратного корня
 Парный регрессионный анализ
 Внешняя оценка качества образования МЦКО в начальной школе (Практикум для родителей)
 Объём шара и площадь сферы
 Четырехзначные числа
 Тригономерия
 Ознакомление с задачей в два действия
 Десятичные дроби. Путешествие по стране
 Классификация математических моделей
 Площадь прямоугольника
 Алгебраическая сумма и её свойства
 Арифметическая прогрессия. Всё в твоих руках
 Объём. Цилиндр, призма
 Показательные неравенства
 Сложение обыкновенных дробей 5 класс Учитель: Григоренко Ольга Геннадьевна МОУ СОШ №8 Г. Куса Челябинская область
 Параллельность прямой и плоскости
 Презентация по математике "Язык уравнений" - скачать бесплатно
 Презентация по математике "Мера длины" - скачать
  Проценты (3-4)
 Общая постановка задачи оптимизации
 Натуральные числа. Правило округления натуральных чисел
 Решение задач на одновременное движение всех видов
 Многогранники
 Тренажёр «Единицы измерения длины и массы» 3 класс
  Доминино
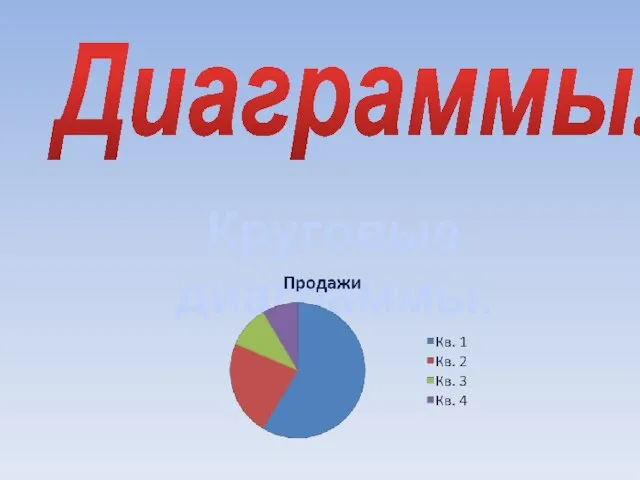 Диаграммы. Круговые диаграммы
 Совместные действия с рациональными числами
 Післяоптимізаційний аналіз задачі лінійного програмування