- Measures of dispersion (lecture 3)

Содержание
- 2. LECTURE 3 MEASURES OF DISPERSION Temur Makhkamov Indira Khadjieva QM Module Leaders tmakhkamov@wiut.uz i.khadjieva@wiut.uz Room: IB
- 3. Lecture outline: compute and interpret the (interquartile) range compute and interpret the variance Compute and interpret
- 4. Untabulated data. According to Transfermarkt.ru transfer price of some Uzbek National football team players, are as
- 5. Range Range = Max value – Min value Range = € 7,000,000 - € 500,000 =
- 6. Interquartile range
- 7. Interquartile range IQR = Q3 – Q1 = €2.8mln– €0.6mln= €2.2mln Visually: €0.5mln €0.55 €0.6mln €0.7
- 8. Untabulated data The weekly salaries for the sample of six players of Tampa Bay Buccaneers, are
- 9. Standard deviation – Untabulated (1) Compute the mean Calculate the difference from the mean Square these
- 10. Standard deviation – Untabulated (2)
- 11. Standard deviation – Untabulated (3) Empirical rule: For a normal distribution: Within one standard deviation =
- 12. Tabulated - ungrouped data The number of Rolton (noodle) sold per day by cashier John in
- 13. Range Range = Max value – Min value Range = 16 - 10 = 6 Questions:
- 14. Standard deviation formulae Scary formula? It is hard to solve? Let’s solve it together …
- 15. Standard deviation – 1st method (1)
- 16. Standard deviation – 1st method (2)
- 17. Standard deviation – 2nd method Homework: Try to solve it at home for untabulated data
- 18. Tabulated – grouped data The amount spent on food by 50 people in a particular shop
- 19. Range Range = Max value – Min value Range = £50 - £0 = £50 Questions:
- 20. Standard deviation – 2nd method (1)
- 21. Standard deviation – 2nd method (2)
- 22. Standard deviation – 1st method Homework: Try to solve it at home for untabulated data
- 23. Confidence interval The 95% confidence interval is a range of values that you can be 95%
- 24. Concluding remarks: Today, you learnt: Use the quantitative methods to find the spread of data Calculate
- 26. Скачать презентацию
LECTURE 3
MEASURES OF DISPERSION
Temur Makhkamov
Indira Khadjieva
QM Module Leaders
tmakhkamov@wiut.uz
i.khadjieva@wiut.uz
Room: IB
LECTURE 3
MEASURES OF DISPERSION
Temur Makhkamov
Indira Khadjieva
QM Module Leaders
tmakhkamov@wiut.uz
i.khadjieva@wiut.uz
Room: IB
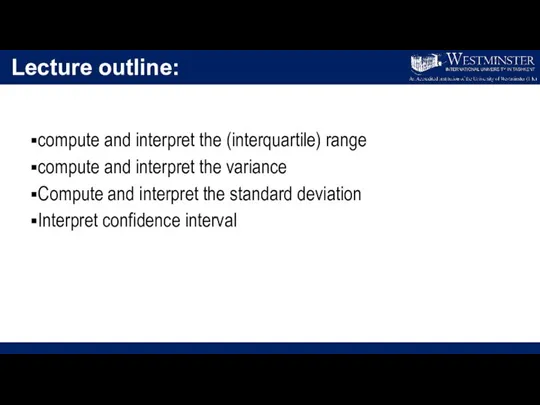
Lecture outline:
compute and interpret the (interquartile) range
compute and interpret the variance
Lecture outline:
compute and interpret the (interquartile) range
compute and interpret the variance
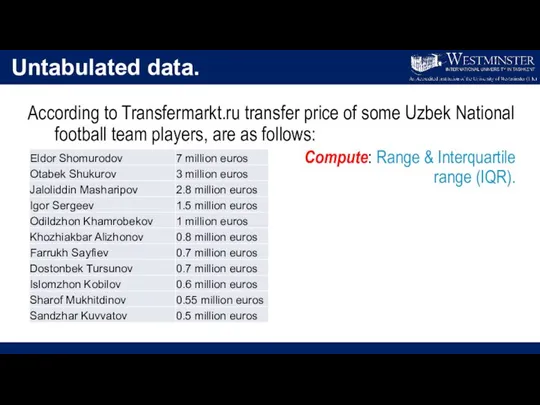
Untabulated data.
According to Transfermarkt.ru transfer price of some Uzbek National
Untabulated data.
According to Transfermarkt.ru transfer price of some Uzbek National
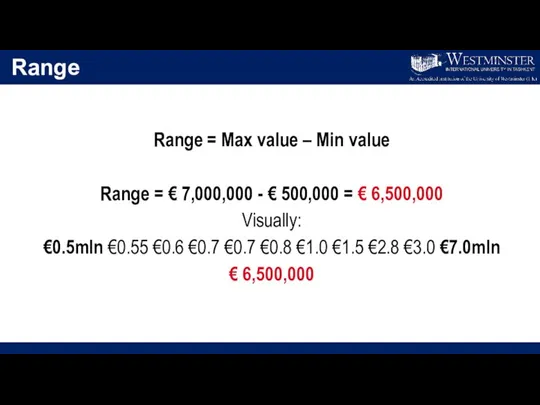
Range
Range = Max value – Min value
Range = € 7,000,000 -
Range
Range = Max value – Min value
Range = € 7,000,000 -
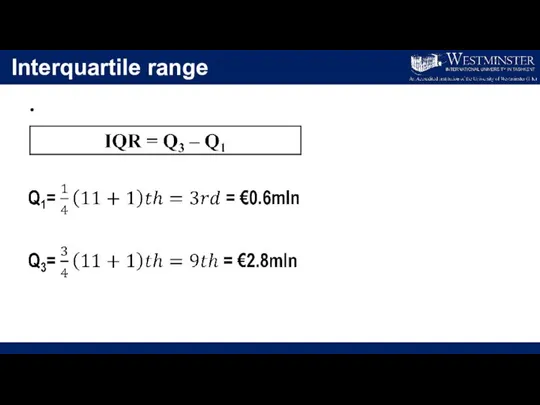
Interquartile range
Interquartile range
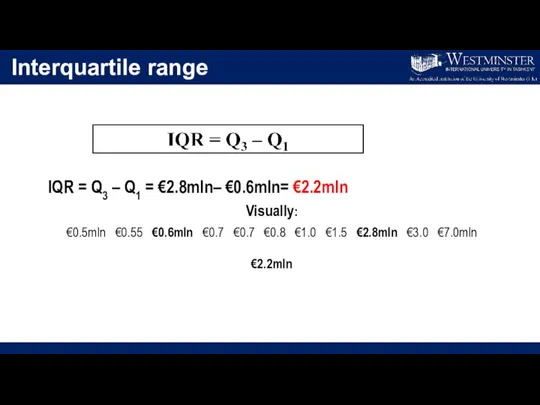
Interquartile range
IQR = Q3 – Q1 = €2.8mln– €0.6mln= €2.2mln
Visually:
€0.5mln €0.55
Interquartile range
IQR = Q3 – Q1 = €2.8mln– €0.6mln= €2.2mln
Visually:
€0.5mln €0.55
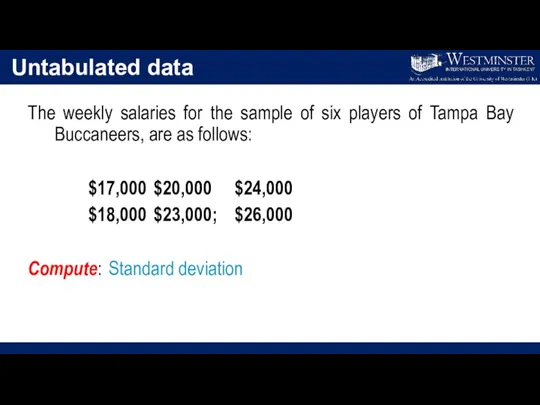
Untabulated data
The weekly salaries for the sample of six players of
Untabulated data
The weekly salaries for the sample of six players of
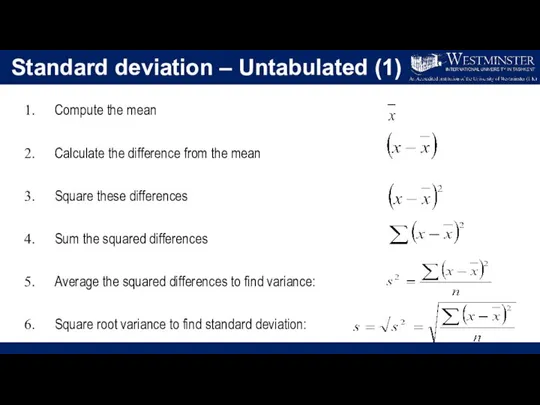
Standard deviation – Untabulated (1)
Compute the mean
Calculate the difference from
Standard deviation – Untabulated (1)
Compute the mean
Calculate the difference from
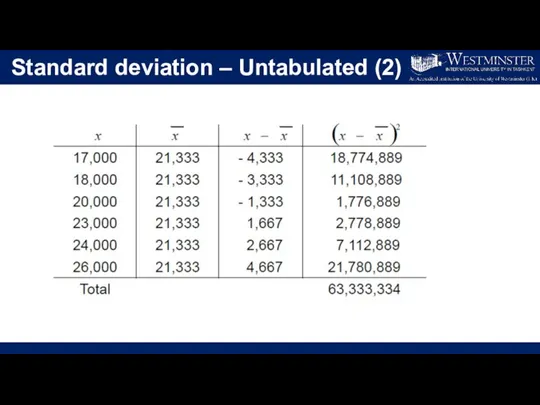
Standard deviation – Untabulated (2)
Standard deviation – Untabulated (2)
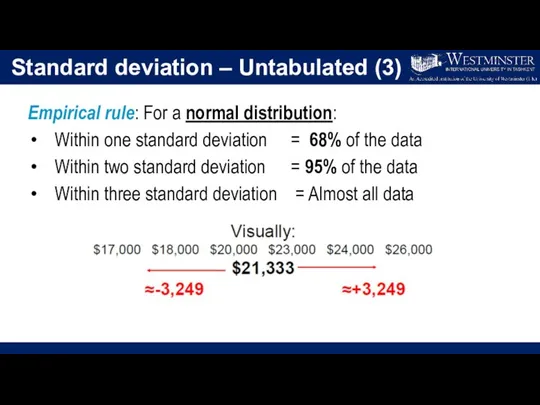
Standard deviation – Untabulated (3)
Empirical rule: For a normal distribution:
Within one
Standard deviation – Untabulated (3)
Empirical rule: For a normal distribution:
Within one
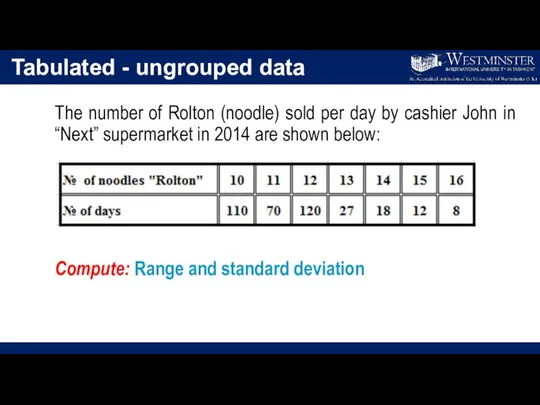
Tabulated - ungrouped data
The number of Rolton (noodle) sold per day
Tabulated - ungrouped data
The number of Rolton (noodle) sold per day
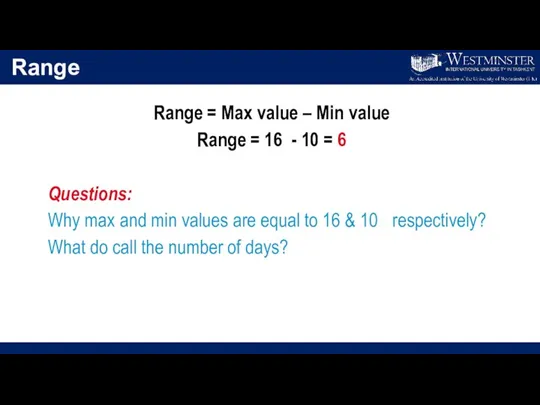
Range
Range = Max value – Min value
Range = 16 - 10
Range
Range = Max value – Min value
Range = 16 - 10
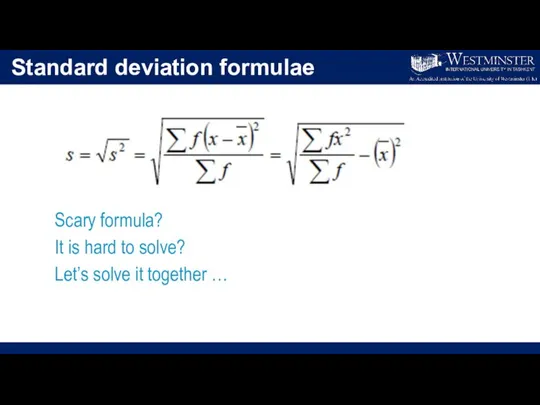
Standard deviation formulae
Scary formula?
It is hard to solve?
Let’s solve it
Standard deviation formulae
Scary formula?
It is hard to solve?
Let’s solve it
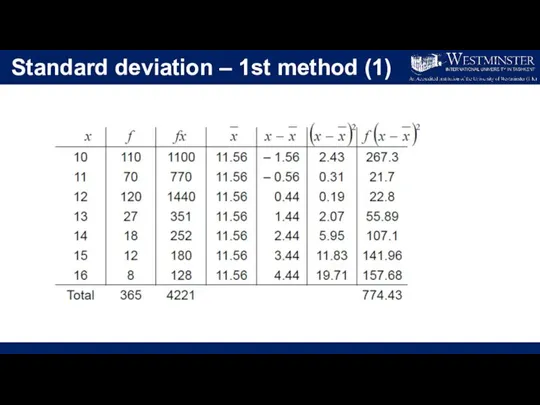
Standard deviation – 1st method (1)
Standard deviation – 1st method (1)
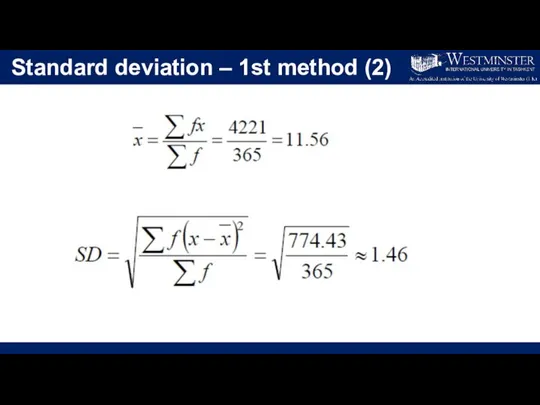
Standard deviation – 1st method (2)
Standard deviation – 1st method (2)
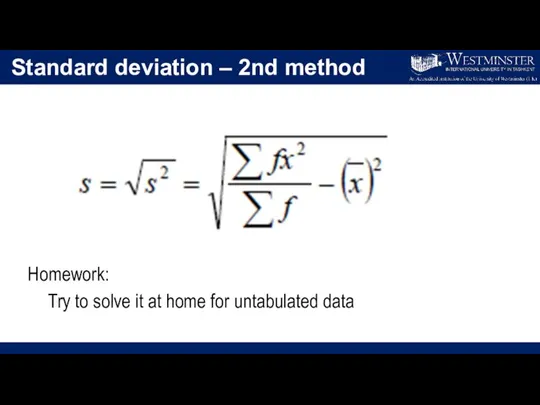
Standard deviation – 2nd method
Homework:
Try to solve it at home
Standard deviation – 2nd method
Homework:
Try to solve it at home
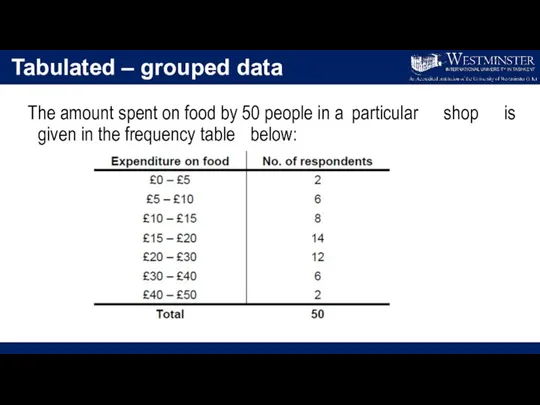
Tabulated – grouped data
The amount spent on food by 50 people
Tabulated – grouped data
The amount spent on food by 50 people
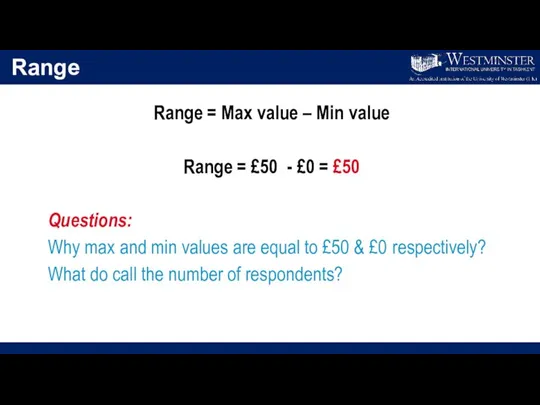
Range
Range = Max value – Min value
Range = £50 - £0
Range
Range = Max value – Min value
Range = £50 - £0
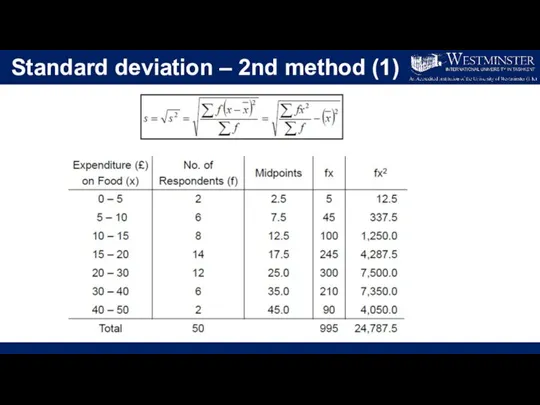
Standard deviation – 2nd method (1)
Standard deviation – 2nd method (1)
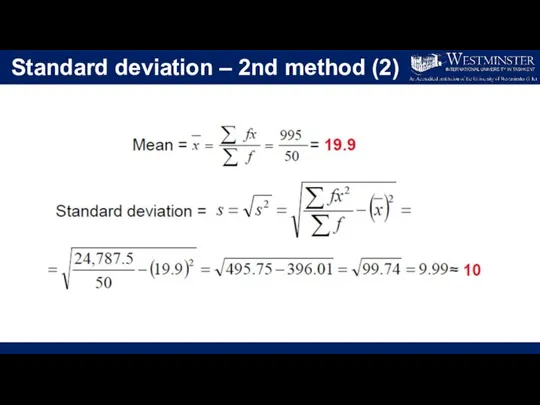
Standard deviation – 2nd method (2)
Standard deviation – 2nd method (2)
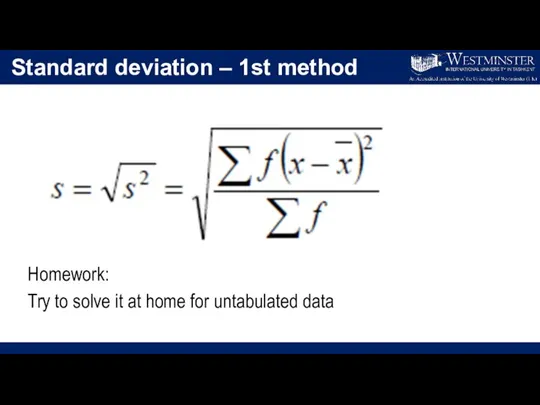
Standard deviation – 1st method
Homework:
Try to solve it at home
Standard deviation – 1st method
Homework:
Try to solve it at home
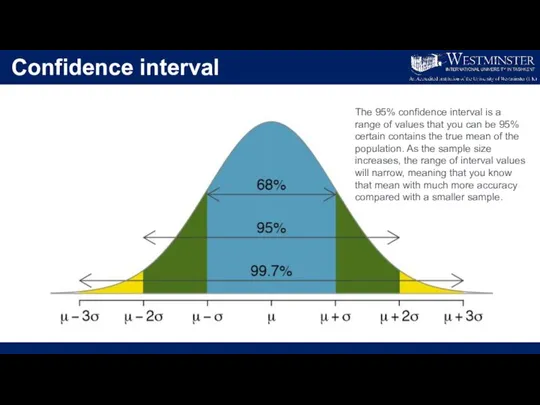
Confidence interval
The 95% confidence interval is a range of values that
Confidence interval
The 95% confidence interval is a range of values that
Concluding remarks:
Today, you learnt:
Use the quantitative methods to find the spread
Concluding remarks:
Today, you learnt:
Use the quantitative methods to find the spread
 Презентация на тему "Самые большие самолеты" скачать
  «Храмы россии»
 Конкурс лучших учителей на денежное поощрение 2007 год МОУ «Рассветская средняя общеобразовательная школа» Учитель истории Анкуд
 Классный час Классный час
 Формирование у обучающихся коммуникативных компетенций на занятиях по ДООП
 Предметная область, структура и функции социологии
 Классические социологические теории
 Презентация на тему "Тест Словарные слова «Овощи и фрукты»" скачать
  Муниципальное общеобразовательное учреждение – средняя общеобразовательная школа № 60 г. Тулы
 Презентация "Техногенные ЧС, возможные на территории Санкт – Петербурга. Потенциально опасные объекты, расположенные на террит
 Презентация "Фабрика жидкого золота" - скачать презентации по Экологии
 Подготовила учитель начальных классов Подготовила учитель начальных классов Захарова Елена Владиславовна ГБОУ СОШ № 623 г. Моск
 Презентация "Биотические факторы" - скачать презентации по Экологии
 Презентация на тему "Я - Земля" скачать
  Факторы выбора профессии
  Тема исследовательской работы: «Шопинг как стиль жизни…»
 Професія товарознавець
 Конвенция ООН о правах ребенка в стихах и картинках
 Комплексная гигиеническая оценка колодезной воды из различных источников (ученическое экологическое исследование на терр
 Участие учащихся 2 ступени в 1 региональном фестивале «Планета Интеллект»
 Социология народников П. Лавров, Н. Михайловский
 Социальная структура общества, 8 класс
 Виды толерантности.
 Презентация на тему С чего начинается родина
 ПРАВИЛЬНОЕ ПИТАНИЕ – ЗАЛОГ ЗДОРОВЬЯ
 Эмоциональные чувства человека и животных - презентация к уроку Окружающий мир_
 Урок окружающего мира. 4 класс, часть 2.
  Защита информационных ресурсов государственного управления