- Бетаин (триметилглицин)

Содержание
- 3. Бетаин (триметилглицин)
- 4. Conversion of solar energy into carbohydrates by a leaf.
- 5. Shown here are the percentages of light absorbed, reflected, and transmitted, as a function of wavelength.
- 6. Photoprotection by dissipation of excess light energy aided by xanthophyll cycle carotenoids
- 7. Xanthophyll cycle
- 9. Response of frosted orache (Atriplex sabulosa) and Arizona honeysweet (Tidestromia oblongifolia) to heat stress. Photosynthesis (A)
- 10. Организация мембранных микродоменов (рафтов)
- 13. Heat shock factor (HSF) cycle
- 14. Heat stress Ca-mediated response
- 15. Low temperature scanning electron microscopy of contro (A) and freezing – stressed tobacco leaves (B-D) (Ashworth
- 16. Low temperature scanning electron microscopy of control (A) and freezing – stressed tobacco leaves (B-D) (Ashworth
- 19. Membrane transport proteins mediating sodium, potassium, and calcium transport during salinity stress
- 20. Roots of maize. Scanning electron micrographs (150×). (A) Control root, supplied with air, with intact cortical
- 22. Metabolic pathways that are active during hypoxia in plants Narsai et al. 2011
- 23. The transcription factors HRE1 and HRE2 were shown to play a crucial role in inducing adaptive
- 24. Oxygen sensing in plants is mediated by an N-end rule pathway for protein destabilization The transcription
- 25. Oxygen as an alternative electron acceptor in chloroplasts.
- 28. Скачать презентацию
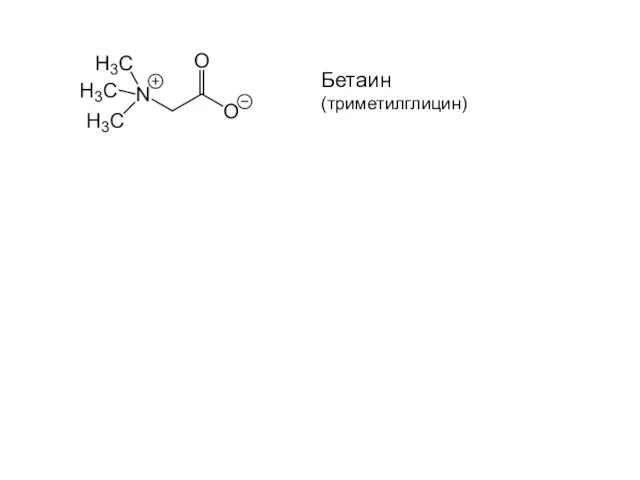
Бетаин (триметилглицин)
Бетаин (триметилглицин)
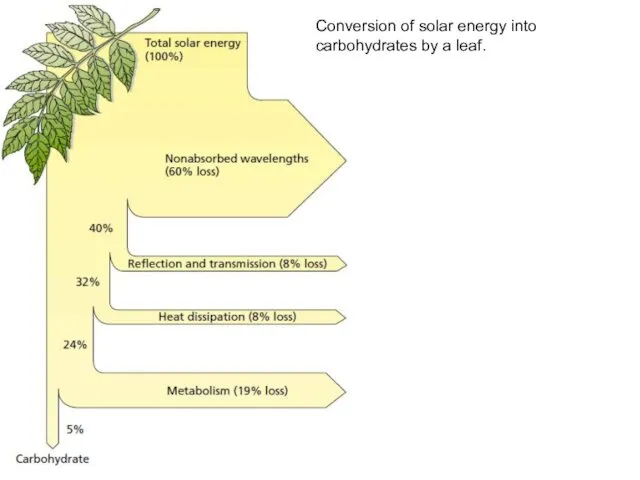
Conversion of solar energy into carbohydrates by a leaf.
Conversion of solar energy into carbohydrates by a leaf.
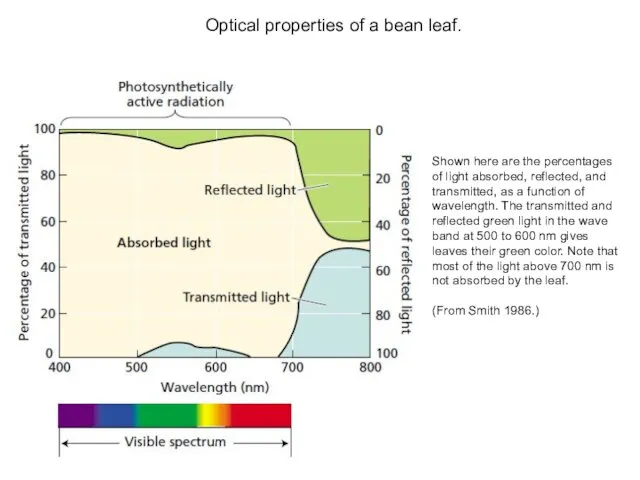
Shown here are the percentages of light absorbed, reflected, and transmitted,
Shown here are the percentages of light absorbed, reflected, and transmitted,
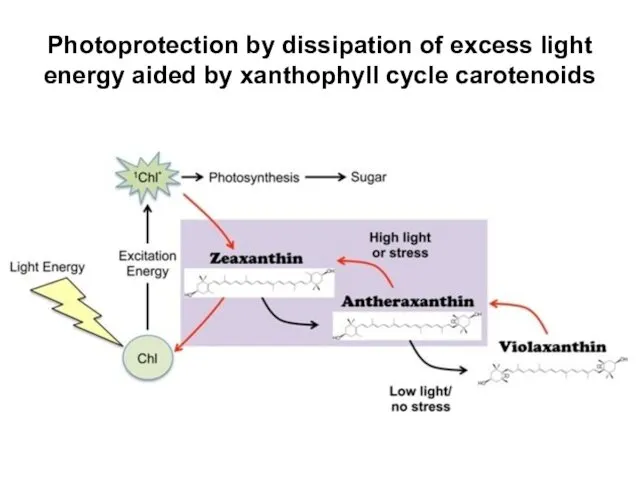
Photoprotection by dissipation of excess light energy aided by xanthophyll cycle
Photoprotection by dissipation of excess light energy aided by xanthophyll cycle
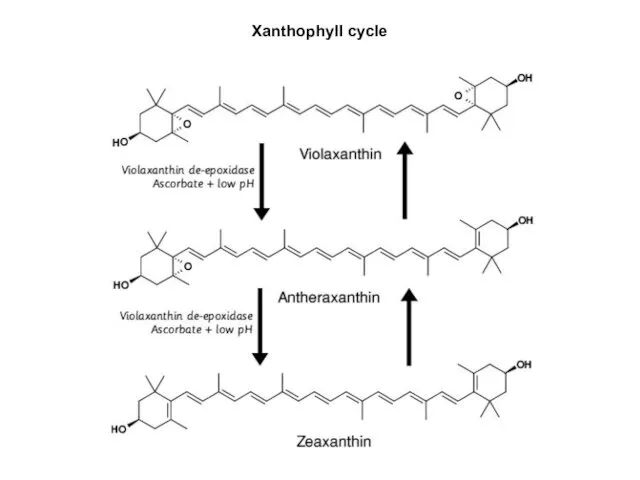
Xanthophyll cycle
Xanthophyll cycle
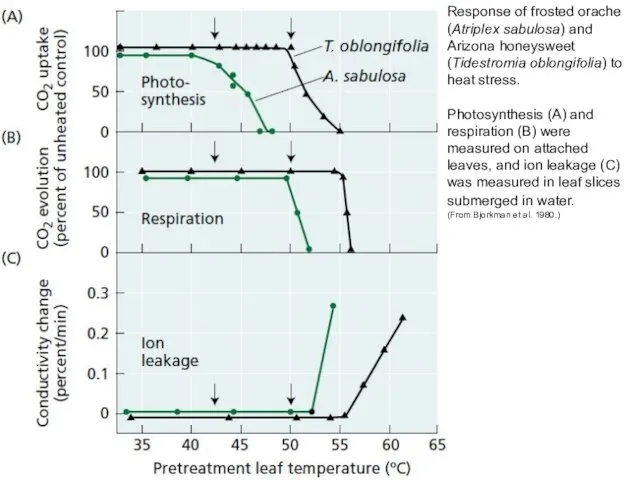
Response of frosted orache (Atriplex sabulosa) and
Arizona honeysweet (Tidestromia oblongifolia) to
Response of frosted orache (Atriplex sabulosa) and
Arizona honeysweet (Tidestromia oblongifolia) to
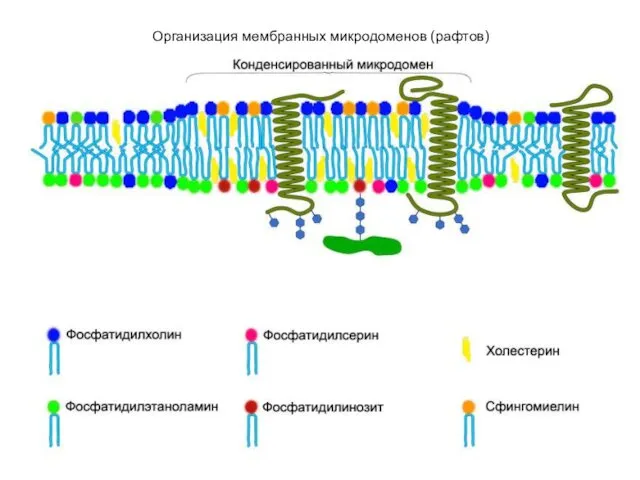
Организация мембранных микродоменов (рафтов)
Организация мембранных микродоменов (рафтов)
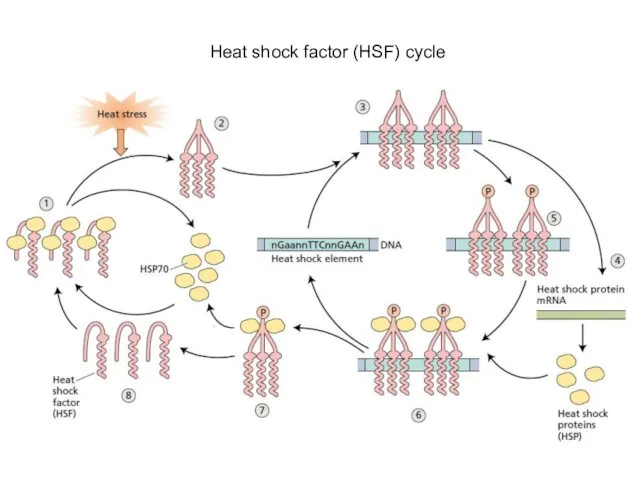
Heat shock factor (HSF) cycle
Heat shock factor (HSF) cycle
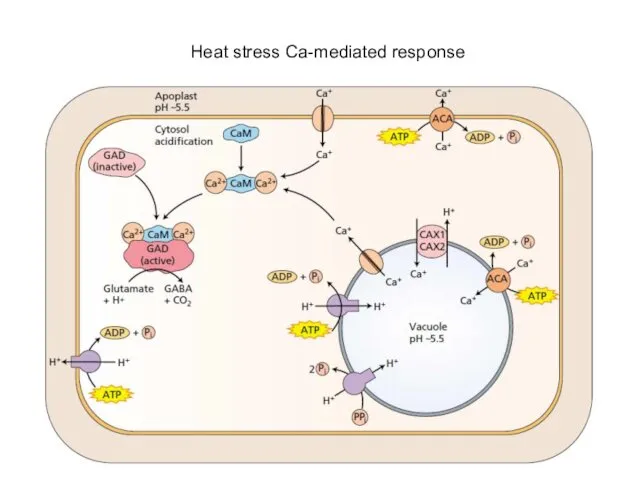
Heat stress Ca-mediated response
Heat stress Ca-mediated response
Low temperature scanning electron microscopy of contro (A) and freezing –
Low temperature scanning electron microscopy of contro (A) and freezing –
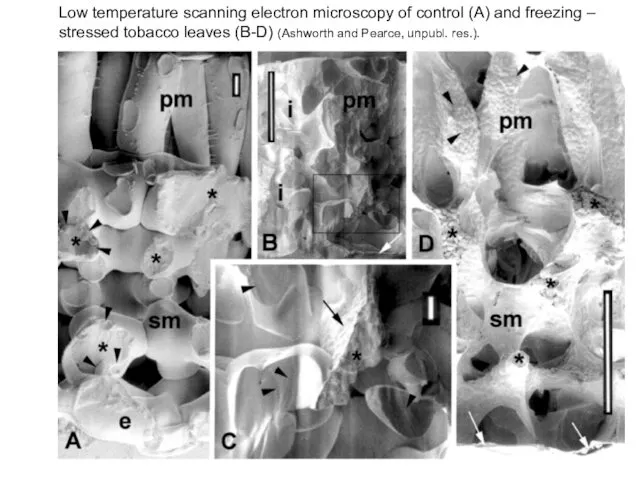
Low temperature scanning electron microscopy of control (A) and freezing –
Low temperature scanning electron microscopy of control (A) and freezing –
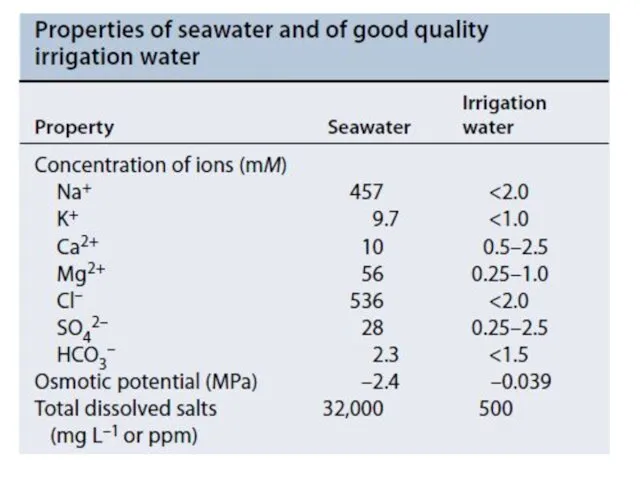
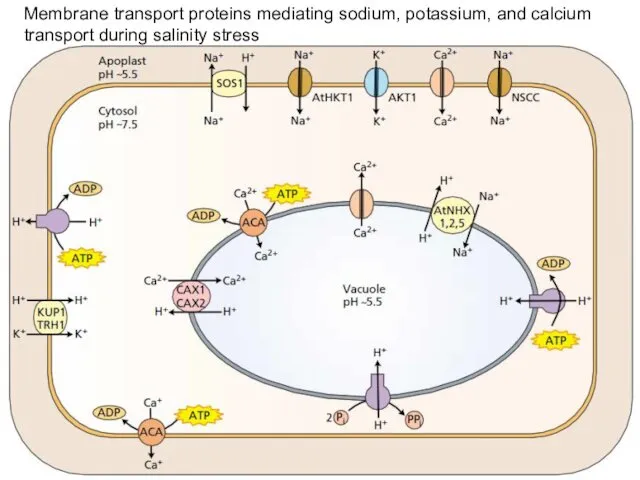
Membrane transport proteins mediating sodium, potassium, and calcium transport during salinity
Membrane transport proteins mediating sodium, potassium, and calcium transport during salinity
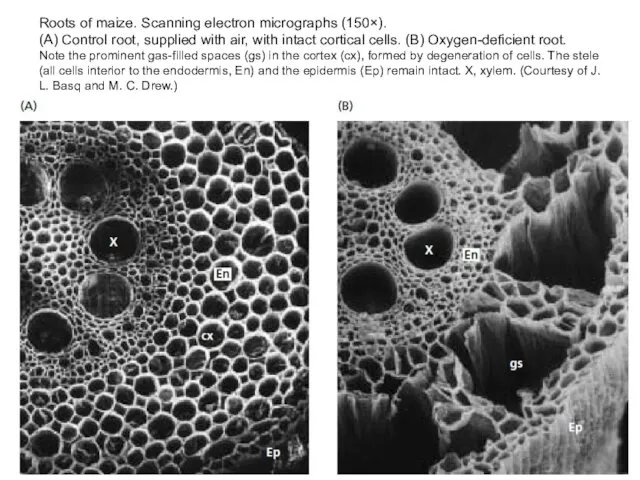
Roots of maize. Scanning electron micrographs (150×).
(A) Control root, supplied
Roots of maize. Scanning electron micrographs (150×). (A) Control root, supplied
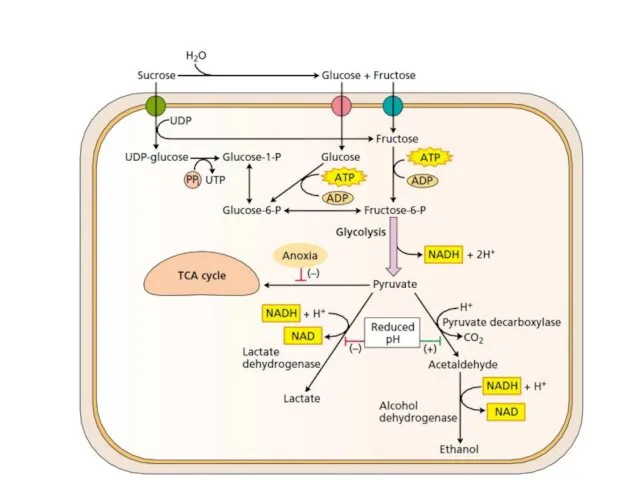
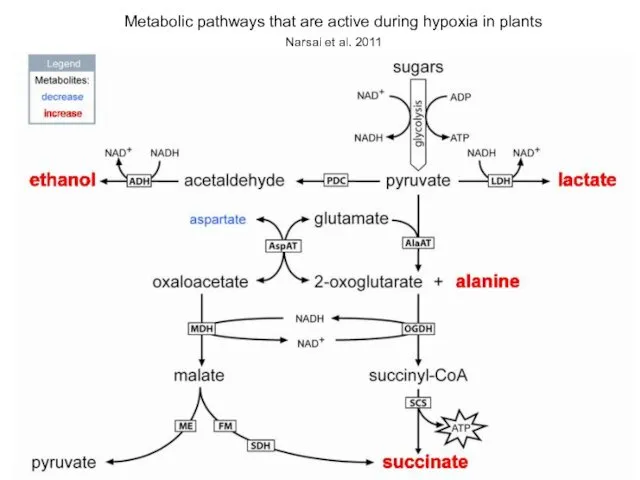
Metabolic pathways that are active during hypoxia in plants
Narsai et al.
Metabolic pathways that are active during hypoxia in plants
Narsai et al.
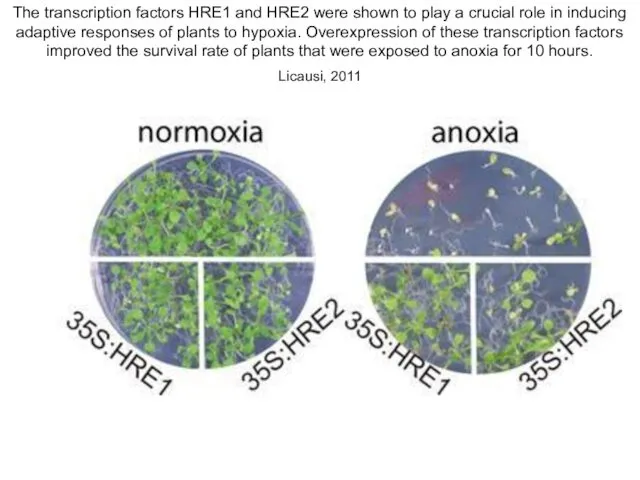
The transcription factors HRE1 and HRE2 were shown to play a
The transcription factors HRE1 and HRE2 were shown to play a
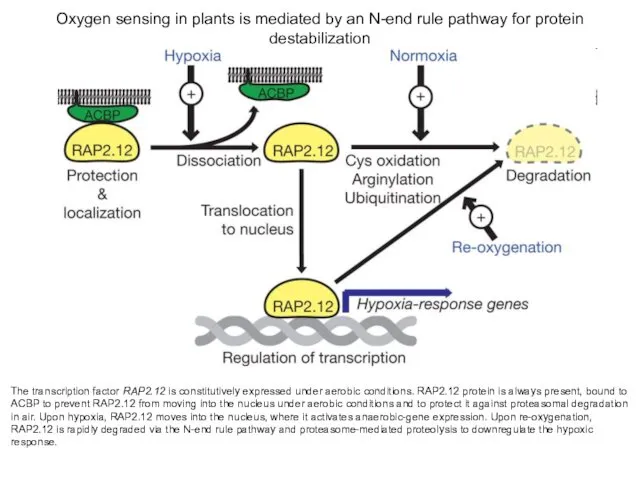
Oxygen sensing in plants is mediated by an N-end rule pathway
Oxygen sensing in plants is mediated by an N-end rule pathway
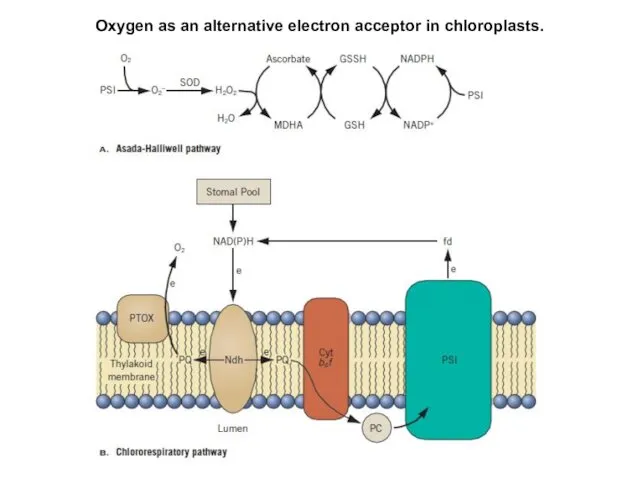
Oxygen as an alternative electron acceptor in chloroplasts.
Oxygen as an alternative electron acceptor in chloroplasts.
 Курсовая работа. Влияние микроэлементов на физиологические процессы
 Аскорбиновая кислота. Глютаминовая кислота. Кислота аминокапроновая
 История открытия стекла
 Углерод. Оксиды углерода. Угольная кислота. Карбонаты. Жёсткость воды
 Изомерия алкенов
 Модель Андерсона
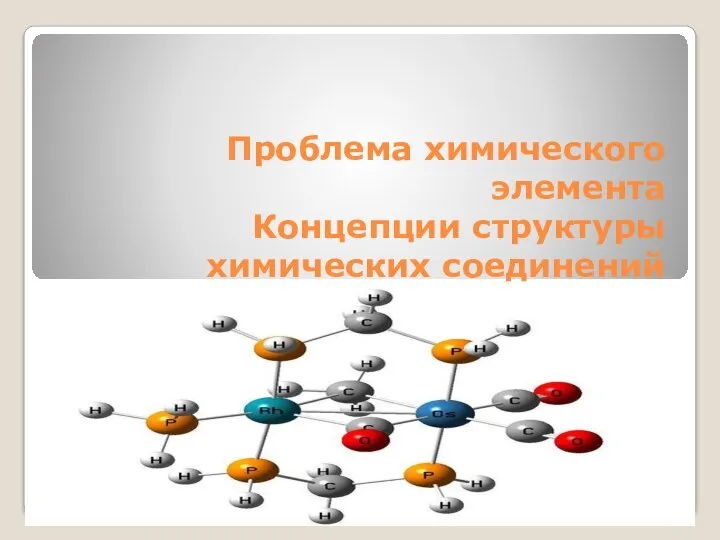 Проблема химического элемента. Концепции структуры химических соединений
 Алюминий (лат. Aluminium)
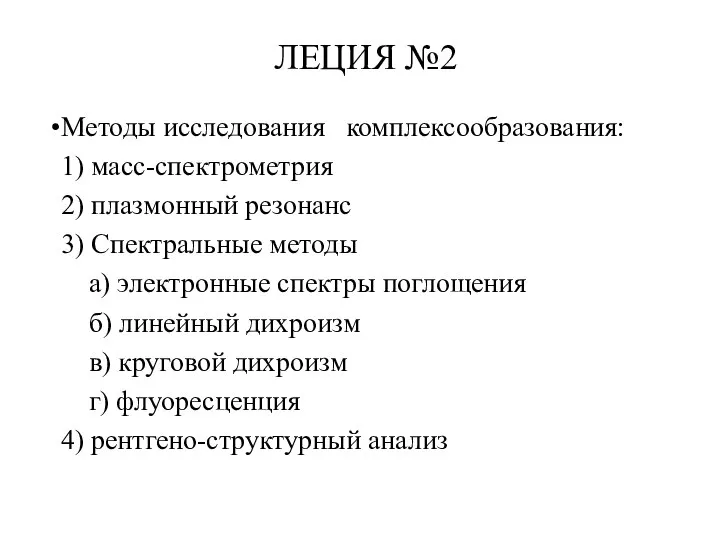 Методы исследования комплексообразования. Леция 2
 Высокомолекулярные соединения и супрамолекулярные структуры. (Лекция 3)
 Александрит
 Изомеризация легких парафиновых углеводородов
 Гетероциклические соединения. Синтетические пиретроиды
 Теоретические основы химической технологии
 Химия воды
 Презентация по Химии "Прославившиеся ученые Саратовской области" - скачать смотреть
  Презентация по Химии "Эффективность снижения общей жесткости воды различными умягчителями, поступающими в продажу" - скачать
 Содержание ртути и её соединений в воздухе при использовании осветительных ламп
 Аттестационная работа. Образовательная программа, элективный курс «Химия в задачах и упражнениях»
 Химиялық рекативтер.стандартты және нормальдық ертінділер дайындау тәртібі мен технологиясы
 Миметик глицина на основе производного Гераниола
 Презентация по Химии "Роль металлов в искусстве" - скачать смотреть
  Алюминий в природе
 Общая характеристика металлов
 Биохимия. Лекция 7. Углеводы
 Тағам қоспалары
 Биологически важные поли- и гетерофункциональные соединения
 Решение 33 задания