- Linear Regression. Regression model evaluation metrics. Lecture 5

Содержание
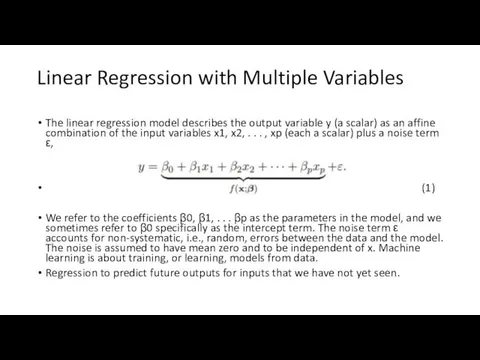
- 3. Linear Regression with Multiple Variables The linear regression model describes the output variable y (a scalar)
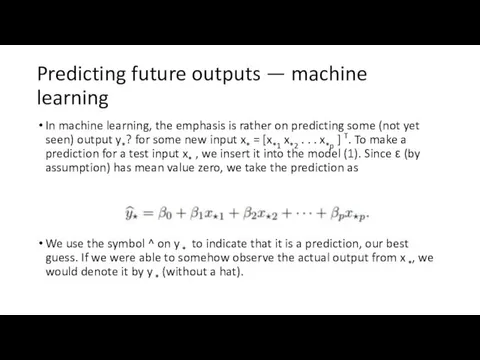
- 4. Predicting future outputs — machine learning In machine learning, the emphasis is rather on predicting some
- 6. https://www.coursera.org/lecture/machine-learning/multiple-features-6Nj1q https://www.youtube.com/watch?v=zITIFTsivN8
- 7. Deciding an Evaluation Metric for a Regression Model Evaluating the model accuracy is an essential part
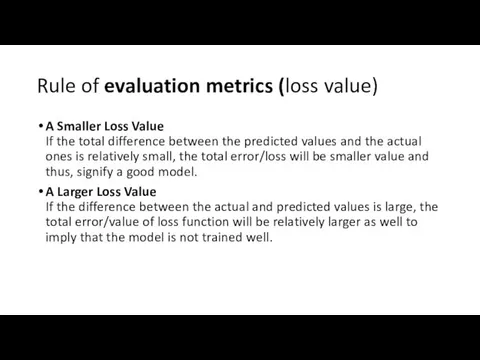
- 8. Rule of evaluation metrics (loss value) A Smaller Loss Value If the total difference between the
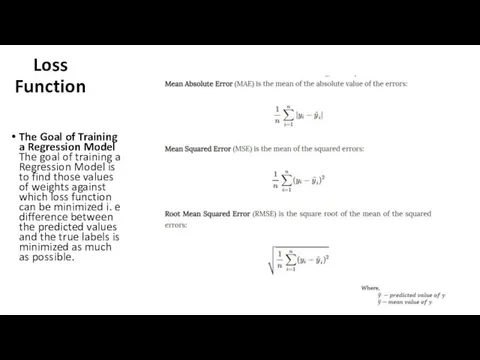
- 9. Loss Function The Goal of Training a Regression Model The goal of training a Regression Model
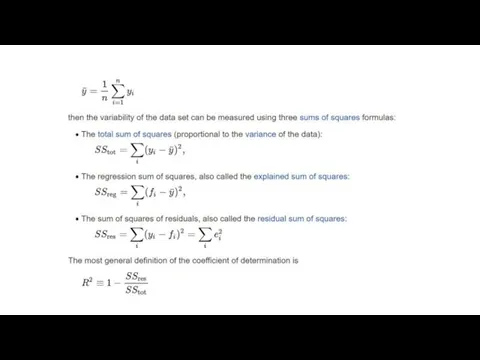
- 10. R-squared R-squared is a statistical measure of how close the data are to the fitted regression
- 12. The regression model on the left accounts for 38.0% of the variance while the one on
- 13. Linear Regression with Python
- 14. Lab 5 Explore new data, create regression model
- 16. Скачать презентацию

Linear Regression with Multiple Variables
The linear regression model describes the output
Linear Regression with Multiple Variables
The linear regression model describes the output
Predicting future outputs — machine learning
In machine learning, the emphasis
Predicting future outputs — machine learning
In machine learning, the emphasis


https://www.coursera.org/lecture/machine-learning/multiple-features-6Nj1q
https://www.youtube.com/watch?v=zITIFTsivN8
https://www.coursera.org/lecture/machine-learning/multiple-features-6Nj1q
https://www.youtube.com/watch?v=zITIFTsivN8

Deciding an Evaluation Metric for a Regression Model
Evaluating the model accuracy
Deciding an Evaluation Metric for a Regression Model
Evaluating the model accuracy
Rule of evaluation metrics (loss value)
A Smaller Loss Value
If the
Rule of evaluation metrics (loss value)
A Smaller Loss Value If the
Loss Function
The Goal of Training a Regression Model
The goal of training
Loss Function
The Goal of Training a Regression Model The goal of training

R-squared
R-squared is a statistical measure of how close the data are
R-squared
R-squared is a statistical measure of how close the data are
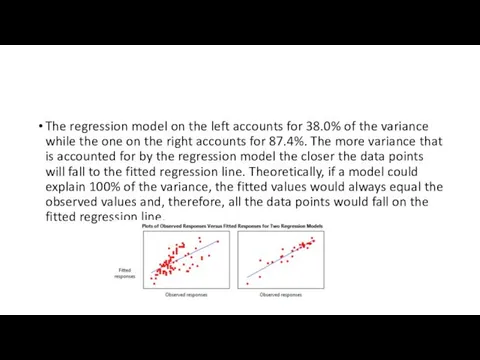
The regression model on the left accounts for 38.0% of the
The regression model on the left accounts for 38.0% of the
Linear Regression with Python
Linear Regression with Python
Lab 5
Explore new data, create regression model
Lab 5
Explore new data, create regression model
 Приёмы устных вычислений вида: 470+80, 560-90
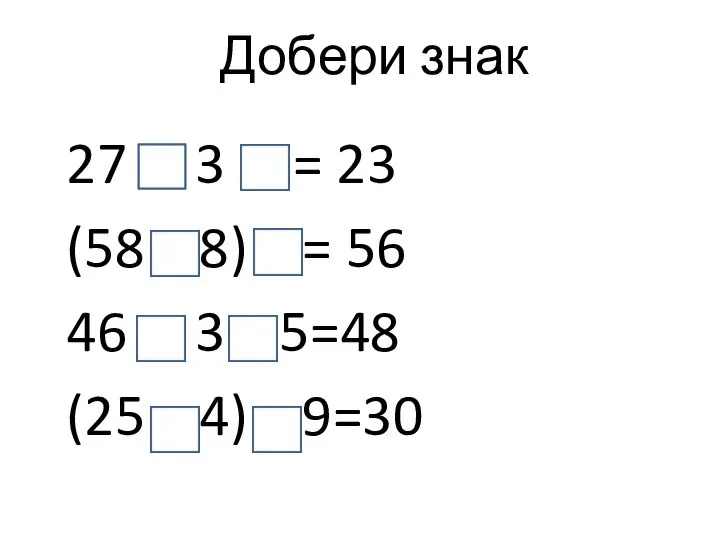 Добери знак
 Противоположные числа Какие числа называют противоположными? Как на координатной прямой располагаются точки, соответствующие п
 Элементы теории вероятностей
 Длина окружности. Коллекция задач для 6 класса
 Матриці та дії над ними. Поняття і види матриць
 Первообразная и неопределённый интеграл
 Свойства двойного интеграла
 Дифференциал функции
 Метрология. Основные понятия
 Правильные многоугольники
 Арифметическая и геометрическая прогрессии Учитель математики МБОУ «Адаевская ООШ» Актанышского муниципального района Респу
 Презентация по математике "Теорема Пифагора" -
  Многогранники. Все формулы. Геометрия (10-11 класс)
 Математическое моделирование. Значимость коэффициентов регрессии
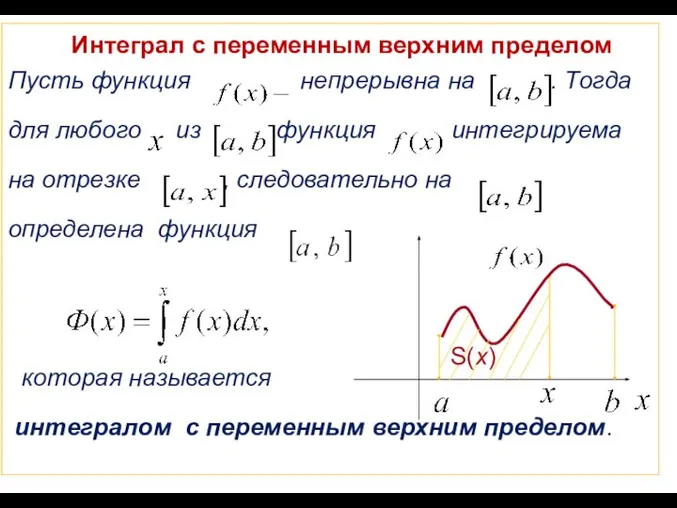 Интеграл с переменным верхним пределом
 Количественные характеристики случайной величины. Описательная статистика. (Лекция 4)
 Математические забавы
 Построение информационной модели метода изготовления изделия
 Применение подобия к доказательству теорем и решению задач. Урок 38
 Площа бічної та повної поверхонь конуса
 Математика вокруг нас. Внеклассное мероприятие
 Презентация по математике "Упрощение выражений 6 класс" - скачать
  Практикум по решению задачи №20 (базовый уровень). ЕГЭ
 Размещение из N элементов по k (k ≤ n)
 Число 14. Многоугольники
 Иррациональные неравенства. Виды и способы решения
 Решение задач на площадь треугольника