- Электрокардиография – ЭКГ Electrocardiography - ECG

Содержание
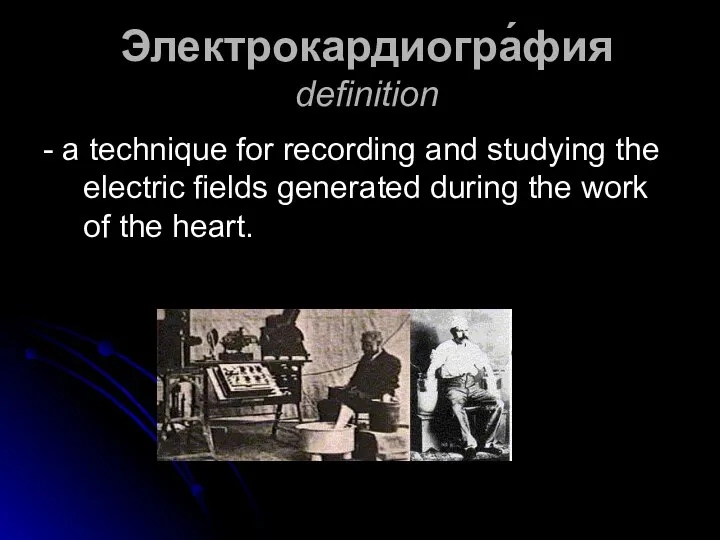
- 2. Электрокардиогра́фия definition - a technique for recording and studying the electric fields generated during the work
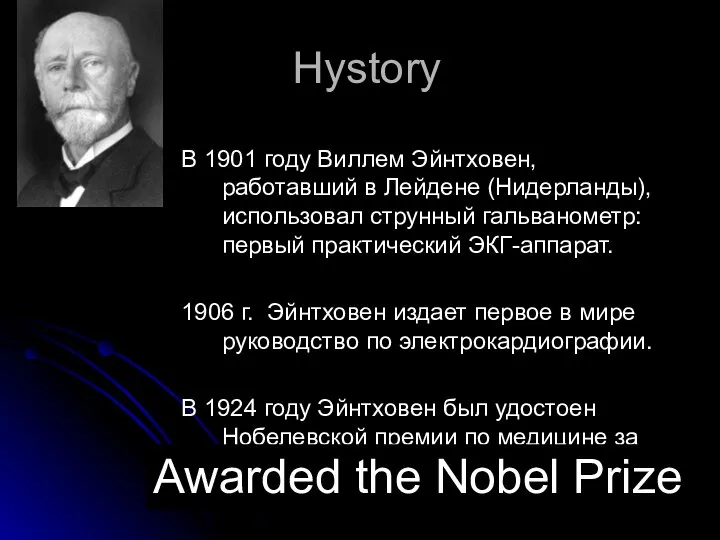
- 3. Hystory В 1901 году Виллем Эйнтховен, работавший в Лейдене (Нидерланды), использовал струнный гальванометр: первый практический ЭКГ-аппарат.
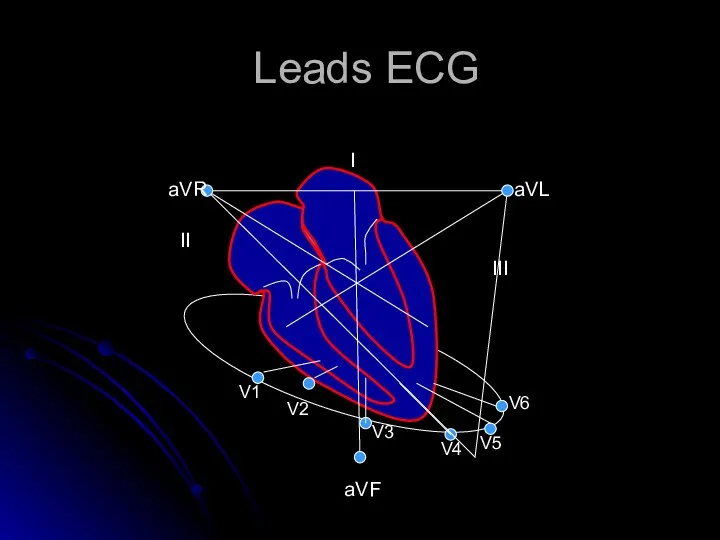
- 4. Leads ECG II III I aVR aVL aVF V1 V2 V4 V5 V6 V3
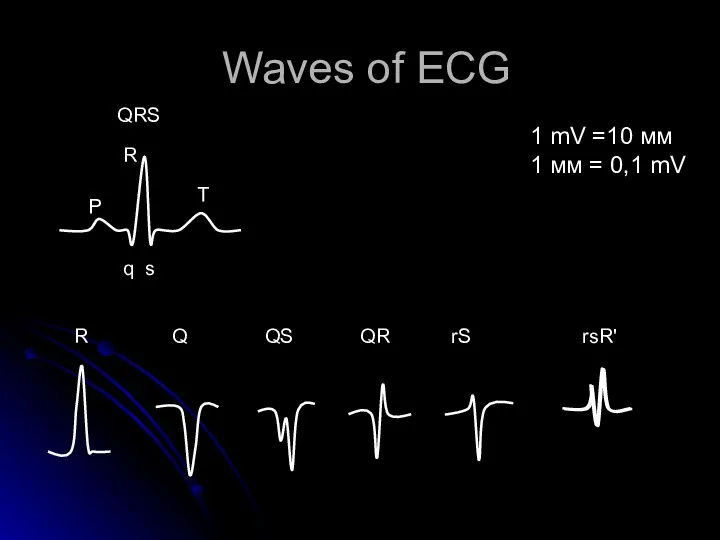
- 5. Waves of ECG Р q s T R QRS R Q QS QR rS rsR' 1
- 6. Intervals and segments interval PQ (PR) Сегмент ST segment PQ Интервал QT Сегмент ТР
- 8. ECG description outline 1. Heart rate / cердечный ритм Sinus rhythm criteria : - P (+)
- 9. 2. Frequency and regularity of rhythm 25 мм/с – 1 мм – 0,04 sec 50 мм/с
- 10. 3. p wave (зубец) The shape, duration ( LA hypertrophy I II aVL V5 V6 RA
- 11. 4. Interval PQ N 120-200 мс >200 ms – AV block
- 12. 5. QRS 5.1. QRS duration If the sinus QRS width is more than 100 ms ,
- 13. 5.2. Determination of the electrical axis of the heart N axis 0-90o RII > RI >
- 14. Deviation of the axis to the left aVL аVR aVF I II III + + +
- 15. Deviation to the right aVL аVR aVF I II III + + + RIII>RII>RIII
- 16. 0º (I) +90º (aVF) -90º - + -50º +45º +120º Отклонение ЭОС влево Нормальное расположение ЭОС
- 17. 5.3. Q wave– along or preceding negative wave in QRS A normal q wave is recorded
- 18. 5.4. R and S waves All positive waves of QRS complex are R waves The R
- 19. r S R`
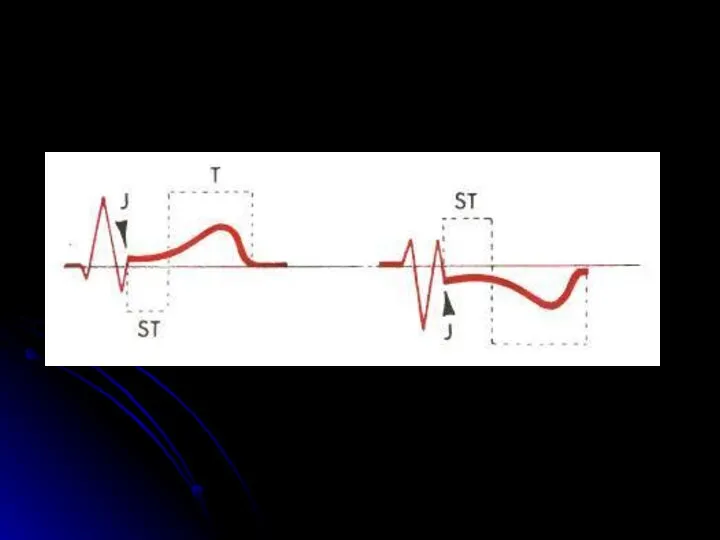
- 20. 6. ST segment The ST segment must be on the isoline (a deviation of 0.5 mm
- 21. J -point Point j is the place of the visible end of the QRS complex! J-точка
- 23. 7. Т wave Analysis of the shape and amplitude of the T wave in all leads
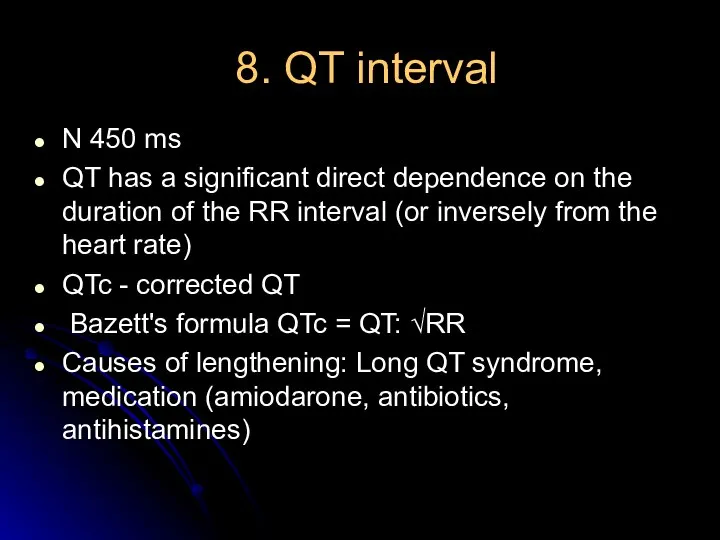
- 24. 8. QT interval N 450 ms QT has a significant direct dependence on the duration of
- 27. Скачать презентацию
Электрокардиогра́фия
definition
- a technique for recording and studying the electric fields generated
Электрокардиогра́фия
definition
- a technique for recording and studying the electric fields generated
Hystory
В 1901 году Виллем Эйнтховен, работавший в Лейдене (Нидерланды), использовал струнный
Hystory
В 1901 году Виллем Эйнтховен, работавший в Лейдене (Нидерланды), использовал струнный
Leads ECG
II
III
I
aVR
aVL
aVF
V1
V2
V4
V5
V6
V3
Leads ECG
II
III
I
aVR
aVL
aVF
V1
V2
V4
V5
V6
V3
Waves of ECG
Р
q s
T
R
QRS
R Q QS QR rS rsR'
1 mV
Waves of ECG
Р
q s
T
R
QRS
R Q QS QR rS rsR'
1 mV
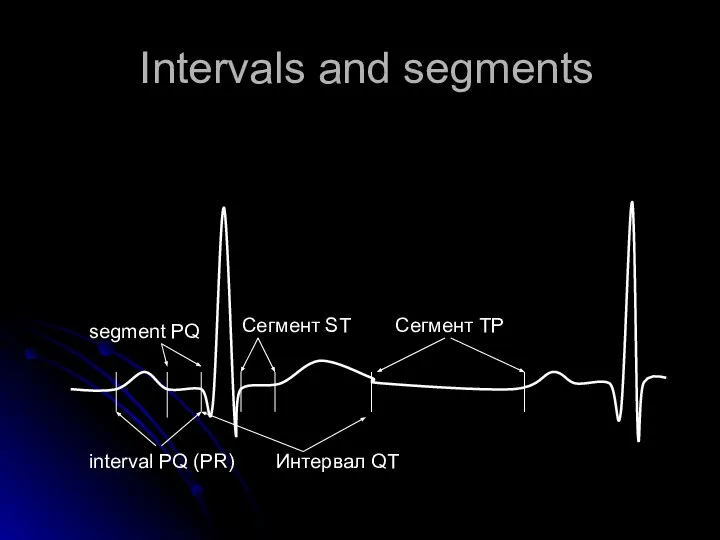
Intervals and segments
interval PQ (PR)
Сегмент ST
segment PQ
Интервал QT
Сегмент ТР
Intervals and segments
interval PQ (PR)
Сегмент ST
segment PQ
Интервал QT
Сегмент ТР
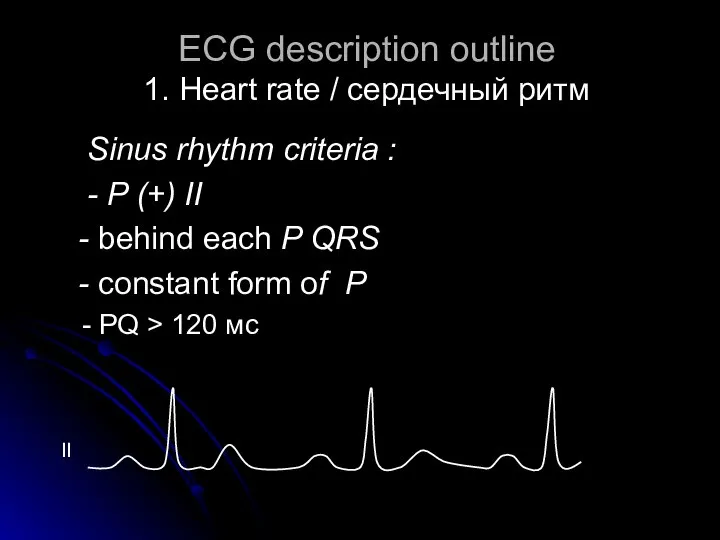
ECG description outline
1. Heart rate / cердечный ритм
Sinus rhythm
ECG description outline
1. Heart rate / cердечный ритм
Sinus rhythm
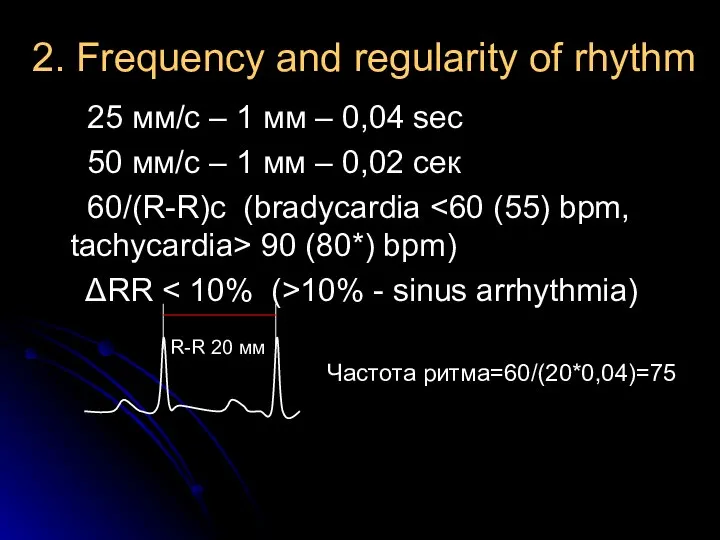
2. Frequency and regularity of rhythm
25 мм/с – 1 мм
2. Frequency and regularity of rhythm
25 мм/с – 1 мм
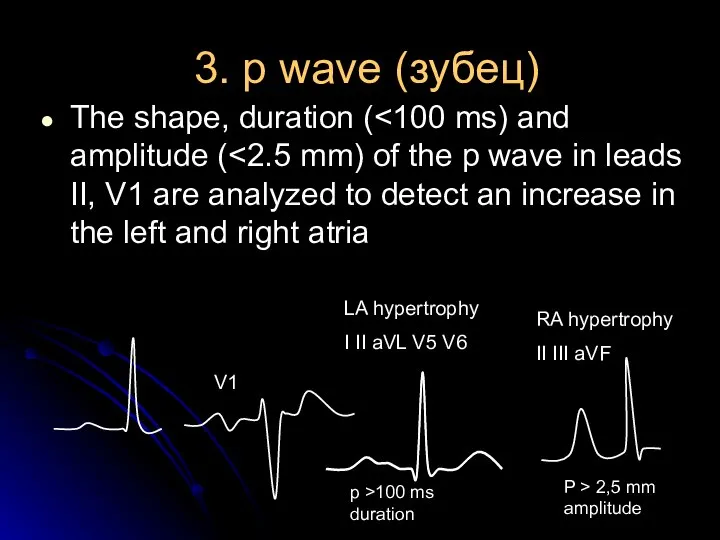
3. p wave (зубец)
The shape, duration (<100 ms) and amplitude (<2.5
3. p wave (зубец)
The shape, duration (<100 ms) and amplitude (<2.5
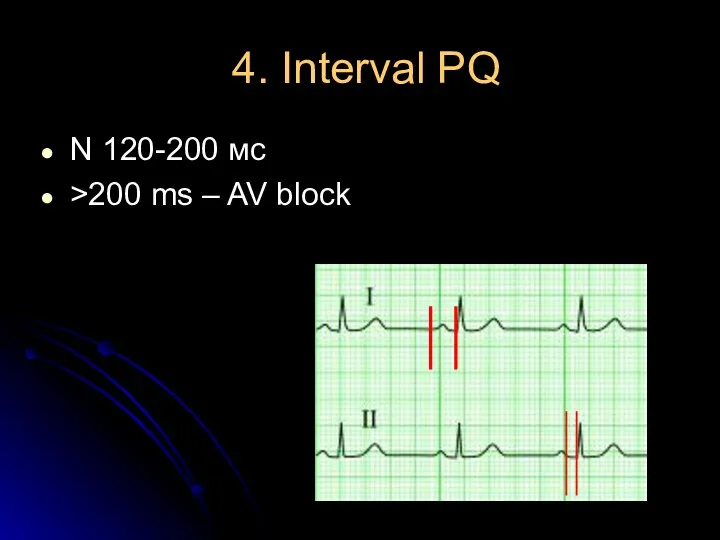
4. Interval PQ
N 120-200 мс
>200 ms – AV block
4. Interval PQ
N 120-200 мс
>200 ms – AV block
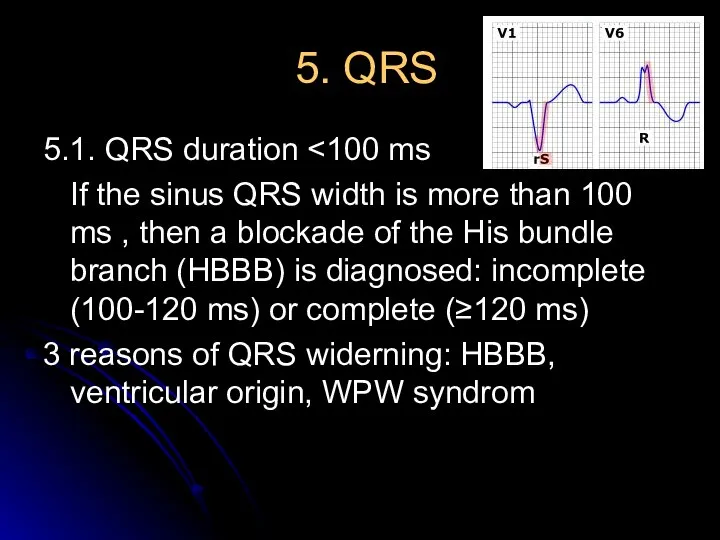
5. QRS
5.1. QRS duration <100 ms
If the sinus QRS width
5. QRS
5.1. QRS duration <100 ms
If the sinus QRS width
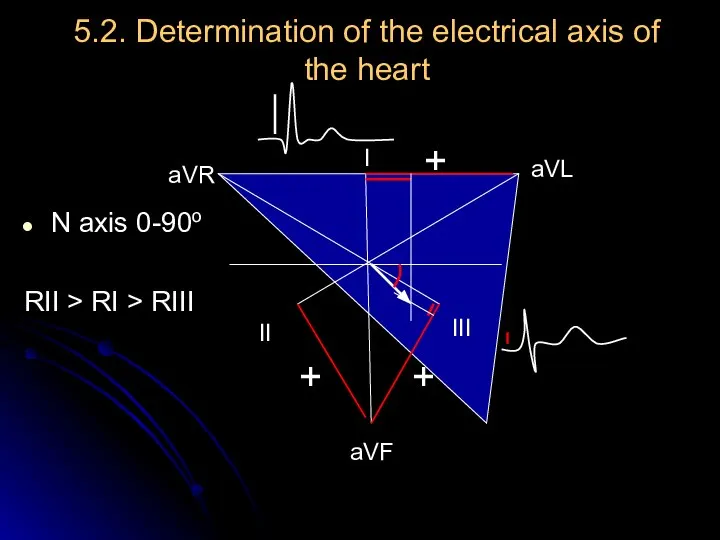
5.2. Determination of the electrical axis of the heart
N axis 0-90o
RII
5.2. Determination of the electrical axis of the heart
N axis 0-90o
RII
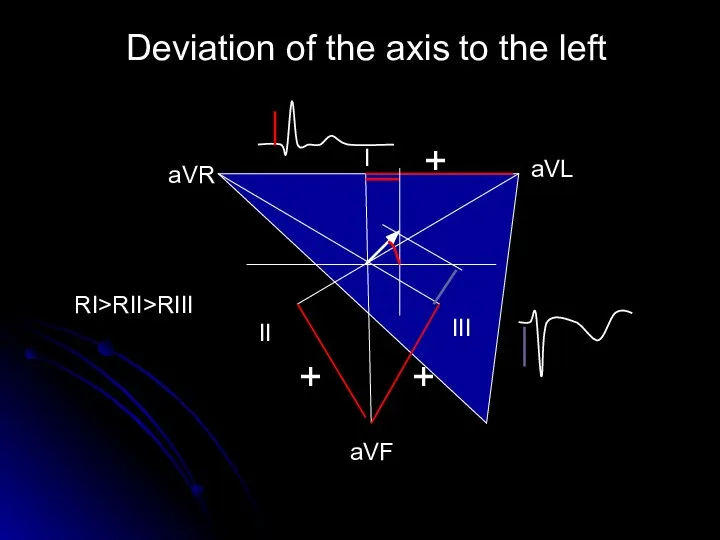
Deviation of the axis to the left
aVL
аVR
aVF
I
II
III
+
+
+
RI>RII>RIII
Deviation of the axis to the left
aVL
аVR
aVF
I
II
III
+
+
+
RI>RII>RIII
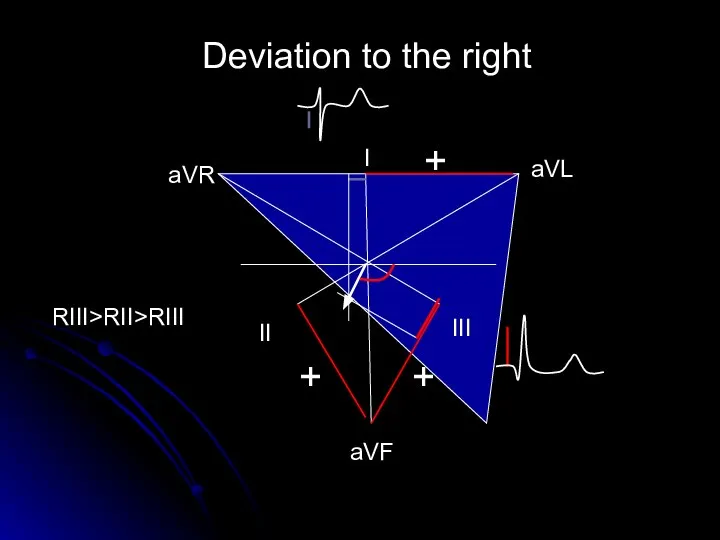
Deviation to the right
aVL
аVR
aVF
I
II
III
+
+
+
RIII>RII>RIII
Deviation to the right
aVL
аVR
aVF
I
II
III
+
+
+
RIII>RII>RIII
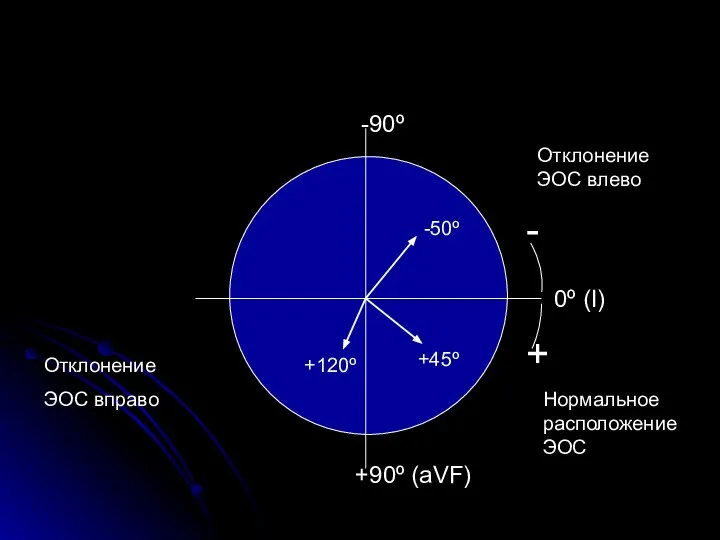
0º (I)
+90º (aVF)
-90º
-
+
-50º
+45º
+120º
Отклонение ЭОС влево
Нормальное расположение ЭОС
Отклонение
ЭОС вправо
0º (I)
+90º (aVF)
-90º
-
+
-50º
+45º
+120º
Отклонение ЭОС влево
Нормальное расположение ЭОС
Отклонение
ЭОС вправо

5.3. Q wave– along or preceding negative wave in QRS
A normal
5.3. Q wave– along or preceding negative wave in QRS
A normal
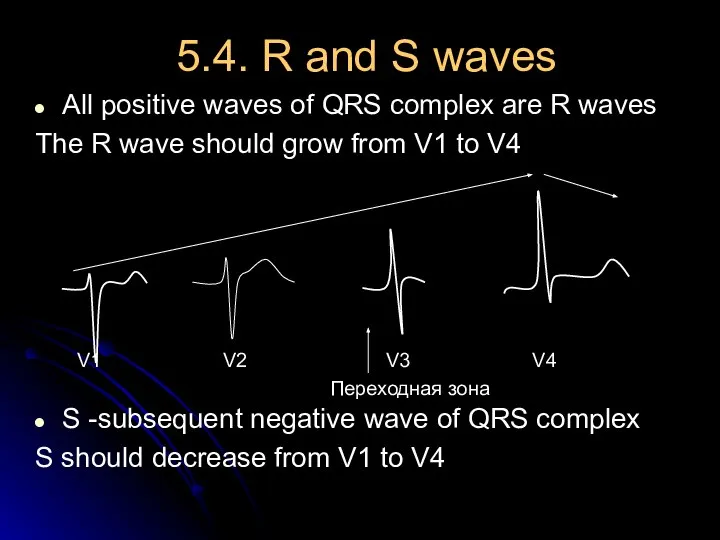
5.4. R and S waves
All positive waves of QRS complex are
5.4. R and S waves
All positive waves of QRS complex are
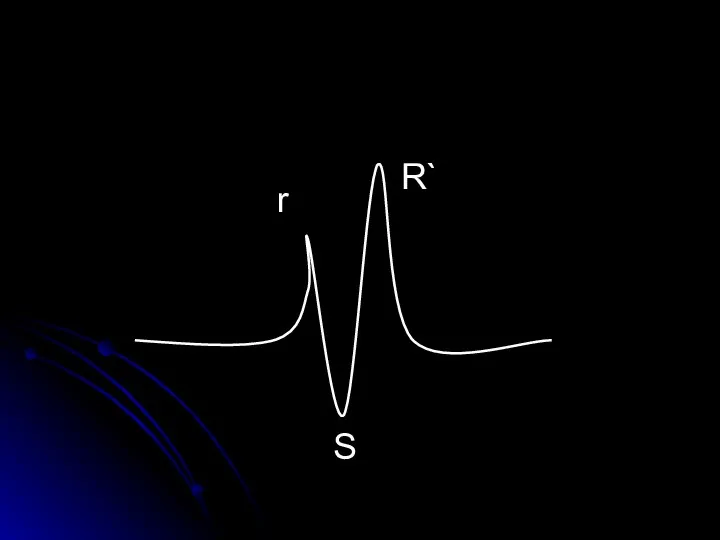
r
S
R`
r
S
R`
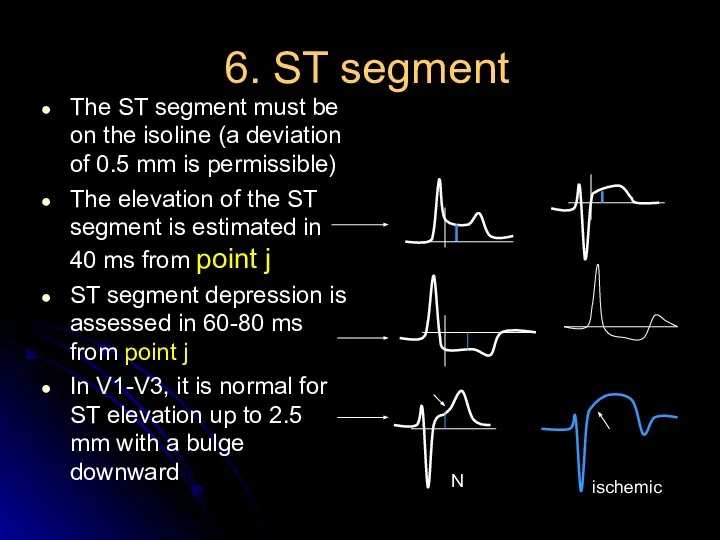
6. ST segment
The ST segment must be on the isoline (a
6. ST segment
The ST segment must be on the isoline (a
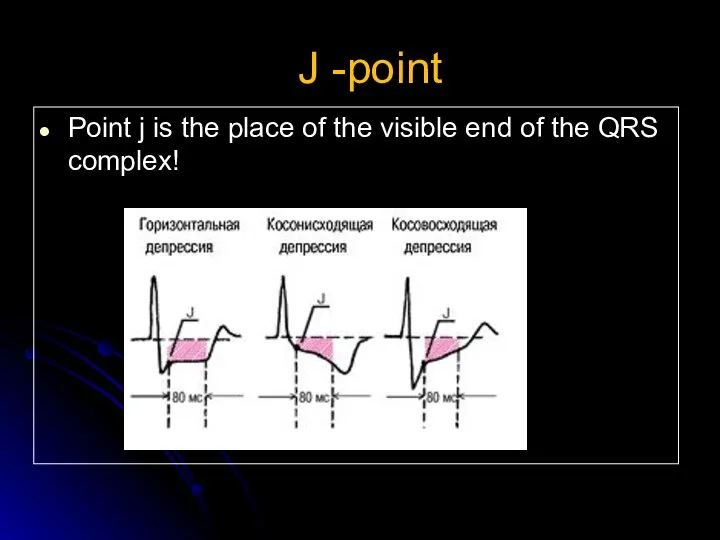
J -point
Point j is the place of the visible end of
J -point
Point j is the place of the visible end of
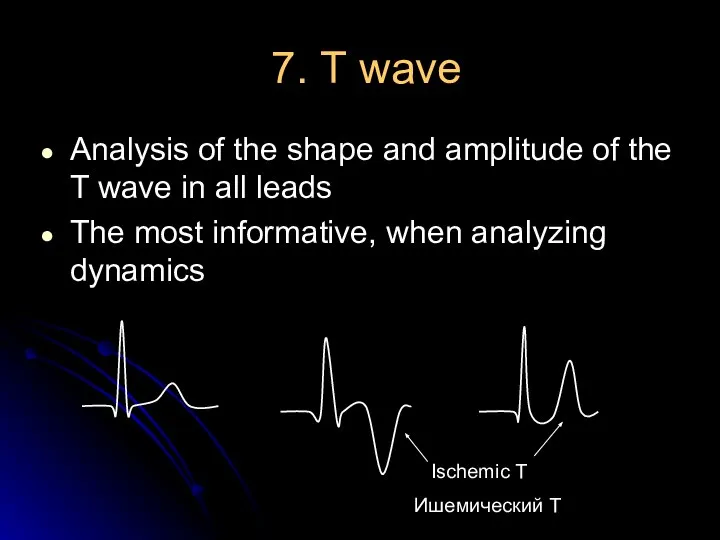
7. Т wave
Analysis of the shape and amplitude of the T
7. Т wave
Analysis of the shape and amplitude of the T
8. QT interval
N 450 ms
QT has a significant direct dependence on
8. QT interval
N 450 ms
QT has a significant direct dependence on
 Б±ќаралыќ аќпарат ќ±ралдары
 Защити себя от ВИЧ
 Состояние здоровья и физическое развитие детей и подростков
 ЗОЖ
ЗОЖ Гепатит A, C, G, T вирусы
 Остеохондроз позвоночника. Рентгенографические признаки остеохондроза
 Вплив алкоголю та паління на репродуктивну систему і потомство
 Причины нарушений зрения
 Регуляторные системы организма. Органы иммунной системы. Нормальные и патологические реакции иммунной системы
 Гематологические исследования
 Хронический бронхит
 Заболевания щитовидной железы
 Партограмма
 Сестринский уход при различных заболеваниях и состояниях. Сестринская помощь в хирургии. Кровотечение и гемостаз
 Туберкулез кезіндегі шаралар стандарттары мен алгоритмдері
 ICH процесі шеңберіндегі CTD жалпы техникалық құжаты
 Тестовый контроль по теме: Инфузии и основы трансфузиологии для специальности Сестринское дело
 Рентгенографическая и компьютерно-томографическая диагностика острых и хронических синуситов
 Витамины
 Вербальные и невербальные коммуникации
 Правильные ответы викторины по станции Медицинская
 Вегетативная нервная система и синдромы ее нарушения
 Антибиотики: лечат или калечат
 То что просто для детей, невозможно для взрослых. 2 класс
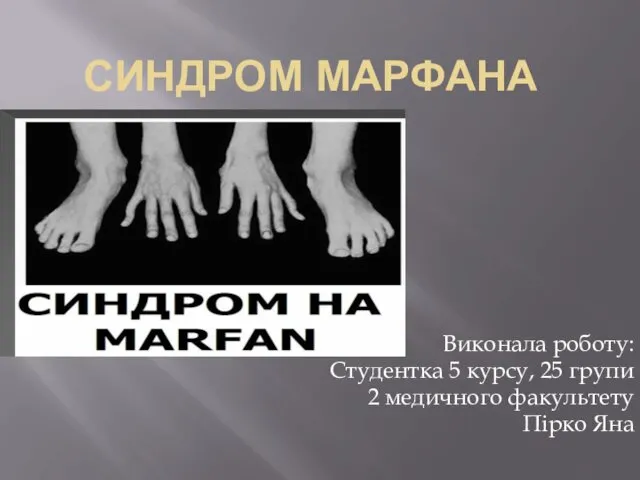 Синдром марфана
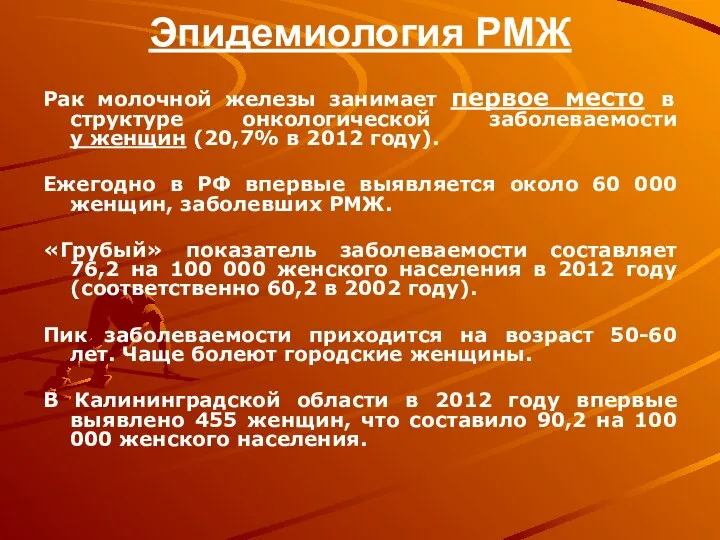 Эпидемиология РМЖ
 Комбинированные поражения (лекция № 5)
 Обследование больного в ортопедическом отделении. Оформление документации. Деонтология и этика в ортопедической стоматологии