- The Sun and Solar constant

Содержание
- 2. Some particularities of the solar atmosphere Solar atmosphere is non-homogeneous and very unstable. Phenomena in the
- 3. Two successive photos of a solar flare phenomenon evolving on the sun. The solar disk was
- 4. Solar spots Some relatively cold formations (4599 – 4600 K) of irregular shape appearing in the
- 5. http://en.wikipedia.org/wiki/File:Solar-cycle-data.png
- 6. Total spectrum of the solar radiation Gamma rays Visible wavelengths (μ) X-rays Violet 0,39 – 0,455
- 8. http://en.wikipedia.org/wiki/File:Atmospheric_Transmission.png
- 9. Notion of OPTICAL WINDOW Emittance of the Sun is close to the emittance of the a.
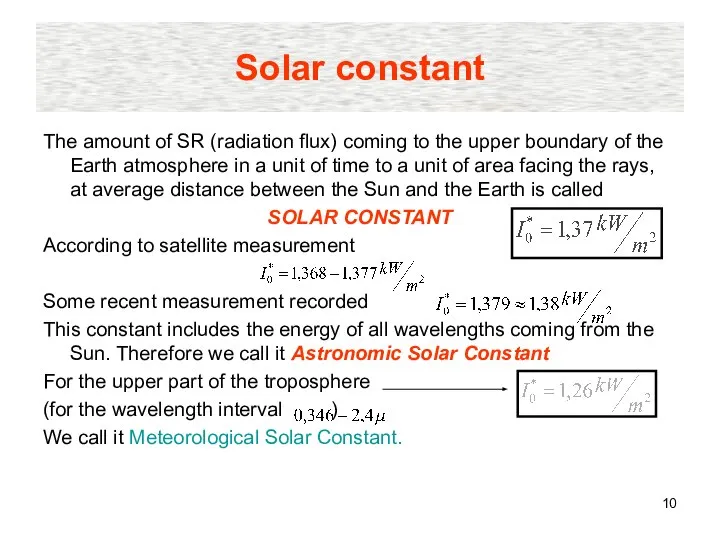
- 10. Solar constant The amount of SR (radiation flux) coming to the upper boundary of the Earth
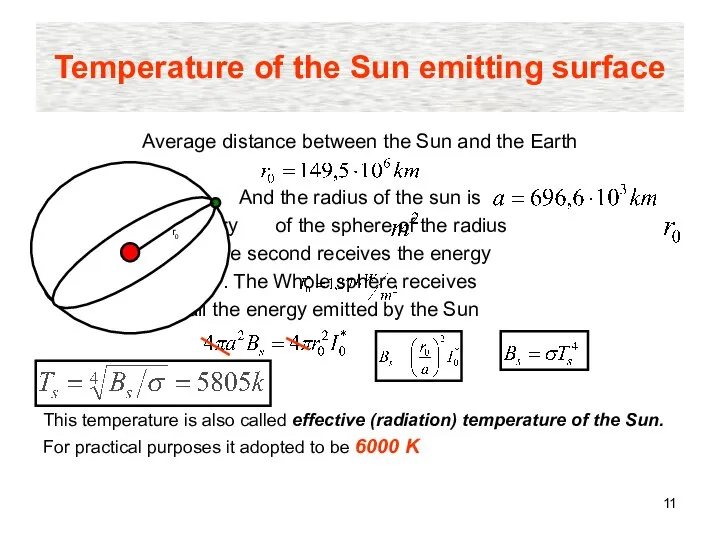
- 11. Temperature of the Sun emitting surface Average distance between the Sun and the Earth And the
- 13. Difference between the insolation in Northern and southern hemispheres is explained by the eccentricity of the
- 14. Distribution of the Sun energy in various areas of the spectrum UV ( ) – 9%
- 15. Solar radiation distribution over the globe We’ll consider the distribution over the upper “boundary of the
- 16. Insolation The flux of solar radiation falling on a horizontal surface is called INSOLATION denotes altitude
- 17. Denotes time of sunrise Denotes time of sunset At
- 18. Calculation made from this formula allowed obtaining following distribution of the insolation over the globe.
- 20. The Q values in summer of the Southern hemisphere are bigger than corresponding values for the
- 22. Скачать презентацию
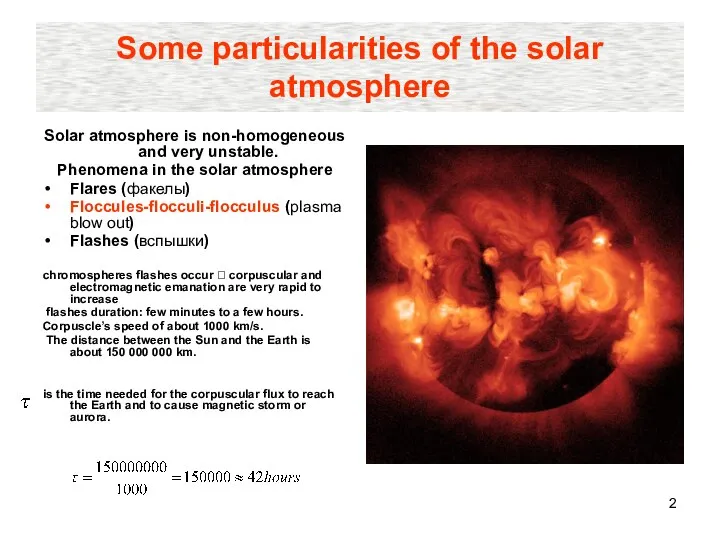
Some particularities of the solar atmosphere
Solar atmosphere is non-homogeneous and very
Some particularities of the solar atmosphere
Solar atmosphere is non-homogeneous and very
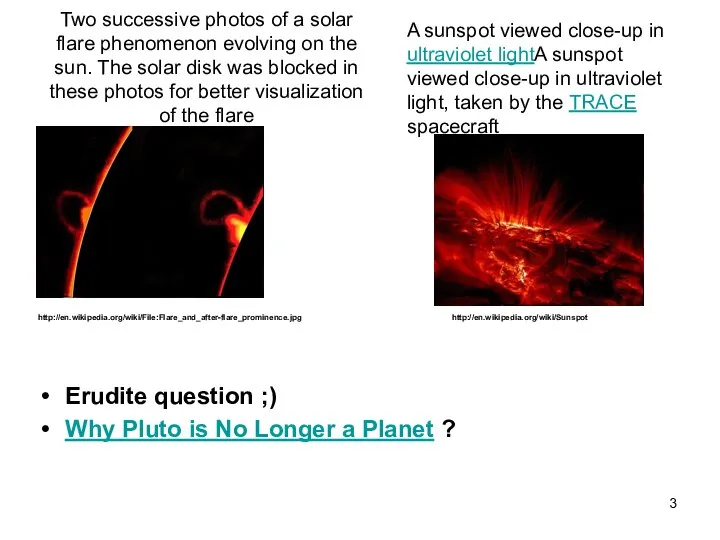
Two successive photos of a solar flare phenomenon evolving on the
Two successive photos of a solar flare phenomenon evolving on the
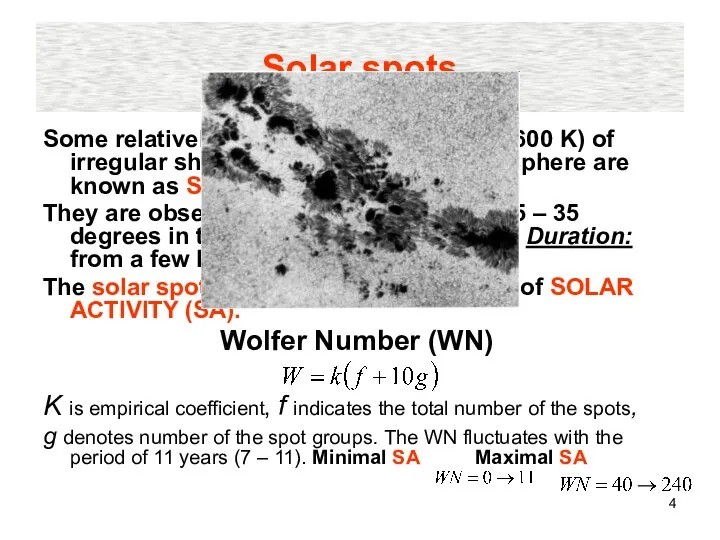
Solar spots
Some relatively cold formations (4599 – 4600 K) of irregular
Solar spots
Some relatively cold formations (4599 – 4600 K) of irregular
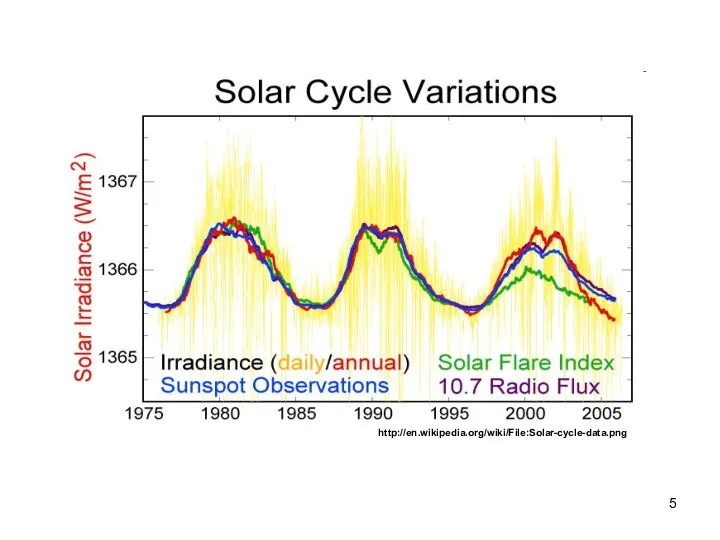
http://en.wikipedia.org/wiki/File:Solar-cycle-data.png
http://en.wikipedia.org/wiki/File:Solar-cycle-data.png
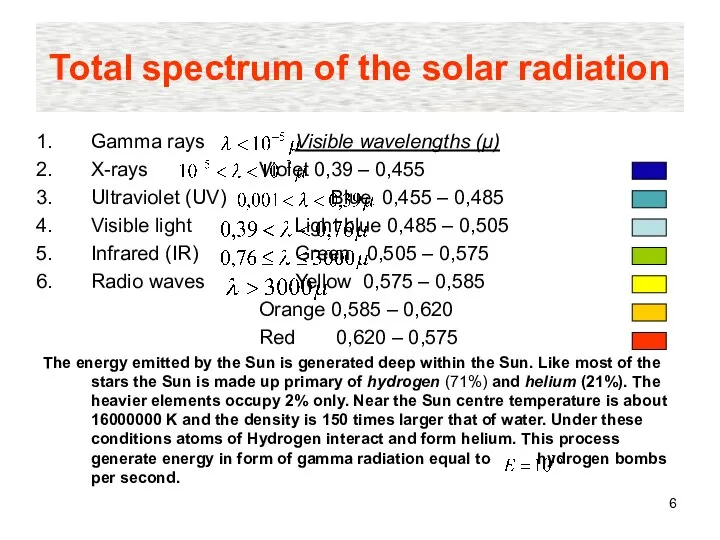
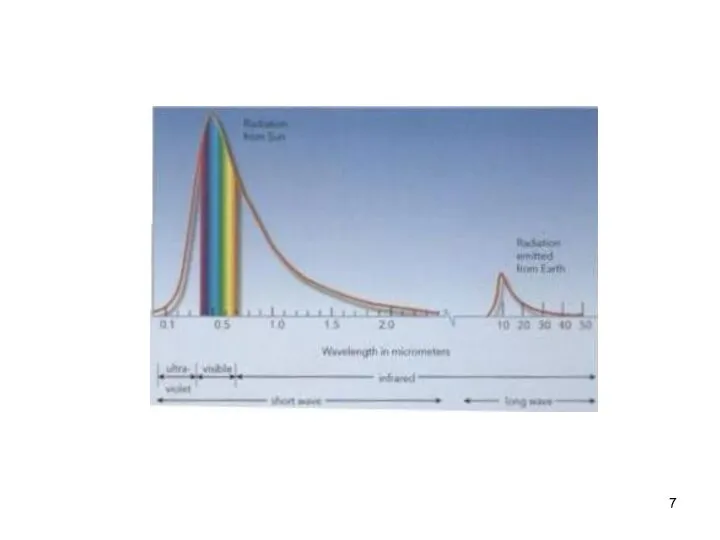
Total spectrum of the solar radiation
Gamma rays Visible wavelengths (μ)
X-rays Violet 0,39 –
Total spectrum of the solar radiation
Gamma rays Visible wavelengths (μ)
X-rays Violet 0,39 –
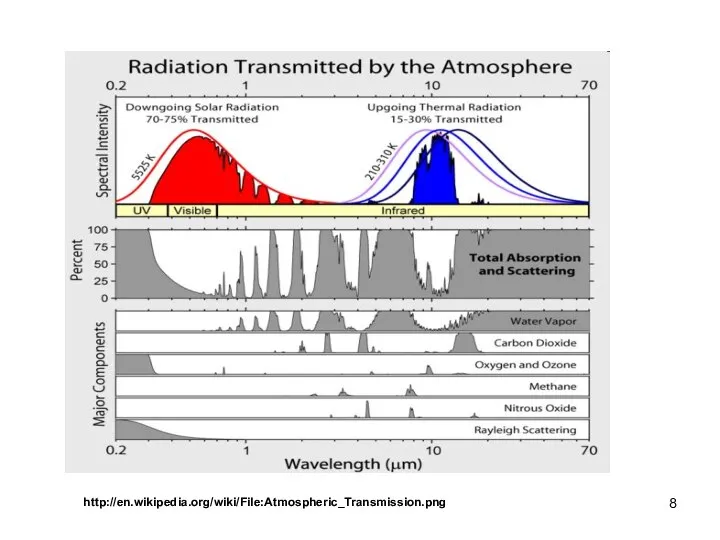
http://en.wikipedia.org/wiki/File:Atmospheric_Transmission.png
http://en.wikipedia.org/wiki/File:Atmospheric_Transmission.png
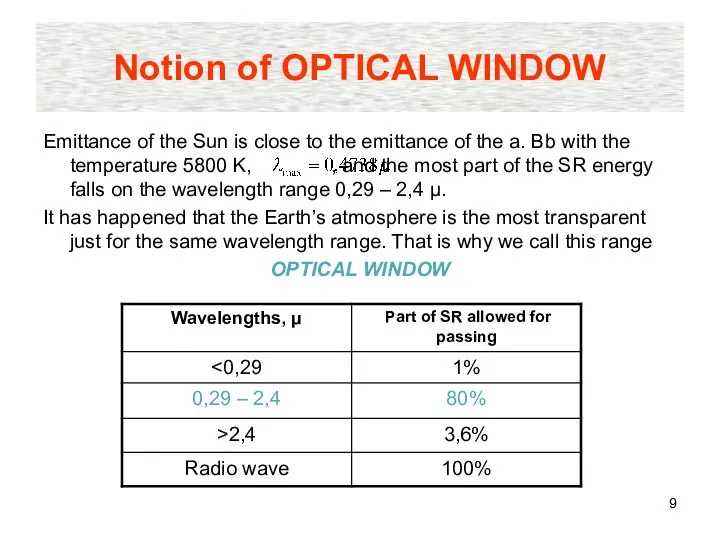
Notion of OPTICAL WINDOW
Emittance of the Sun is close to the
Notion of OPTICAL WINDOW
Emittance of the Sun is close to the
Solar constant
The amount of SR (radiation flux) coming to the upper
Solar constant
The amount of SR (radiation flux) coming to the upper
Temperature of the Sun emitting surface
Average distance between the Sun and
Temperature of the Sun emitting surface
Average distance between the Sun and
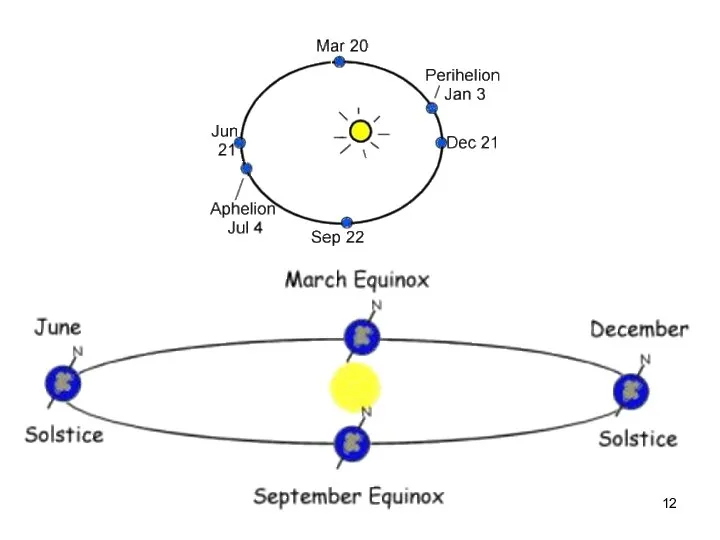
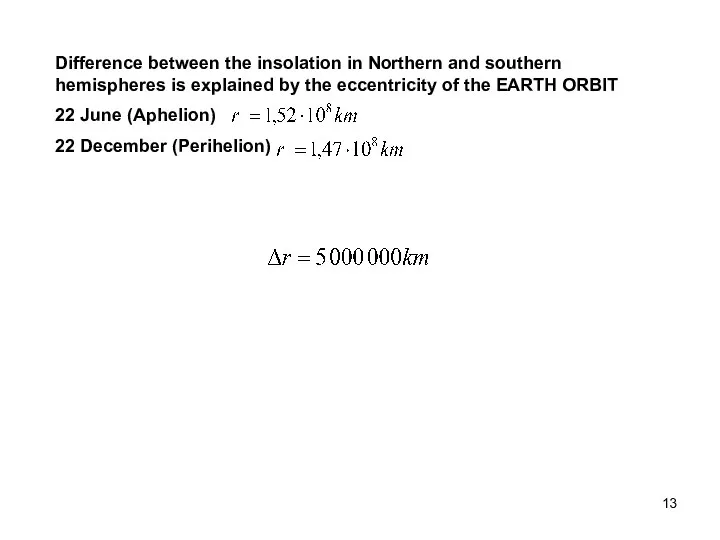
Difference between the insolation in Northern and southern hemispheres is explained
Difference between the insolation in Northern and southern hemispheres is explained
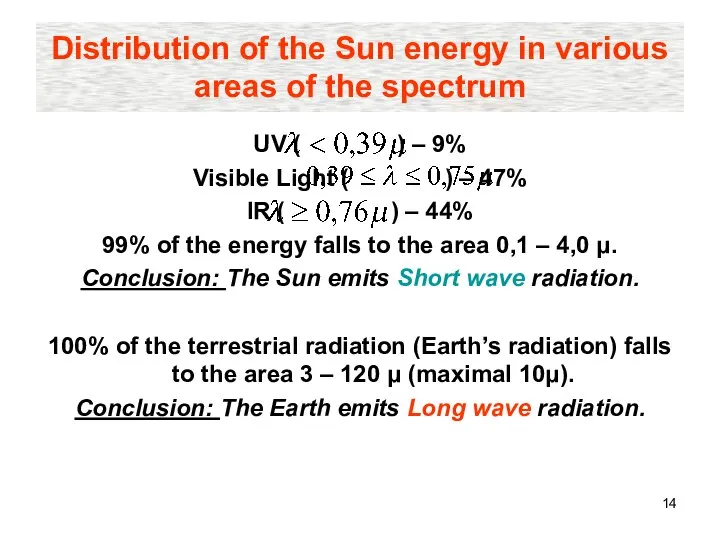
Distribution of the Sun energy in various areas of the spectrum
UV
Distribution of the Sun energy in various areas of the spectrum
UV
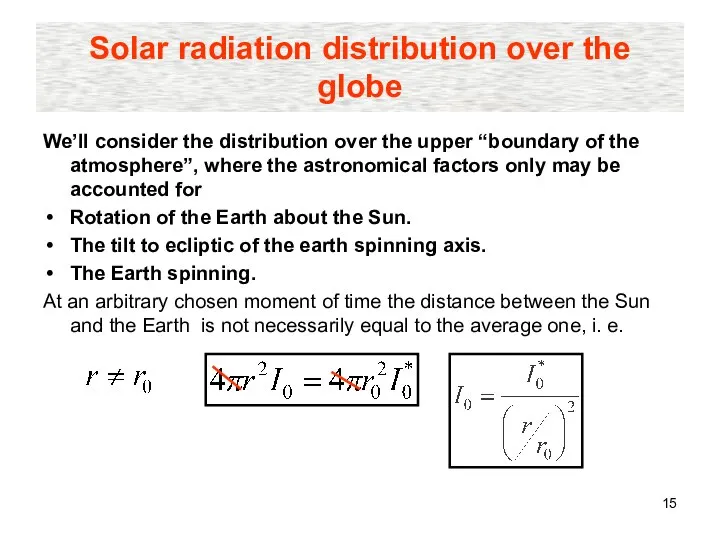
Solar radiation distribution over the globe
We’ll consider the distribution over the
Solar radiation distribution over the globe
We’ll consider the distribution over the
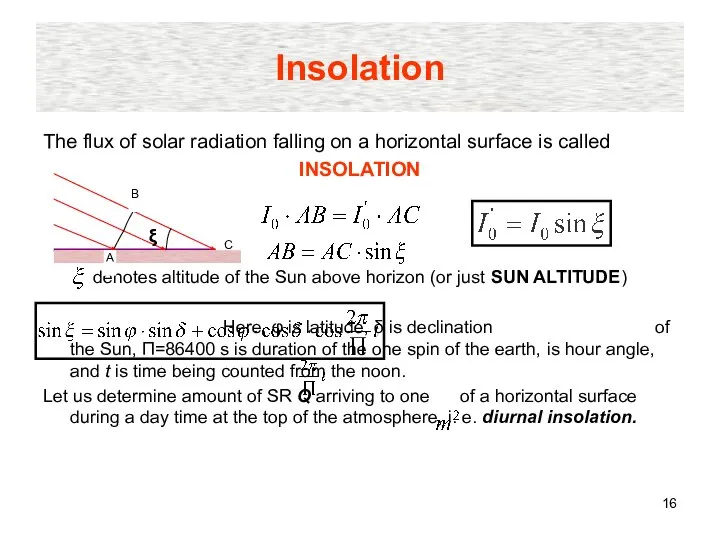
Insolation
The flux of solar radiation falling on a horizontal surface is
Insolation
The flux of solar radiation falling on a horizontal surface is
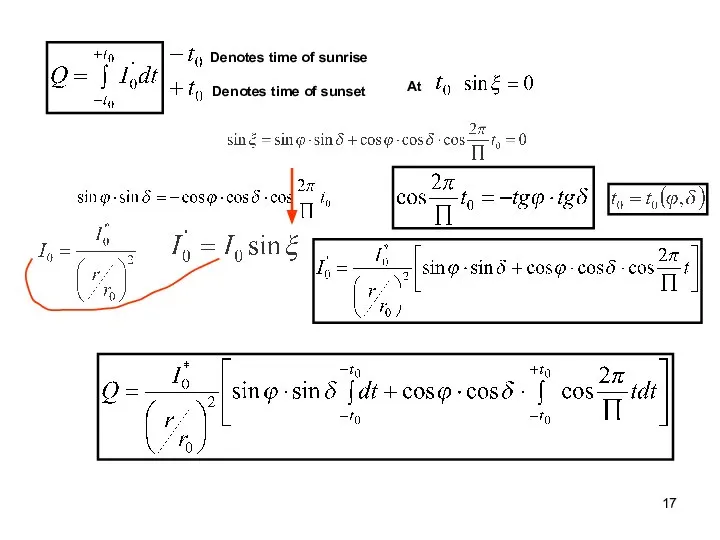
Denotes time of sunrise
Denotes time of sunset
At
Denotes time of sunrise
Denotes time of sunset
At
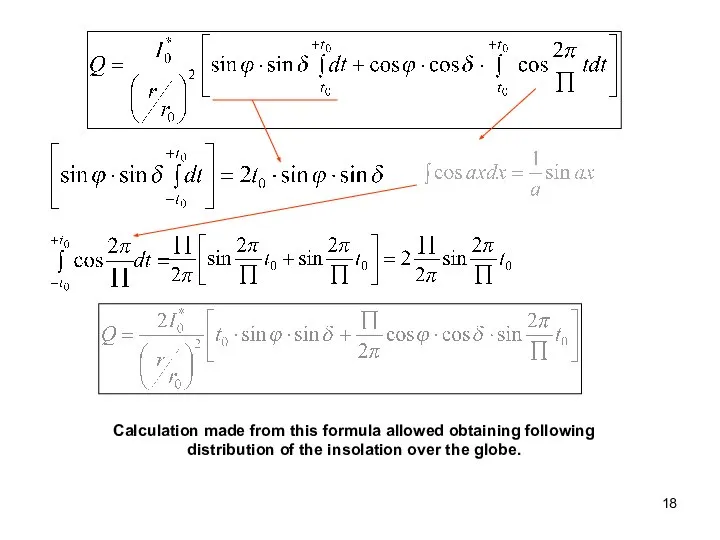
Calculation made from this formula allowed obtaining following distribution of the
Calculation made from this formula allowed obtaining following distribution of the
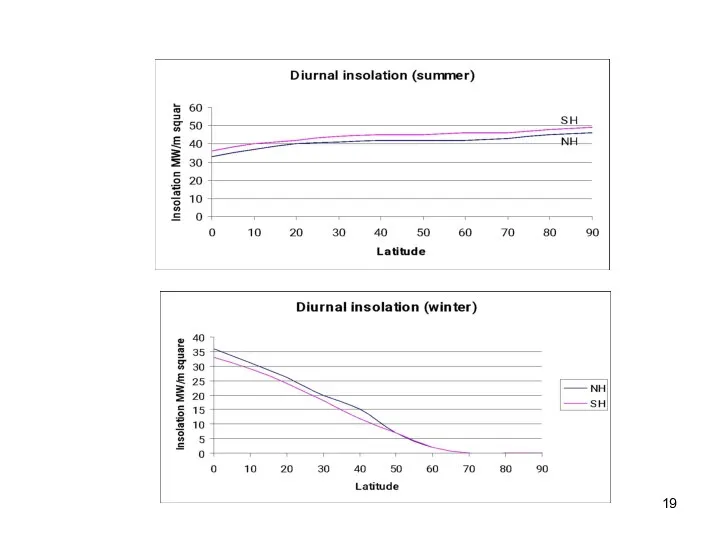
The Q values in summer of the Southern hemisphere are bigger
The Q values in summer of the Southern hemisphere are bigger
 Проверка эффективности посадочных страниц. (Тема 5)
 Дорохова Ю.А.
 Этика управления
 Причины и условия преступности
  Архитектура персональных компьютеров
 Скульптура Древнего Рима Исторический рельеф Скульптурный портрет Статуи
 Безопасность в социальных сетях
 Абсцесс и гангрена легких Здоровый человек
 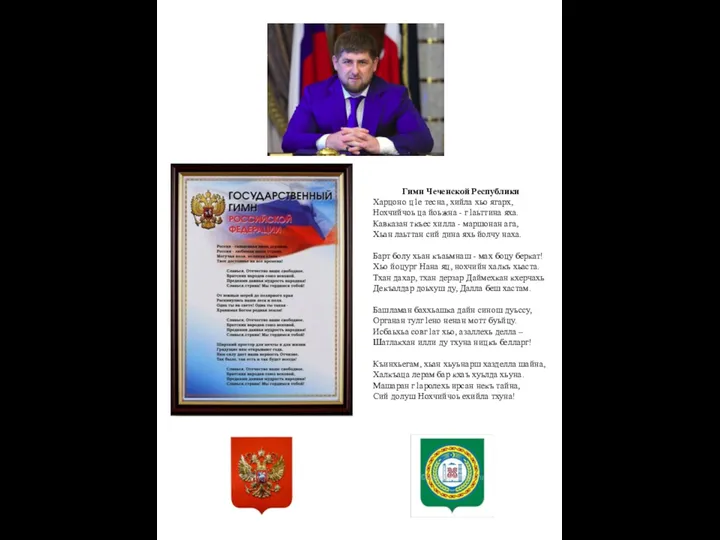 Символика. Гимн Чеченской Республики
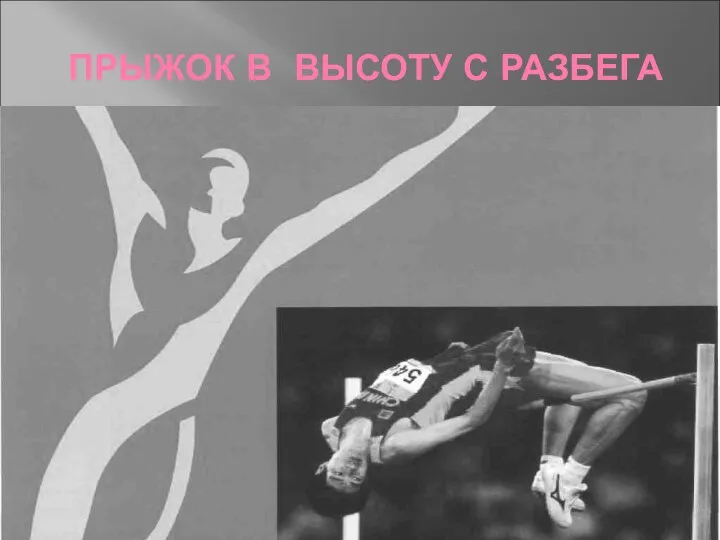 Прыжок в высоту с разбега
 4 класс МОУ Ермолинская ООШ Завьялова Е.М
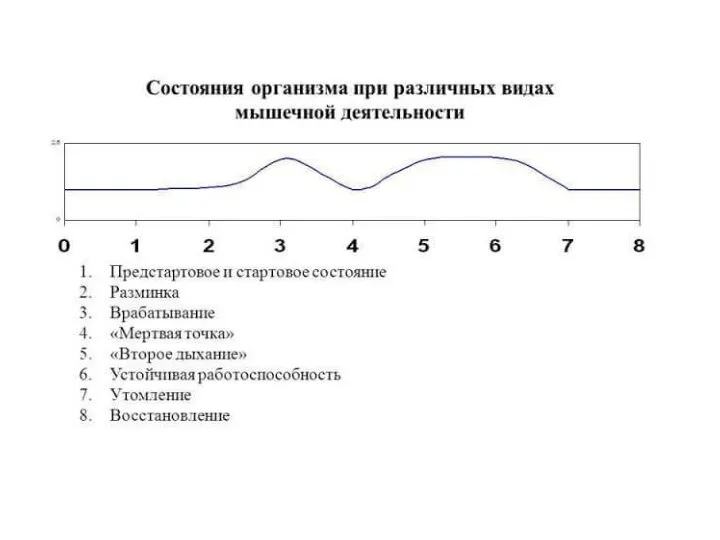 Период восстановления
 Великий канон cвятого Андрея Критского, читаемый в четверг пятой седмицы Великого поста
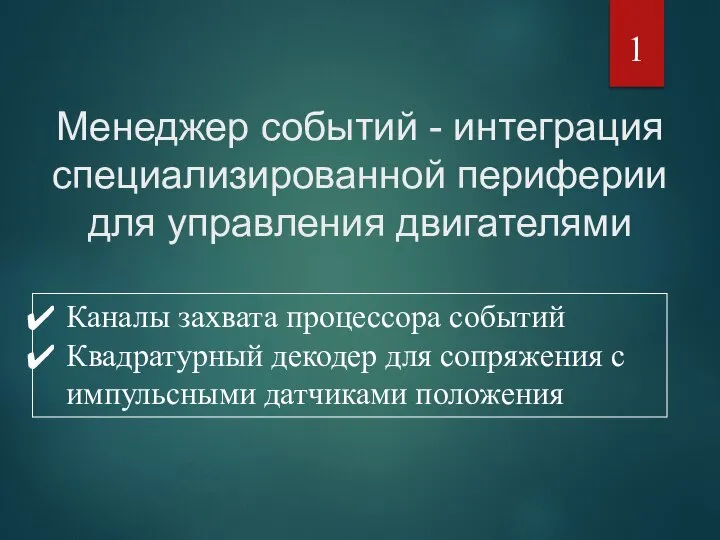 Оценка положения и скорости электропривода средствами МК
 БЕЛКИ-2
 Адвокатура
 Своеобразие русского романтизма
 Институты демократии в РФ. (Тема 4)
 Шлифовальные станки
 Подвиг героя. Перов Александр Валентинович
 MICHELANGELO (1475-1564)
  Формирование новых политических институтов в Афганистане
 Дворовый спорт
 Презентация Рыба и морепродукты
 Курсовая работа. Формирование мотивации к физкультурно-спортивной деятельности у школьников с нарушением интеллекта на занятиях
 иммунопатологические процессы
  Строительство индивидуальных жилых домов
 Москва проспект Андропова 19 площадь от 14 кв.м ставка 7000 за кв.м в мес