- Logistic Regression Model. Week 10

Содержание
- 2. Lecture outline Odds Ratio Simple Logistic (Logit) Regression Multiple Logistic (Logit) Regression
- 4. Linear Regression Model Yi = β0 + β1Xi + εi If the OLS (ordinary least squares)
- 5. Linear vs Logit Model Source: https://www.datacamp.com/
- 6. Simple Logistic Regression Model Logit form Probability form Note: This is a natural log (aka “ln”)
- 8. Estimation of coefficients Maximum Likelihood Estimation (MLE) is a statistical method for estimating the coefficients of
- 9. Example: Titanic Dataset R Code: titanic logit.m summary(logit.m)
- 10. Fitted simple logit model
- 11. Multiple Logistic Regression
- 12. R Output:
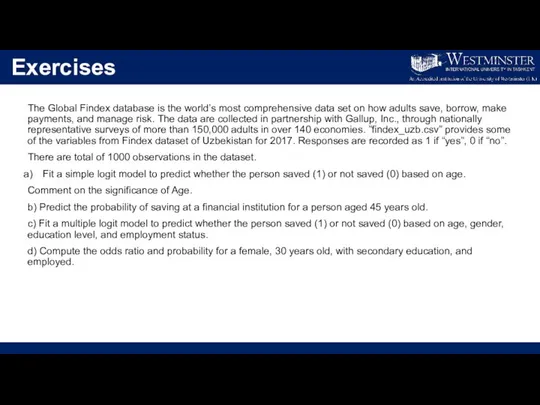
- 13. Exercises The Global Findex database is the world’s most comprehensive data set on how adults save,
- 14. Exercises
- 15. References James G. et al. An Introduction to Statistical Learning (with Applications in R). ISBN: 978-1-4614-7137-0.
- 17. Скачать презентацию
Lecture outline
Odds Ratio
Simple Logistic (Logit) Regression
Multiple Logistic (Logit) Regression
Lecture outline
Odds Ratio
Simple Logistic (Logit) Regression
Multiple Logistic (Logit) Regression
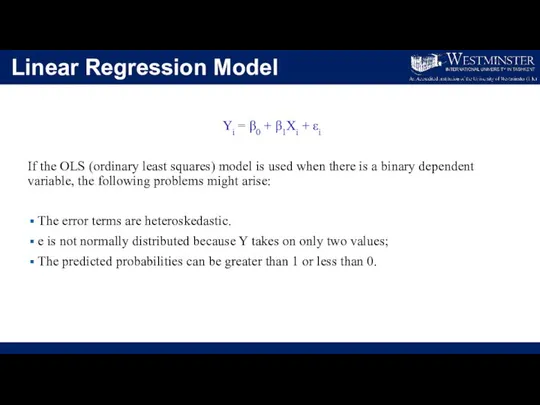
Linear Regression Model
Yi = β0 + β1Xi + εi
If the OLS
Linear Regression Model
Yi = β0 + β1Xi + εi
If the OLS
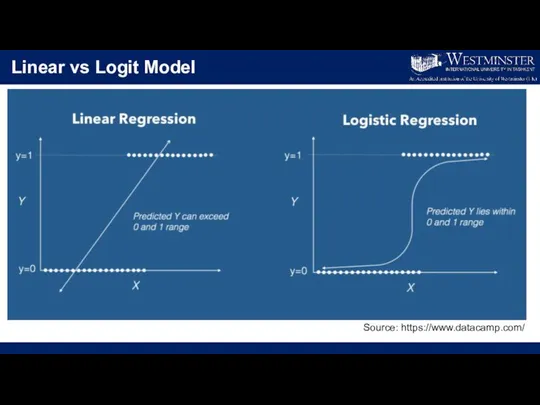
Linear vs Logit Model
Source: https://www.datacamp.com/
Linear vs Logit Model
Source: https://www.datacamp.com/
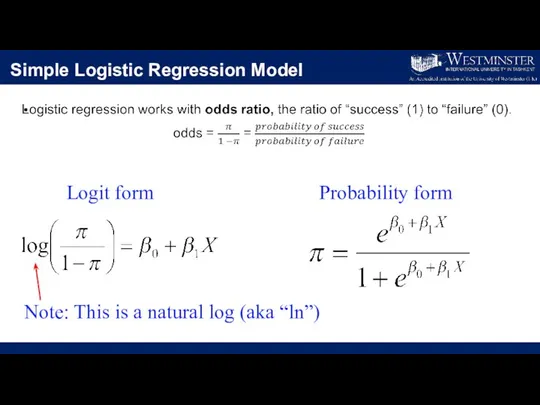
Simple Logistic Regression Model
Logit form
Probability form
Note: This is a natural log
Simple Logistic Regression Model
Logit form
Probability form
Note: This is a natural log
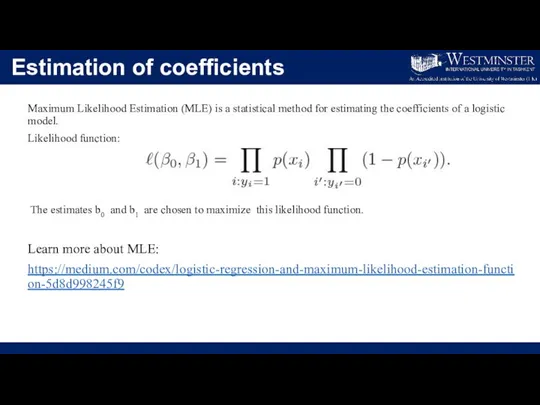
Estimation of coefficients
Maximum Likelihood Estimation (MLE) is a statistical method for
Estimation of coefficients
Maximum Likelihood Estimation (MLE) is a statistical method for
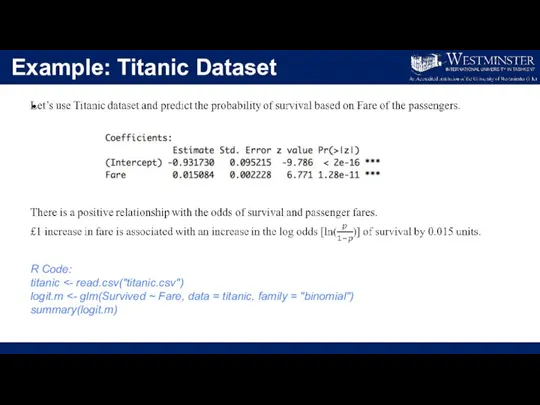
Example: Titanic Dataset
R Code:
titanic <- read.csv("titanic.csv")
logit.m <- glm(Survived ~ Fare, data
Example: Titanic Dataset
R Code:
titanic <- read.csv("titanic.csv")
logit.m <- glm(Survived ~ Fare, data
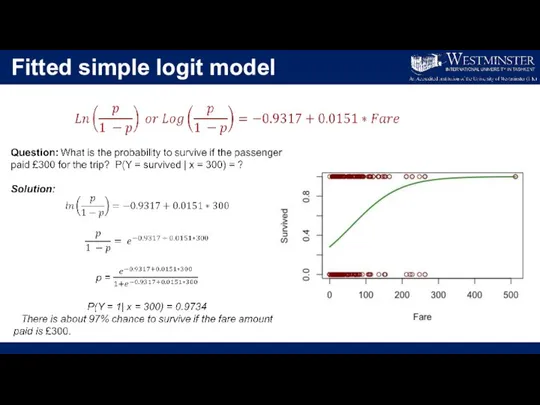
Fitted simple logit model
Fitted simple logit model
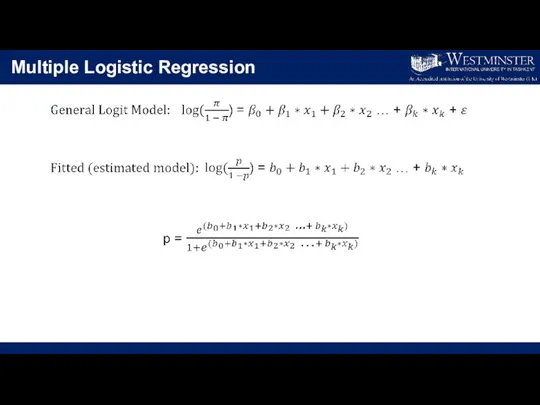
Multiple Logistic Regression
Multiple Logistic Regression
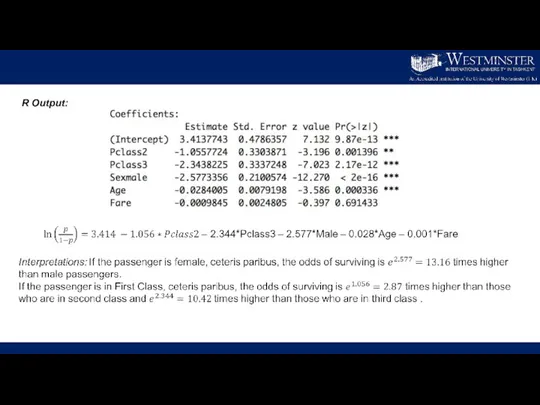
R Output:
R Output:
Exercises
The Global Findex database is the world’s most comprehensive data set
Exercises
The Global Findex database is the world’s most comprehensive data set
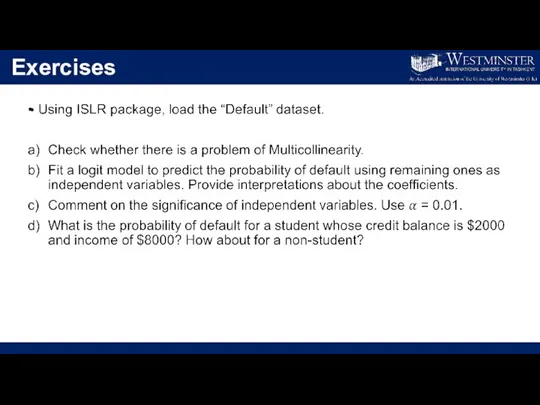
Exercises
Exercises
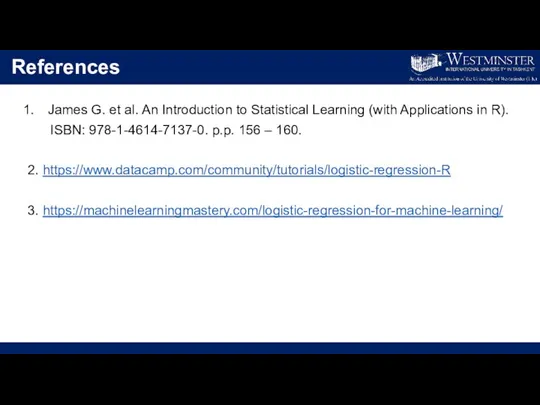
References
James G. et al. An Introduction to Statistical Learning (with Applications
References
James G. et al. An Introduction to Statistical Learning (with Applications
 Центральная и осевая симметрии в природе и архитектуре
 Признак перпендикулярности прямой и плоскости
 Лекция 04. О термине Геометрия
 Решение неравенств и систем неравенств. 8 класс
 Подборка задач по теме «Теорема Пифагора» Задачи с практическим содержанием
 Случаи вычитания 14 -
 Свойства арифметических квадратных корней Кутищева Н.С.
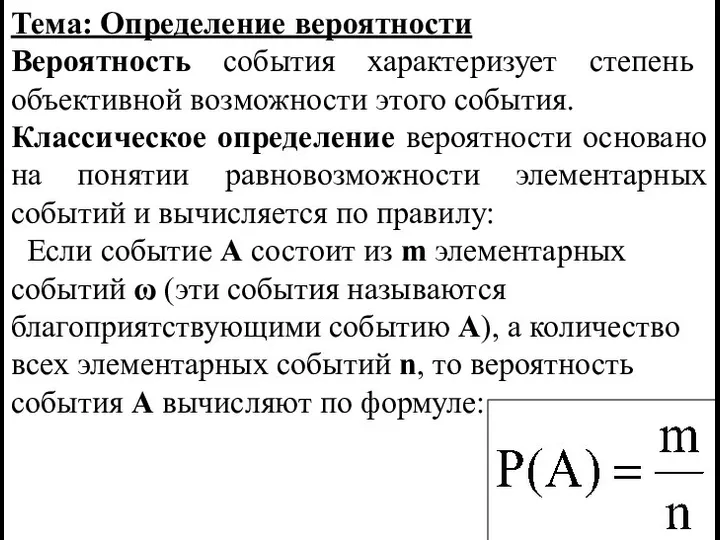 Определение вероятности
 Округление чисел Артамонова Лариса Владимировна, учитель математики МКОУ «Москаленский лицей»
 Вступ групи до математики
 Сума кутів трикутника
 Симметрия вокруг нас
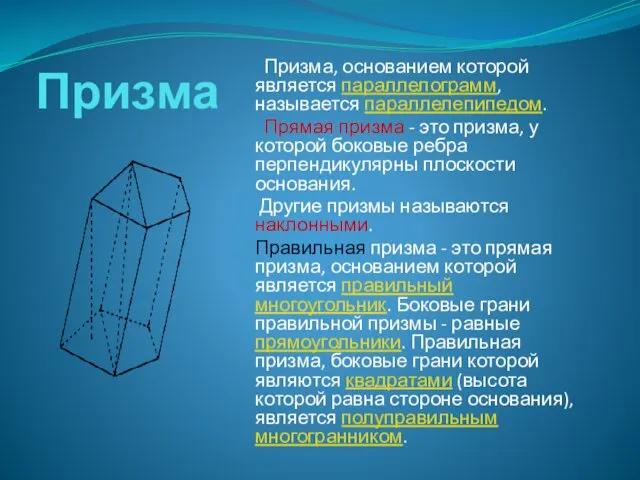 Призма. Свойства призмы
 Презентация по математике "Выбери действие" - скачать
  Логика и алгебра высказываний
 Графические методы при решении текстовых задач
 Решение показательных уравнений и неравенств
 МОУ Приаргунская Средняя Общеобразовательная Школа Выполнил : Ученик 6а класса Дворцов Павел Руководитель Капишулина Ирина Ми
 Выборочное наблюдение
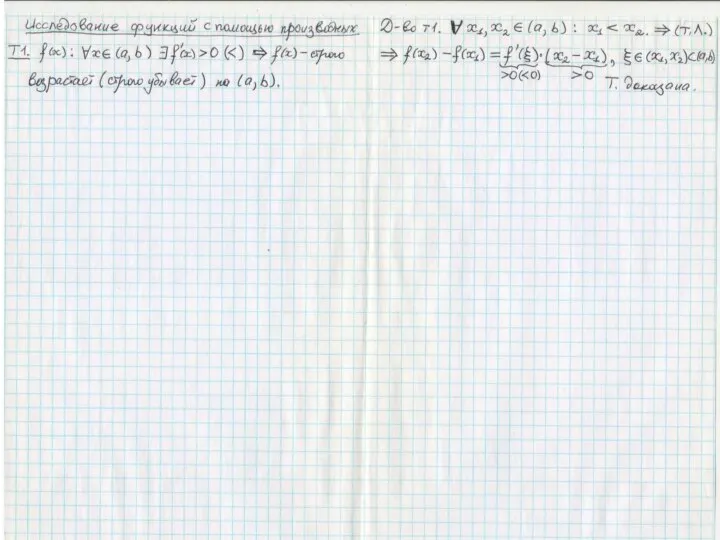 Исследование функций с помощью производных
 Круговые диаграммы
 Определение высоты здания
 Повторение пройденного материала
 Аксиоматическое построение системы натуральных чисел
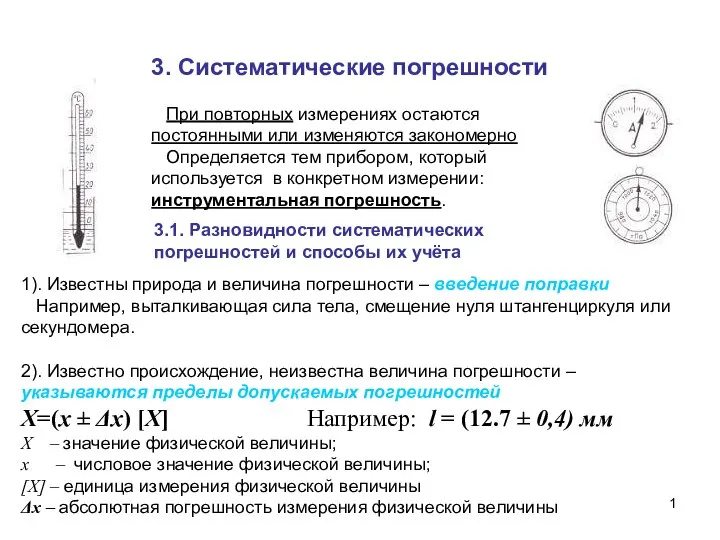 Систематические погрешности
 Геометрические фигуры, плоские и объемные
 Решение логарифмических уравнений и неравенств. Урок-соревнование по математике в 11 классе
 Дисциплина «Математические модели в инвестиционном проектировании»