- Measures of variation. Week 4 (2)

Содержание
- 2. Average distance to the mean: Standard deviation Most commonly used measure of variability Measures the standard
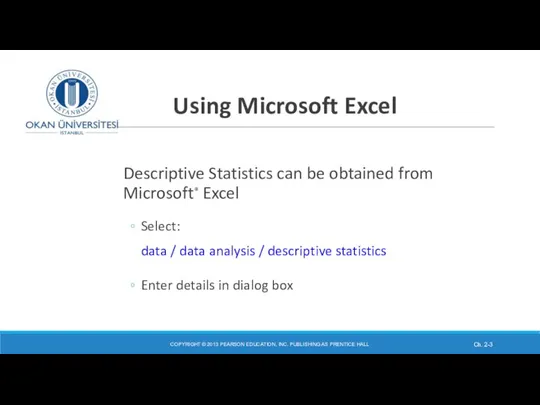
- 3. Using Microsoft Excel Descriptive Statistics can be obtained from Microsoft® Excel Select: data / data analysis
- 4. Using Excel to find Descriptive Statistics COPYRIGHT © 2013 PEARSON EDUCATION, INC. PUBLISHING AS PRENTICE HALL
- 5. Using Excel to find Descriptive Statistics Enter input range details Check box for summary statistics Click
- 6. Excel output COPYRIGHT © 2013 PEARSON EDUCATION, INC. PUBLISHING AS PRENTICE HALL Ch. 2- Microsoft Excel
- 7. Comparing Standard Deviations of 3 different data sets COPYRIGHT © 2013 PEARSON EDUCATION, INC. PUBLISHING AS
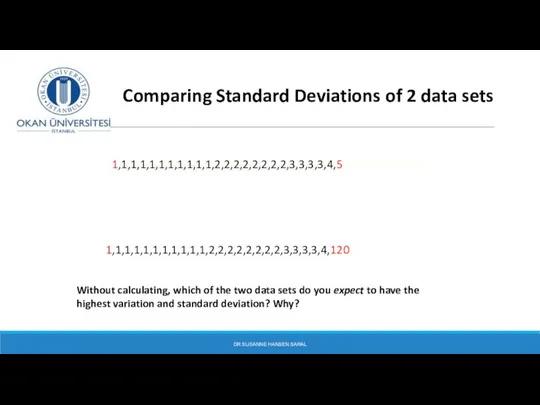
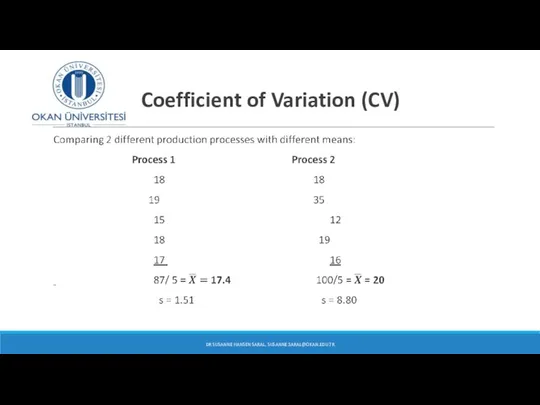
- 8. DR SUSANNE HANSEN SARAL 1,1,1,1,1,1,1,1,1,1,1,2,2,2,2,2,2,2,2,3,3,3,3,4,5 1,1,1,1,1,1,1,1,1,1,1,2,2,2,2,2,2,2,2,3,3,3,3,4,120 Comparing Standard Deviations of 2 data sets Without calculating, which
- 9. Describing distributions – what to pay attention to! Pay attention to: its’ shape (symmetric, right or
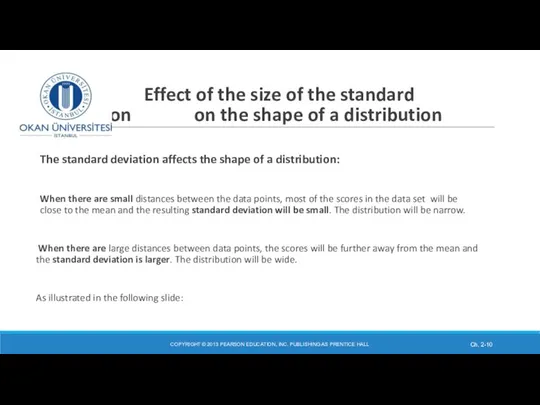
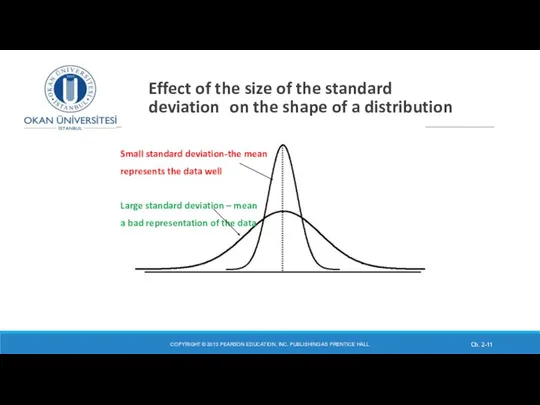
- 10. Effect of the size of the standard deviation on the shape of a distribution The standard
- 11. Effect of the size of the standard deviation on the shape of a distribution COPYRIGHT ©
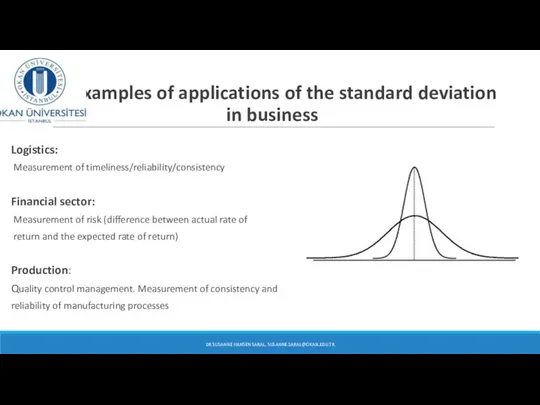
- 12. Examples of applications of the standard deviation in business Logistics: Measurement of timeliness/reliability/consistency Financial sector: Measurement
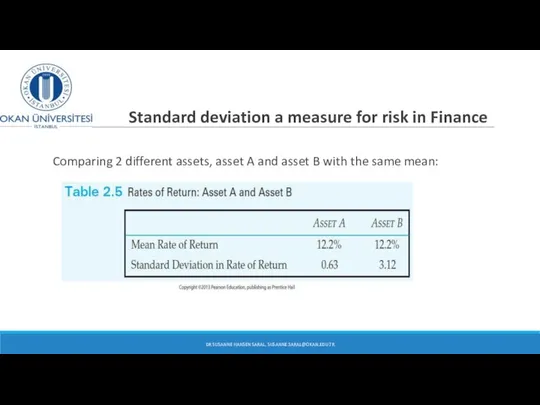
- 13. Standard deviation a measure for risk in Finance DR SUSANNE HANSEN SARAL, SUSANNE.SARAL@OKAN.EDU.TR Comparing 2 different
- 14. Standard deviation a measure for consistency in quality control (Consistency in Turkish: Tutarlılık) DR SUSANNE HANSEN
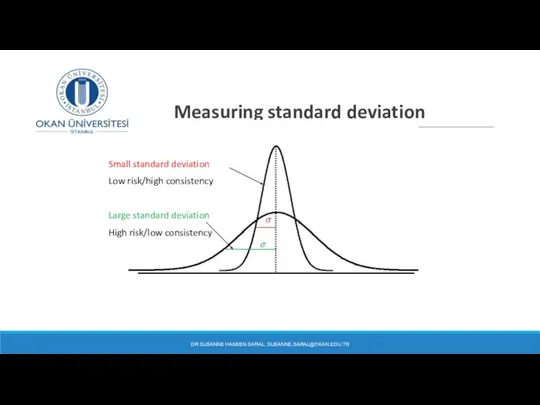
- 15. Measuring standard deviation DR SUSANNE HANSEN SARAL, SUSANNE.SARAL@OKAN.EDU.TR Small standard deviation Low risk/high consistency Large standard
- 16. Measuring standard deviation What does a standard deviation of 0 indicate? What shape will the distribution
- 17. Measuring the standard deviation Example of a data set with a standard deviation of 0: 53
- 18. Advantages of Variance and Standard Deviation Each single value in the data set is used in
- 19. Effect of outliers on Variance and standard deviation A large outlier (negative or positive) will increase
- 20. Comparing the consistency of two types of Golf clubs Golf equipment manufacturers are constantly seeking ways
- 21. Which iron is more consistent? The current or the newly developed? Excel output: COPYRIGHT © 2013
- 22. Interpretation of the data (golf club) The standard deviation of the distances of the current iron
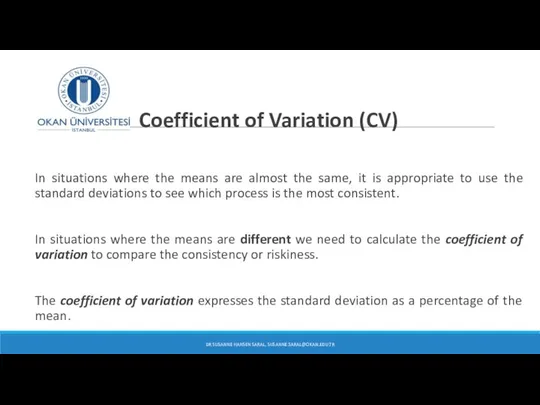
- 23. Coefficient of Variation (CV) In situations where the means are almost the same, it is appropriate
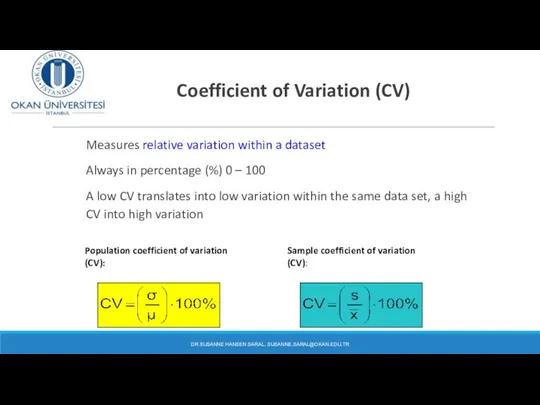
- 24. Coefficient of Variation (CV) Measures relative variation within a dataset Always in percentage (%) 0 –
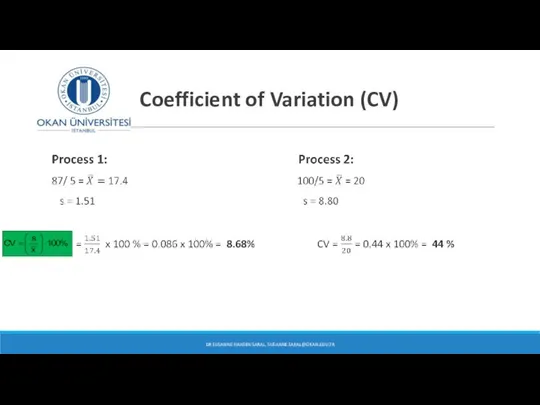
- 25. Coefficient of Variation (CV) DR SUSANNE HANSEN SARAL, SUSANNE.SARAL@OKAN.EDU.TR
- 26. Coefficient of Variation (CV) DR SUSANNE HANSEN SARAL, SUSANNE.SARAL@OKAN.EDU.TR
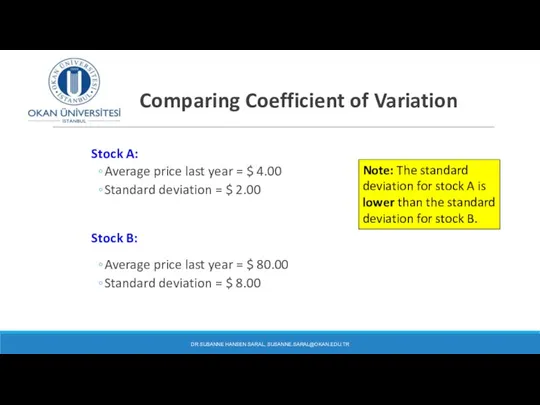
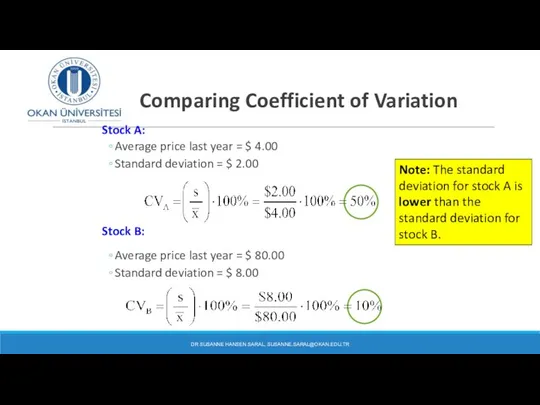
- 27. Comparing Coefficient of Variation Stock A: Average price last year = $ 4.00 Standard deviation =
- 28. Comparing Coefficient of Variation Stock A: Average price last year = $ 4.00 Standard deviation =
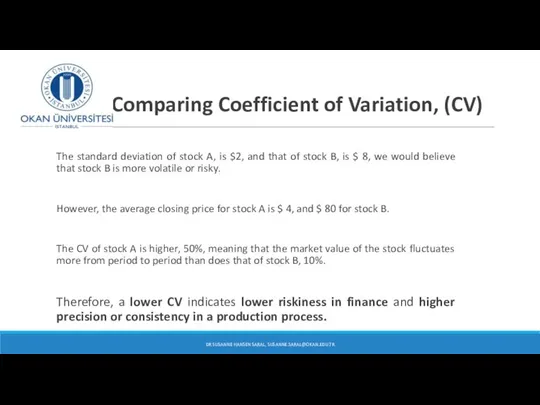
- 29. Comparing Coefficient of Variation, (CV) The standard deviation of stock A, is $2, and that of
- 30. When to use Standard deviation and coefficient of variation, when comparing two data sets Use Standard
- 31. Standard deviation and coefficient of variation – measures of variation The standard deviation is the average
- 32. Application of coefficient of variation, CV With the following information about investment A: Can we say
- 33. Application of coefficient of variation (continued) With the coefficient of variation we can analyze the relative
- 34. Class quizz What is the median? What does the Range measure? What does IQR measure? How
- 36. Скачать презентацию
Average distance to the mean:
Standard deviation
Most commonly used measure
Average distance to the mean:
Standard deviation
Most commonly used measure
Using Microsoft Excel
Descriptive Statistics can be obtained from Microsoft® Excel
Select:
data /
Using Microsoft Excel
Descriptive Statistics can be obtained from Microsoft® Excel
Select:
data /
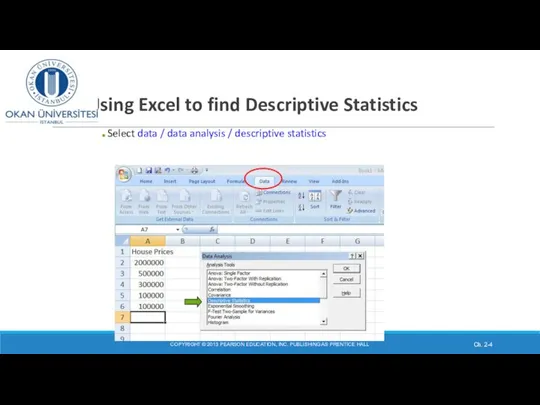
Using Excel to find Descriptive Statistics
COPYRIGHT © 2013 PEARSON EDUCATION, INC.
Using Excel to find Descriptive Statistics
COPYRIGHT © 2013 PEARSON EDUCATION, INC.
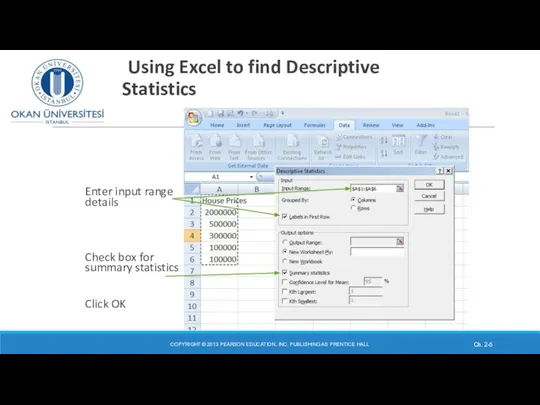
Using Excel to find Descriptive Statistics
Enter input range details
Check box
Using Excel to find Descriptive Statistics
Enter input range details
Check box
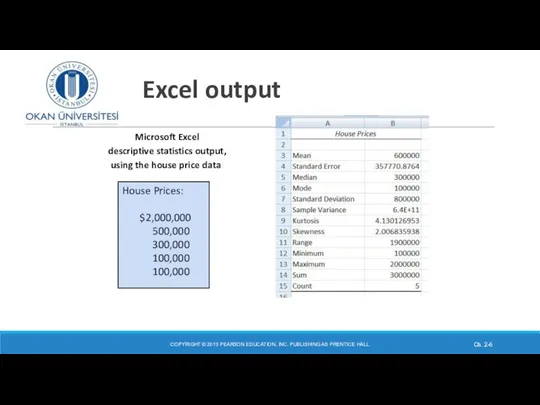
Excel output
COPYRIGHT © 2013 PEARSON EDUCATION, INC. PUBLISHING AS PRENTICE HALL
Ch.
Excel output
COPYRIGHT © 2013 PEARSON EDUCATION, INC. PUBLISHING AS PRENTICE HALL
Ch.
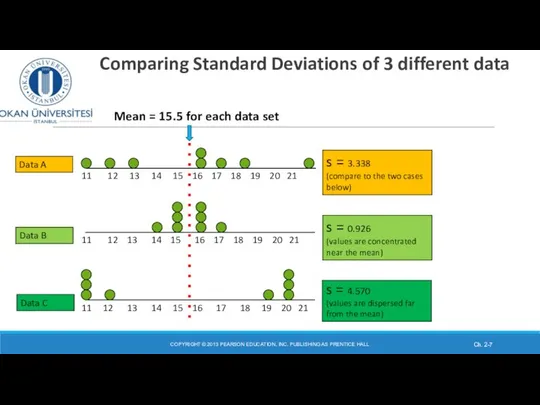
Comparing Standard Deviations of 3 different data sets
COPYRIGHT © 2013
Comparing Standard Deviations of 3 different data sets
COPYRIGHT © 2013
DR SUSANNE HANSEN SARAL
1,1,1,1,1,1,1,1,1,1,1,2,2,2,2,2,2,2,2,3,3,3,3,4,5
1,1,1,1,1,1,1,1,1,1,1,2,2,2,2,2,2,2,2,3,3,3,3,4,120
Comparing Standard Deviations of 2 data sets
Without
DR SUSANNE HANSEN SARAL
1,1,1,1,1,1,1,1,1,1,1,2,2,2,2,2,2,2,2,3,3,3,3,4,5
1,1,1,1,1,1,1,1,1,1,1,2,2,2,2,2,2,2,2,3,3,3,3,4,120
Comparing Standard Deviations of 2 data sets
Without
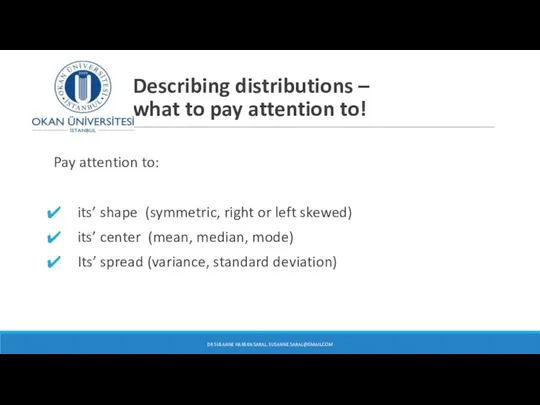
Describing distributions –
what to pay attention to!
Pay attention to:
its’
Describing distributions –
what to pay attention to!
Pay attention to:
its’
Effect of the size of the standard deviation on the
Effect of the size of the standard deviation on the
Effect of the size of the standard deviation on the shape
Effect of the size of the standard deviation on the shape
Examples of applications of the standard deviation
in business
Logistics:
Measurement
Examples of applications of the standard deviation
in business
Logistics:
Measurement
Standard deviation a measure for risk in Finance
DR SUSANNE HANSEN
Standard deviation a measure for risk in Finance
DR SUSANNE HANSEN
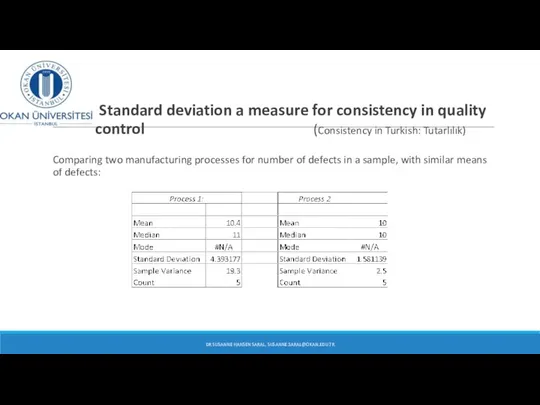
Standard deviation a measure for consistency in quality control (Consistency
Standard deviation a measure for consistency in quality control (Consistency
Measuring standard deviation
DR SUSANNE HANSEN SARAL, SUSANNE.SARAL@OKAN.EDU.TR
Small standard deviation
Low risk/high
Measuring standard deviation
DR SUSANNE HANSEN SARAL, SUSANNE.SARAL@OKAN.EDU.TR
Small standard deviation
Low risk/high
Measuring standard deviation
What does a standard deviation of 0
Measuring standard deviation
What does a standard deviation of 0
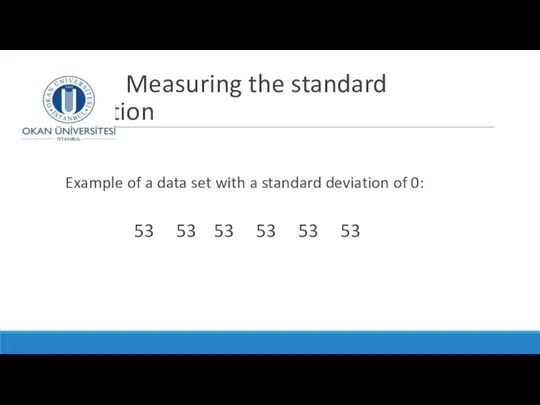
Measuring the standard deviation
Example of a data set with
Measuring the standard deviation
Example of a data set with
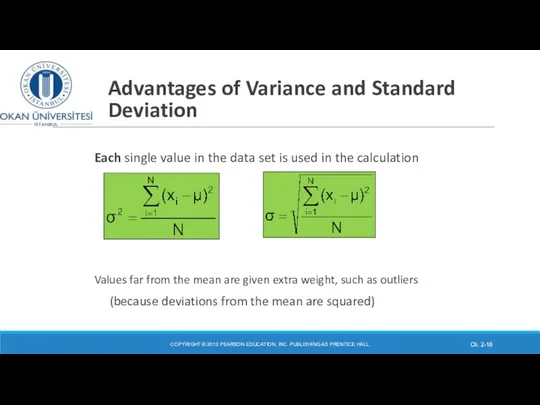
Advantages of Variance and Standard Deviation
Each single value in the data
Advantages of Variance and Standard Deviation
Each single value in the data
Effect of outliers on
Variance and standard deviation
A large outlier
Effect of outliers on
Variance and standard deviation
A large outlier
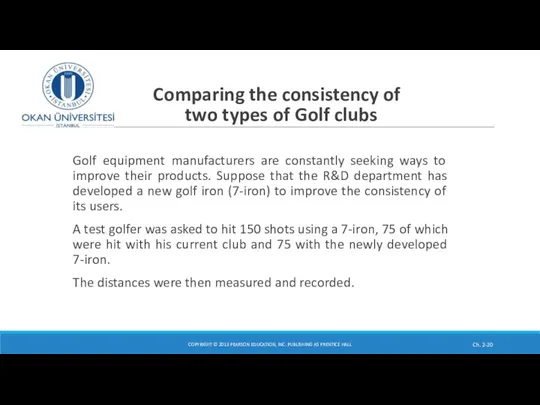
Comparing the consistency of two types of Golf clubs
Golf equipment
Comparing the consistency of two types of Golf clubs
Golf equipment
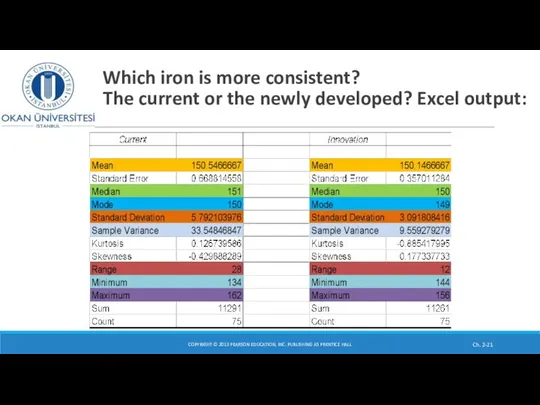
Which iron is more consistent? The current or the newly
Which iron is more consistent? The current or the newly
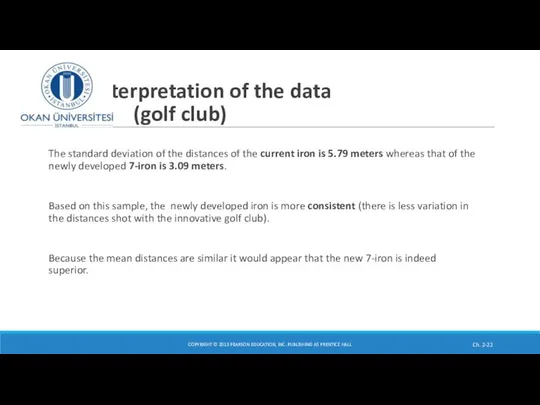
Interpretation of the data (golf club)
The standard deviation of the distances
Interpretation of the data (golf club)
The standard deviation of the distances
Coefficient of Variation (CV)
In situations where the means are almost the
Coefficient of Variation (CV)
In situations where the means are almost the
Coefficient of Variation (CV)
Measures relative variation within a dataset
Always
Coefficient of Variation (CV)
Measures relative variation within a dataset
Always
Coefficient of Variation (CV)
DR SUSANNE HANSEN SARAL, SUSANNE.SARAL@OKAN.EDU.TR
Coefficient of Variation (CV)
DR SUSANNE HANSEN SARAL, SUSANNE.SARAL@OKAN.EDU.TR
Coefficient of Variation (CV)
DR SUSANNE HANSEN SARAL, SUSANNE.SARAL@OKAN.EDU.TR
Coefficient of Variation (CV)
DR SUSANNE HANSEN SARAL, SUSANNE.SARAL@OKAN.EDU.TR
Comparing Coefficient of Variation
Stock A:
Average price last year = $
Comparing Coefficient of Variation
Stock A:
Average price last year = $
Comparing Coefficient of Variation
Stock A:
Average price last year = $
Comparing Coefficient of Variation
Stock A:
Average price last year = $
Comparing Coefficient of Variation, (CV)
The standard deviation of stock A,
Comparing Coefficient of Variation, (CV)
The standard deviation of stock A,
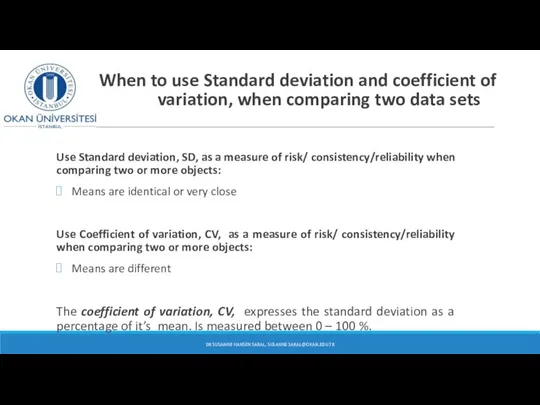
When to use Standard deviation and coefficient of
variation, when
When to use Standard deviation and coefficient of variation, when
Standard deviation and coefficient of variation – measures of variation
The
Standard deviation and coefficient of variation – measures of variation
The
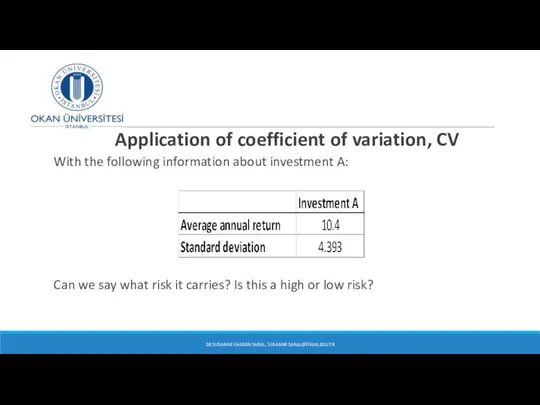
Application of coefficient of variation, CV
With the following information about investment
Application of coefficient of variation, CV
With the following information about investment
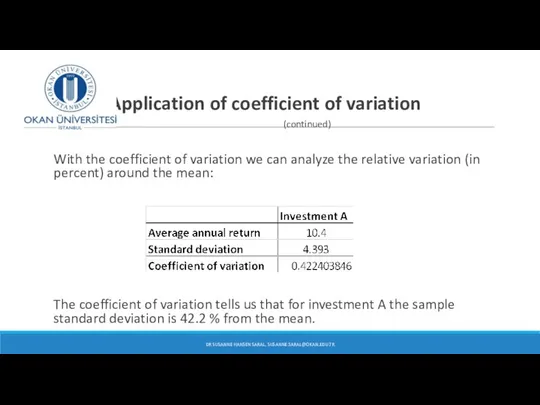
Application of coefficient of variation
(continued)
With the coefficient of variation we
Application of coefficient of variation
(continued)
With the coefficient of variation we
Class quizz
What is the median?
What does the Range measure?
Class quizz
What is the median?
What does the Range measure?
 Исследование функции с помощью производной
 Свойство дроби. Сравнение обыкновенных дробей
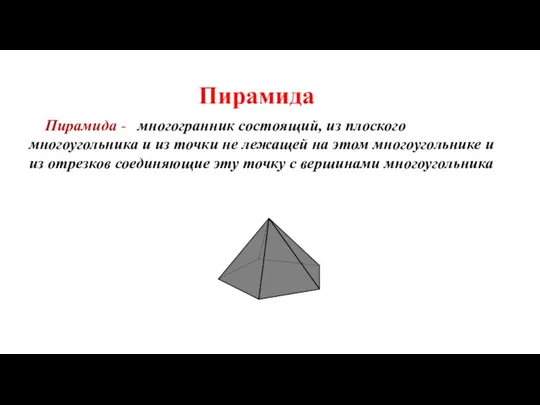 Пирамида
 Признаки деления на 3, на 9
 Геометрия. Углы
 Аттестационная работа. Проектная и исследовательская деятельность на уроках математики
 ГИА - 2012 Открытый банк заданий по математике
 Я вырасту здоровым. Занимательная математика. Вторая младшая группа
 Взаимно простые числа. Признак делимости на пр-е. НОК
 Сравнение дробей. 5 класс
 13 позиция 2016. Стереометрия. Базовый уровень
 Равнобедренный треугольник
 Весёлый счёт, историческая страничка
 Виды треугольников и применение их в жизни
 Неопределенный интеграл
 Что такое задача
 Достижения древних египтян в области математики
 Презентация по математике "математическая игра" - скачать бесплатно
 Фестиваль исследовательских и творческих работ учащихся «Портфолио» МОУ «Менделеевская СОШ» Пифагор - Путь.
  Тригонометрия в окружающем нас мире и в жизни человека
 Тренажёр. Таблица умножения. Юные водители
 Сложение и вычитание векторов
 Математическое обеспечение финансовых решений
 Готовимся к ЕГЭ. Задача 16
 Презентация по математике "Решение задач по классической формуле для подсчета вероятностей" - скачать бесплатно
 Использование параллелограмма в жизни
 Решение уравнений. 6 класс
 Свойства логарифмов. Решение примеров на свойства логарифмов и основное логарифмическое тождество