Ecg interpretations. How to analyze a rhythm. Normal sinus rhythm. Heart arrhythmias. Diagnosing a myocardial infarction
- Ecg interpretations. How to analyze a rhythm. Normal sinus rhythm. Heart arrhythmias. Diagnosing a myocardial infarction

Содержание
- 2. Course Objectives To recognize the normal rhythm of the heart - “Normal Sinus Rhythm.” To recognize
- 3. Learning Modules ECG Basics How to Analyze a Rhythm Normal Sinus Rhythm Heart Arrhythmias Diagnosing a
- 4. Normal Impulse Conduction Sinoatrial node AV node Bundle of His Bundle Branches Purkinje fibers
- 5. Impulse Conduction & the ECG Sinoatrial node AV node Bundle of His Bundle Branches Purkinje fibers
- 6. The “PQRST” P wave - Atrial depolarization T wave - Ventricular repolarization QRS - Ventricular depolarization
- 7. The PR Interval Atrial depolarization + delay in AV junction (AV node/Bundle of His) (delay allows
- 8. Pacemakers of the Heart SA Node - Dominant pacemaker with an intrinsic rate of 60 -
- 9. The ECG Paper Horizontally One small box - 0.04 s One large box - 0.20 s
- 10. The ECG Paper (cont) Every 3 seconds (15 large boxes) is marked by a vertical line.
- 11. ECG Rhythm Interpretation Really Very Easy How to Analyze a Rhythm
- 12. Rhythm Analysis Step 1: Calculate rate. Step 2: Determine regularity. Step 3: Assess the P waves.
- 13. Step 1: Calculate Rate Option 1 Count the # of R waves in a 6 second
- 14. Step 1: Calculate Rate Option 2 Find a R wave that lands on a bold line.
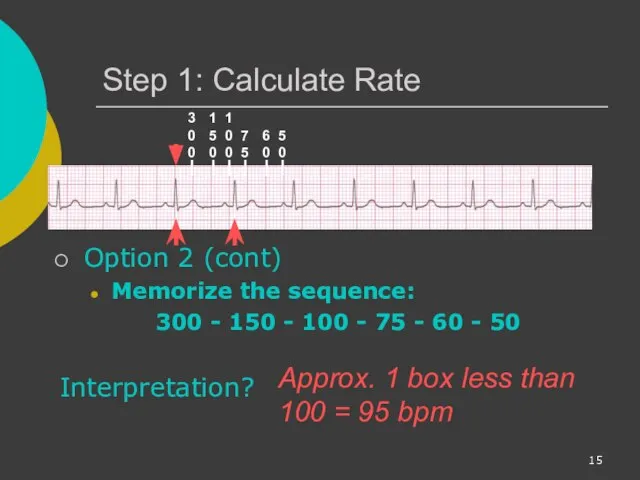
- 15. Step 1: Calculate Rate Option 2 (cont) Memorize the sequence: 300 - 150 - 100 -
- 16. Step 2: Determine regularity Look at the R-R distances (using a caliper or markings on a
- 17. Step 3: Assess the P waves Are there P waves? Do the P waves all look
- 18. Step 4: Determine PR interval Normal: 0.12 - 0.20 seconds. (3 - 5 boxes) Interpretation? 0.12
- 19. Step 5: QRS duration Normal: 0.04 - 0.12 seconds. (1 - 3 boxes) Interpretation? 0.08 seconds
- 20. Rhythm Summary Rate 90-95 bpm Regularity regular P waves normal PR interval 0.12 s QRS duration
- 21. NSR Parameters Rate 60 - 100 bpm Regularity regular P waves normal PR interval 0.12 -
- 22. Arrhythmia Formation Arrhythmias can arise from problems in the: Sinus node Atrial cells AV junction Ventricular
- 23. SA Node Problems The SA Node can: fire too slow fire too fast Sinus Bradycardia Sinus
- 24. Atrial Cell Problems Atrial cells can: fire occasionally from a focus fire continuously due to a
- 25. Atrial Cell Problems Atrial cells can also: • fire continuously from multiple foci or fire continuously
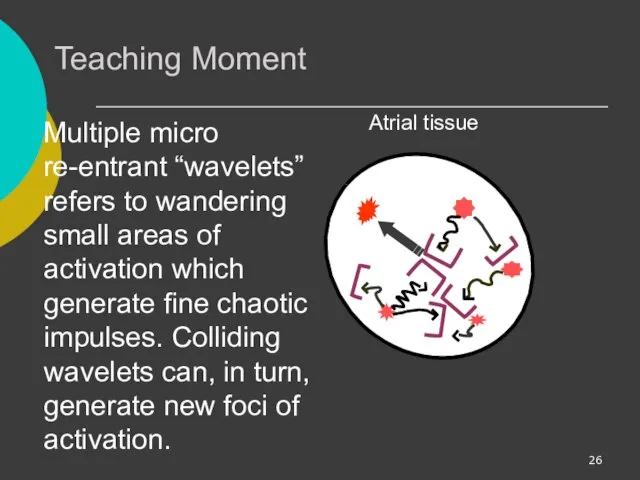
- 26. Teaching Moment Multiple micro re-entrant “wavelets” refers to wandering small areas of activation which generate fine
- 27. AV Junctional Problems The AV junction can: fire continuously due to a looping re-entrant circuit block
- 28. Ventricular Cell Problems Ventricular cells can: fire occasionally from 1 or more foci fire continuously from
- 29. Arrhythmias Sinus Rhythms Premature Beats Supraventricular Arrhythmias Ventricular Arrhythmias AV Junctional Blocks
- 30. Sinus Rhythms Sinus Bradycardia Sinus Tachycardia Sinus Arrest Normal Sinus Rhythm
- 31. Rhythm #1 30 bpm Rate? Regularity? regular normal 0.10 s P waves? PR interval? 0.12 s
- 32. Sinus Bradycardia Deviation from NSR - Rate
- 33. Sinus Bradycardia Etiology: SA node is depolarizing slower than normal, impulse is conducted normally (i.e. normal
- 34. Rhythm #2 130 bpm Rate? Regularity? regular normal 0.08 s P waves? PR interval? 0.16 s
- 35. Sinus Tachycardia Deviation from NSR - Rate > 100 bpm
- 36. Sinus Tachycardia Etiology: SA node is depolarizing faster than normal, impulse is conducted normally. Remember: sinus
- 37. Sinus Arrest Etiology: SA node fails to depolarize and no compensatory mechanisms take over Sinus arrest
- 38. Premature Beats Premature Atrial Contractions (PACs) Premature Ventricular Contractions (PVCs)
- 39. Rhythm #3 70 bpm Rate? Regularity? occasionally irreg. 2/7 different contour 0.08 s P waves? PR
- 40. Premature Atrial Contractions Deviation from NSR These ectopic beats originate in the atria (but not in
- 41. Premature Atrial Contractions Etiology: Excitation of an atrial cell forms an impulse that is then conducted
- 42. Teaching Moment When an impulse originates anywhere in the atria (SA node, atrial cells, AV node,
- 43. Rhythm #4 60 bpm Rate? Regularity? occasionally irreg. none for 7th QRS 0.08 s (7th wide)
- 44. PVCs Deviation from NSR Ectopic beats originate in the ventricles resulting in wide and bizarre QRS
- 45. PVCs Etiology: One or more ventricular cells are depolarizing and the impulses are abnormally conducting through
- 46. Teaching Moment When an impulse originates in a ventricle, conduction through the ventricles will be inefficient
- 47. Ventricular Conduction Normal Signal moves rapidly through the ventricles Abnormal Signal moves slowly through the ventricles
- 48. Supraventricular Arrhythmias Atrial Fibrillation Atrial Flutter Paroxysmal Supra Ventricular Tachycardia (PSVT)
- 49. Rhythm #5 100 bpm Rate? Regularity? irregularly irregular none 0.06 s P waves? PR interval? none
- 50. Atrial Fibrillation Deviation from NSR No organized atrial depolarization, so no normal P waves (impulses are
- 51. Atrial Fibrillation Etiology: due to multiple re-entrant wavelets conducted between the R & L atria and
- 52. Rhythm #6 70 bpm Rate? Regularity? regular flutter waves 0.06 s P waves? PR interval? none
- 53. Atrial Flutter Deviation from NSR No P waves. Instead flutter waves (note “sawtooth” pattern) are formed
- 54. Atrial Flutter Etiology: Reentrant pathway in the right atrium with every 2nd, 3rd or 4th impulse
- 55. Rhythm #7 74 ?148 bpm Rate? Regularity? Regular ? regular Normal ? none 0.08 s P
- 56. PSVT: Paroxysmal Supra Ventricular Tachycardia Deviation from NSR The heart rate suddenly speeds up, often triggered
- 57. AV Nodal Blocks 1st Degree AV Block 2nd Degree AV Block, Type I 2nd Degree AV
- 58. Rhythm #10 60 bpm Rate? Regularity? regular normal 0.08 s P waves? PR interval? 0.36 s
- 59. 1st Degree AV Block Deviation from NSR PR Interval > 0.20 s
- 60. 1st Degree AV Block Etiology: Prolonged conduction delay in the AV node or Bundle of His.
- 61. Rhythm #11 50 bpm Rate? Regularity? regularly irregular nl, but 4th no QRS 0.08 s P
- 62. 2nd Degree AV Block, Type I Deviation from NSR PR interval progressively lengthens, then the impulse
- 63. 2nd Degree AV Block, Type I Etiology: Each successive atrial impulse encounters a longer and longer
- 64. Rhythm #12 40 bpm Rate? Regularity? regular nl, 2 of 3 no QRS 0.08 s P
- 65. 2nd Degree AV Block, Type II Deviation from NSR Occasional P waves are completely blocked (P
- 66. Rhythm #13 40 bpm Rate? Regularity? regular no relation to QRS wide (> 0.12 s) P
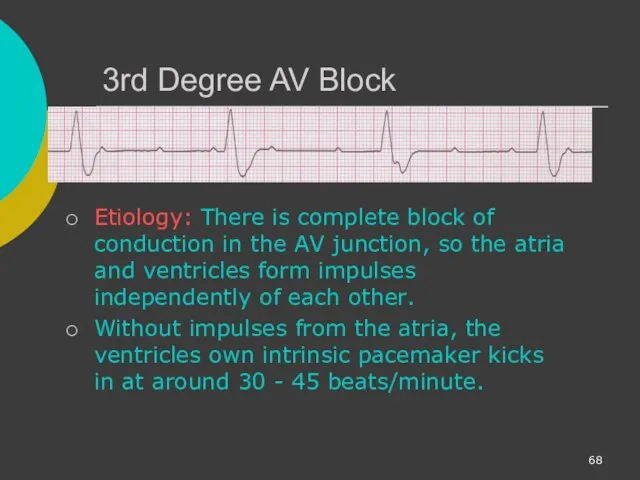
- 67. 3rd Degree AV Block Deviation from NSR The P waves are completely blocked in the AV
- 68. 3rd Degree AV Block Etiology: There is complete block of conduction in the AV junction, so
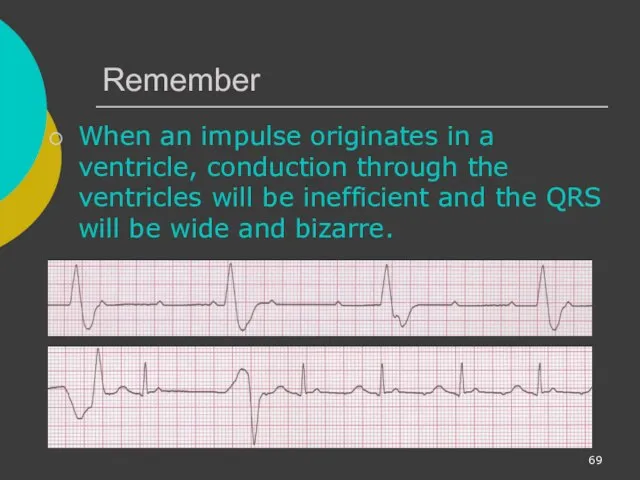
- 69. Remember When an impulse originates in a ventricle, conduction through the ventricles will be inefficient and
- 70. Ventricular Fibrillation Rhythm: irregular-coarse or fine, wave form varies in size and shape Fires continuously from
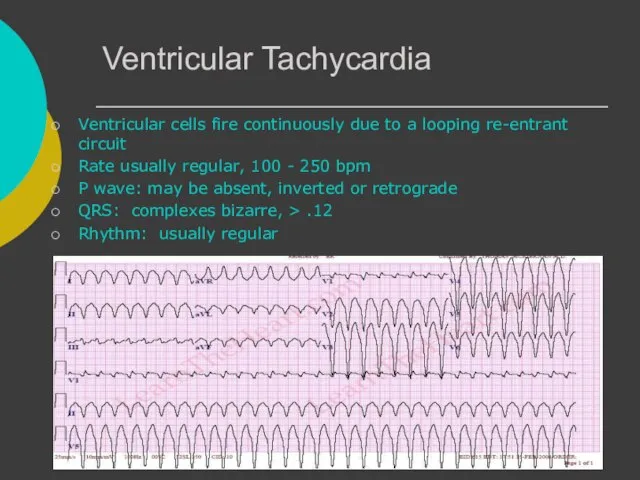
- 71. Ventricular Tachycardia Ventricular cells fire continuously due to a looping re-entrant circuit Rate usually regular, 100
- 72. Asystole Ventricular standstill, no electrical activity, no cardiac output – no pulse! Cardiac arrest, may follow
- 73. IdioVentricular Rhythm Escape rhythm (safety mechanism) to prevent ventricular standstill HIS/purkinje system takes over as the
- 74. Diagnosing a MI To diagnose a myocardial infarction you need to go beyond looking at a
- 75. The 12-Lead ECG The 12-Lead ECG sees the heart from 12 different views. Therefore, the 12-Lead
- 76. The 12-Leads The 12-leads include: 3 Limb leads (I, II, III) 3 Augmented leads (aVR, aVL,
- 77. Views of the Heart Some leads get a good view of the: Anterior portion of the
- 78. ST Elevation One way to diagnose an acute MI is to look for elevation of the
- 79. ST Elevation (cont) Elevation of the ST segment (greater than 1 small box) in 2 leads
- 80. Anterior View of the Heart The anterior portion of the heart is best viewed using leads
- 81. Anterior Myocardial Infarction If you see changes in leads V1 - V4 that are consistent with
- 82. Putting it all Together Do you think this person is having a myocardial infarction. If so,
- 83. Interpretation Yes, this person is having an acute anterior wall myocardial infarction.
- 84. Other MI Locations Now that you know where to look for an anterior wall myocardial infarction
- 85. Views of the Heart Some leads get a good view of the: Anterior portion of the
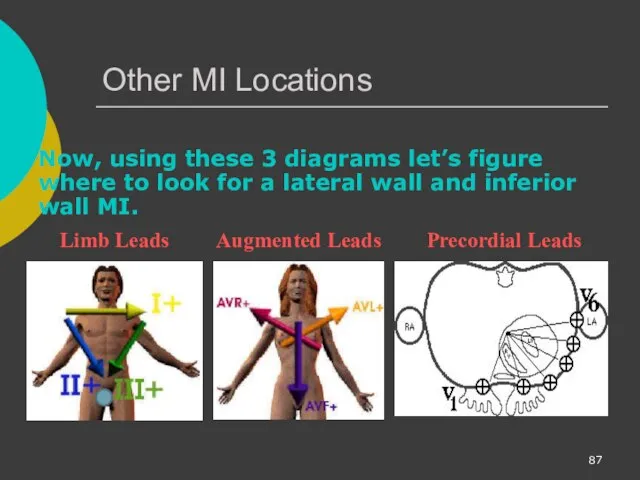
- 86. Other MI Locations Second, remember that the 12-leads of the ECG look at different portions of
- 87. Other MI Locations Now, using these 3 diagrams let’s figure where to look for a lateral
- 88. Anterior MI Remember the anterior portion of the heart is best viewed using leads V1- V4.
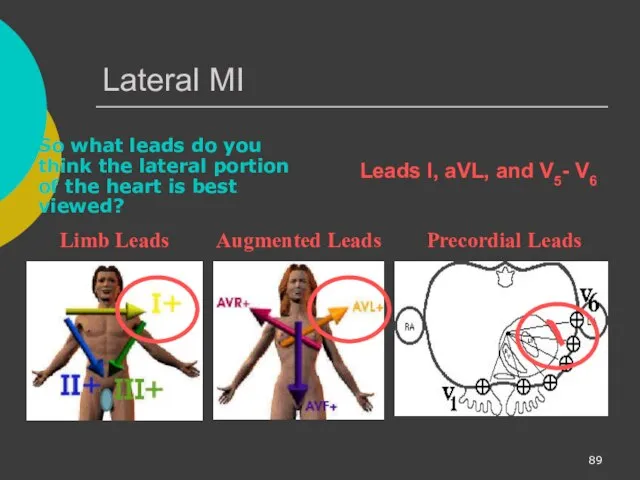
- 89. Lateral MI So what leads do you think the lateral portion of the heart is best
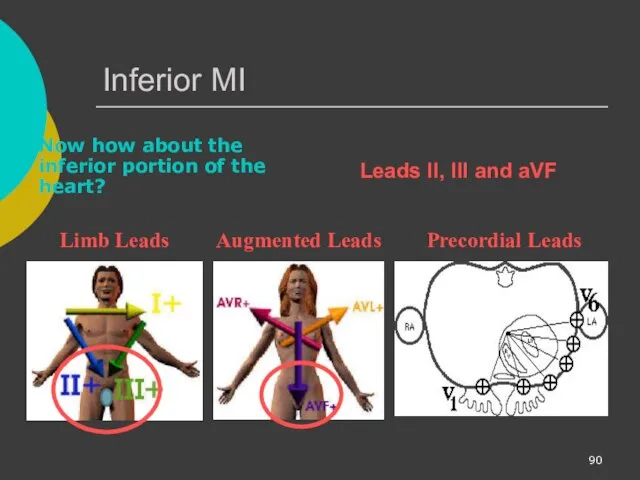
- 90. Inferior MI Now how about the inferior portion of the heart? Limb Leads Augmented Leads Precordial
- 91. Putting it all Together Now, where do you think this person is having a myocardial infarction?
- 92. Inferior Wall MI This is an inferior MI. Note the ST elevation in leads II, III
- 93. Putting it all Together How about now?
- 94. Anterolateral MI This person’s MI involves both the anterior wall (V2-V4) and the lateral wall (V5-V6,
- 95. Reading 12-Lead ECGs The best way to read 12-lead ECGs is to develop a step-by-step approach
- 96. Rate Rhythm Axis Intervals Hypertrophy Infarct In Module II you learned how to calculate the rate.
- 98. Скачать презентацию

Course Objectives
To recognize the normal rhythm of the heart - “Normal
Course Objectives
To recognize the normal rhythm of the heart - “Normal
Learning Modules
ECG Basics
How to Analyze a Rhythm
Normal Sinus Rhythm
Heart Arrhythmias
Diagnosing a
Learning Modules
ECG Basics
How to Analyze a Rhythm
Normal Sinus Rhythm
Heart Arrhythmias
Diagnosing a
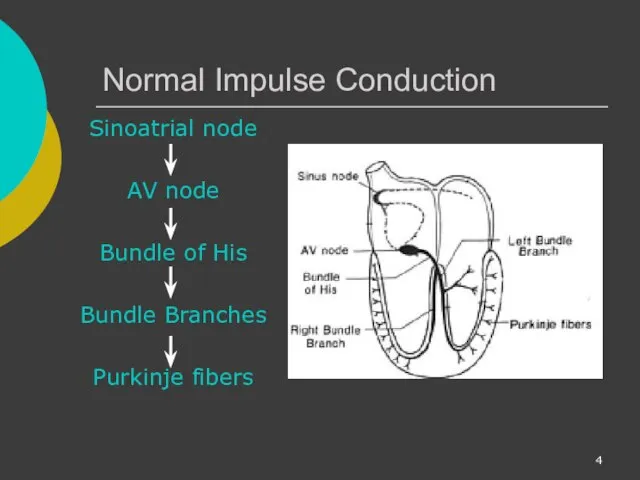
Normal Impulse Conduction
Sinoatrial node
AV node
Bundle of His
Bundle Branches
Purkinje fibers
Normal Impulse Conduction
Sinoatrial node
AV node
Bundle of His
Bundle Branches
Purkinje fibers
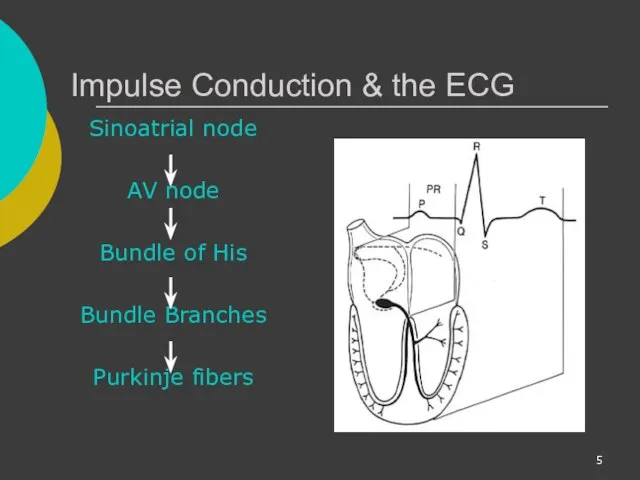
Impulse Conduction & the ECG
Sinoatrial node
AV node
Bundle of His
Bundle Branches
Purkinje fibers
Impulse Conduction & the ECG
Sinoatrial node
AV node
Bundle of His
Bundle Branches
Purkinje fibers
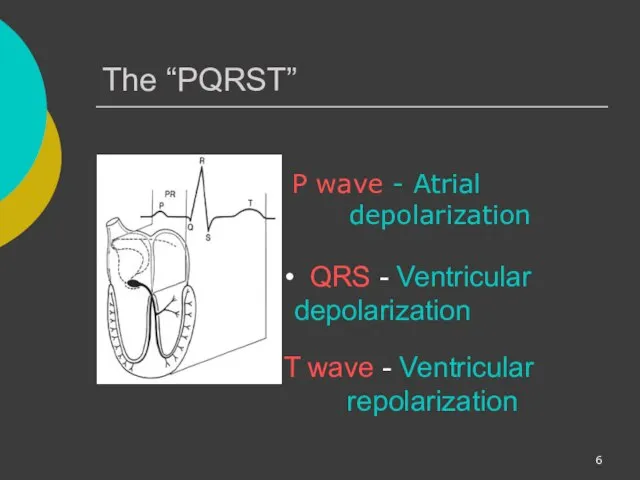
The “PQRST”
P wave - Atrial depolarization
T wave - Ventricular repolarization
The “PQRST”
P wave - Atrial depolarization
T wave - Ventricular repolarization

The PR Interval
Atrial depolarization
+
delay in AV junction
(AV node/Bundle of
The PR Interval
Atrial depolarization
+
delay in AV junction
(AV node/Bundle of
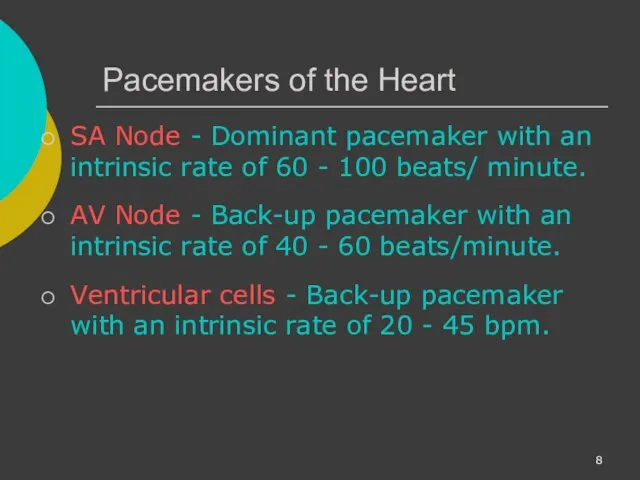
Pacemakers of the Heart
SA Node - Dominant pacemaker with an intrinsic
Pacemakers of the Heart
SA Node - Dominant pacemaker with an intrinsic
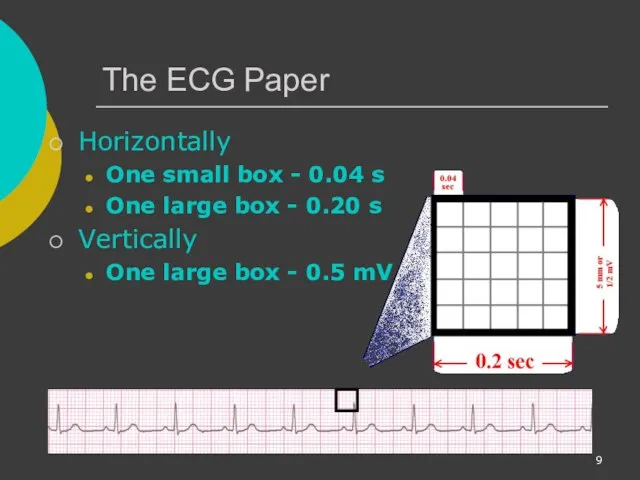
The ECG Paper
Horizontally
One small box - 0.04 s
One large box -
The ECG Paper
Horizontally
One small box - 0.04 s
One large box -
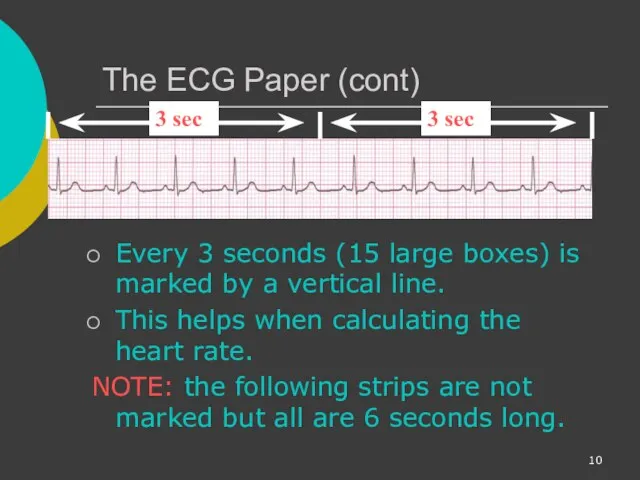
The ECG Paper (cont)
Every 3 seconds (15 large boxes) is marked
The ECG Paper (cont)
Every 3 seconds (15 large boxes) is marked
ECG Rhythm Interpretation
Really Very Easy
How to Analyze a Rhythm
ECG Rhythm Interpretation
Really Very Easy
How to Analyze a Rhythm

Rhythm Analysis
Step 1: Calculate rate.
Step 2: Determine regularity.
Step 3: Assess the P waves.
Step 4: Determine
Rhythm Analysis
Step 1: Calculate rate.
Step 2: Determine regularity.
Step 3: Assess the P waves.
Step 4: Determine
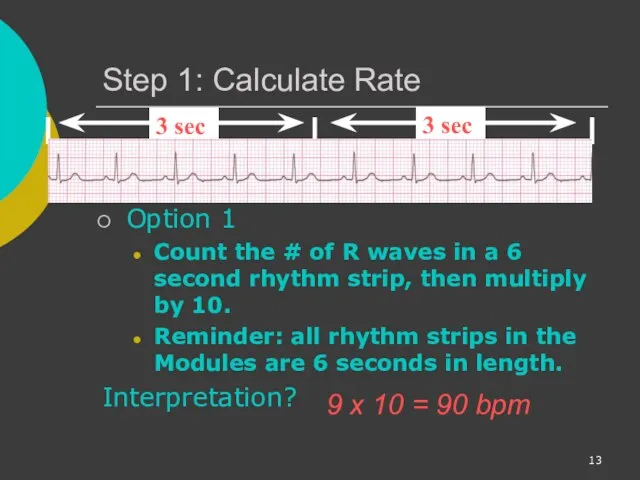
Step 1: Calculate Rate
Option 1
Count the # of R waves in
Step 1: Calculate Rate
Option 1
Count the # of R waves in

Step 1: Calculate Rate
Option 2
Find a R wave that lands
Step 1: Calculate Rate
Option 2
Find a R wave that lands
Step 1: Calculate Rate
Option 2 (cont)
Memorize the sequence:
300 - 150
Step 1: Calculate Rate
Option 2 (cont)
Memorize the sequence:
300 - 150
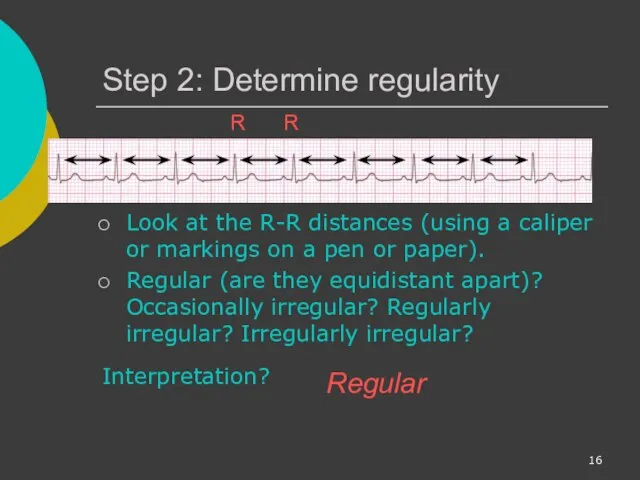
Step 2: Determine regularity
Look at the R-R distances (using a caliper
Step 2: Determine regularity
Look at the R-R distances (using a caliper

Step 3: Assess the P waves
Are there P waves?
Do the P
Step 3: Assess the P waves
Are there P waves?
Do the P
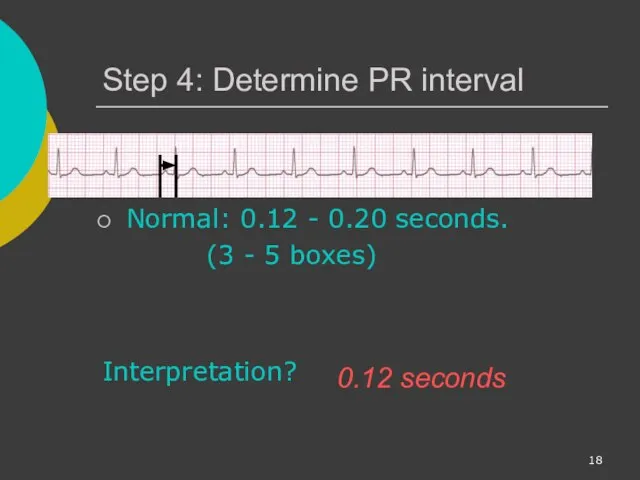
Step 4: Determine PR interval
Normal: 0.12 - 0.20 seconds.
(3 -
Step 4: Determine PR interval
Normal: 0.12 - 0.20 seconds.
(3 -

Step 5: QRS duration
Normal: 0.04 - 0.12 seconds.
(1 - 3
Step 5: QRS duration
Normal: 0.04 - 0.12 seconds.
(1 - 3

Rhythm Summary
Rate 90-95 bpm
Regularity regular
P waves normal
PR interval 0.12 s
QRS duration 0.08 s
Interpretation?
Normal Sinus Rhythm
Rhythm Summary
Rate 90-95 bpm
Regularity regular
P waves normal
PR interval 0.12 s
QRS duration 0.08 s
Interpretation?
Normal Sinus Rhythm
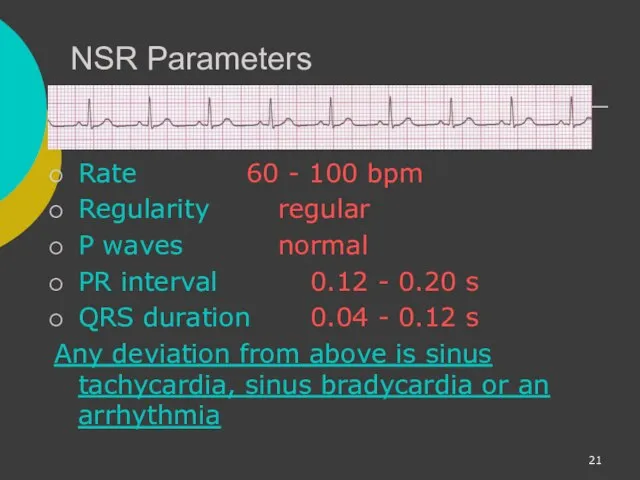
NSR Parameters
Rate 60 - 100 bpm
Regularity regular
P waves normal
PR interval 0.12 - 0.20 s
QRS duration 0.04
NSR Parameters
Rate 60 - 100 bpm
Regularity regular
P waves normal
PR interval 0.12 - 0.20 s
QRS duration 0.04
Arrhythmia Formation
Arrhythmias can arise from problems in the:
Sinus node
Atrial cells
AV junction
Ventricular
Arrhythmia Formation
Arrhythmias can arise from problems in the:
Sinus node
Atrial cells
AV junction
Ventricular
SA Node Problems
The SA Node can:
fire too slow
fire too fast
Sinus Bradycardia
Sinus
SA Node Problems
The SA Node can:
fire too slow
fire too fast
Sinus Bradycardia
Sinus
Atrial Cell Problems
Atrial cells can:
fire occasionally from a focus
fire continuously
Atrial Cell Problems
Atrial cells can:
fire occasionally from a focus
fire continuously

Atrial Cell Problems
Atrial cells can also:
• fire continuously from multiple foci
Atrial Cell Problems
Atrial cells can also:
• fire continuously from multiple foci
Teaching Moment
Multiple micro re-entrant “wavelets” refers to wandering small areas of
Teaching Moment
Multiple micro re-entrant “wavelets” refers to wandering small areas of
AV Junctional Problems
The AV junction can:
fire continuously due to a looping
AV Junctional Problems
The AV junction can:
fire continuously due to a looping

Ventricular Cell Problems
Ventricular cells can:
fire occasionally from 1 or more foci
fire
Ventricular Cell Problems
Ventricular cells can:
fire occasionally from 1 or more foci
fire

Arrhythmias
Sinus Rhythms
Premature Beats
Supraventricular Arrhythmias
Ventricular Arrhythmias
AV Junctional Blocks
Arrhythmias
Sinus Rhythms
Premature Beats
Supraventricular Arrhythmias
Ventricular Arrhythmias
AV Junctional Blocks

Sinus Rhythms
Sinus Bradycardia
Sinus Tachycardia
Sinus Arrest
Normal Sinus Rhythm
Sinus Rhythms
Sinus Bradycardia
Sinus Tachycardia
Sinus Arrest
Normal Sinus Rhythm
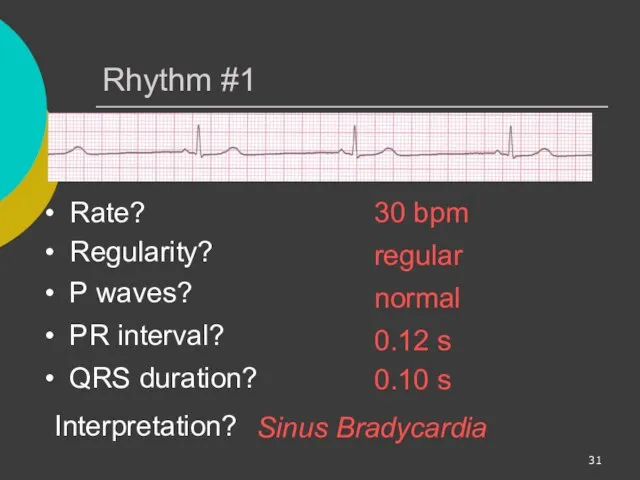
Rhythm #1
30 bpm
Rate?
Regularity?
regular
normal
0.10 s
P waves?
PR interval?
0.12 s
Rhythm #1
30 bpm
Rate?
Regularity?
regular
normal
0.10 s
P waves?
PR interval?
0.12 s

Sinus Bradycardia
Deviation from NSR
- Rate < 60 bpm
Sinus Bradycardia
Deviation from NSR
- Rate < 60 bpm
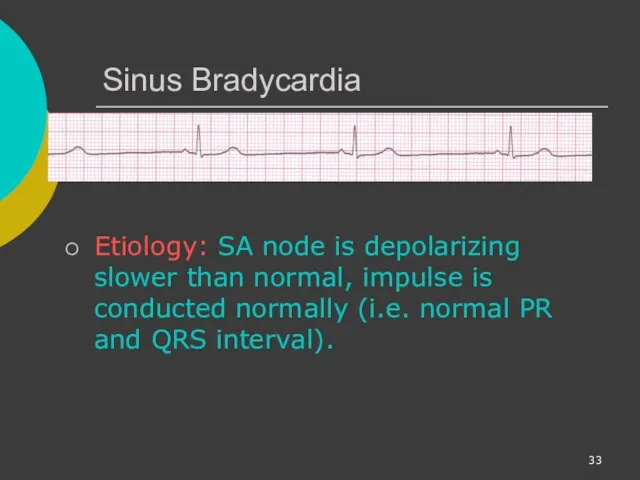
Sinus Bradycardia
Etiology: SA node is depolarizing slower than normal, impulse is
Sinus Bradycardia
Etiology: SA node is depolarizing slower than normal, impulse is
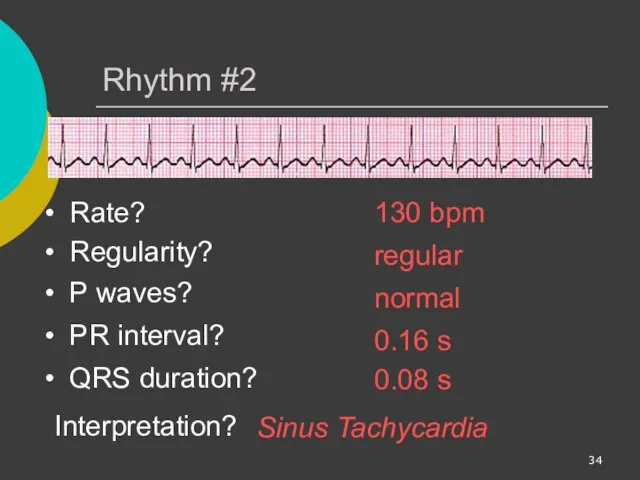
Rhythm #2
130 bpm
Rate?
Regularity?
regular
normal
0.08 s
P waves?
PR interval?
0.16 s
Rhythm #2
130 bpm
Rate?
Regularity?
regular
normal
0.08 s
P waves?
PR interval?
0.16 s
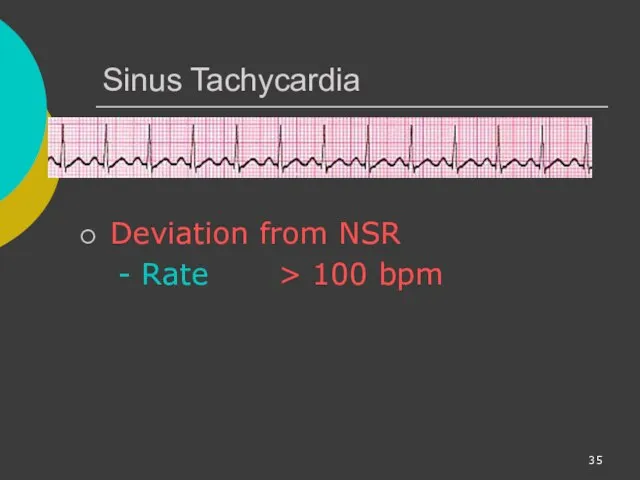
Sinus Tachycardia
Deviation from NSR
- Rate > 100 bpm
Sinus Tachycardia
Deviation from NSR
- Rate > 100 bpm

Sinus Tachycardia
Etiology: SA node is depolarizing faster than normal, impulse is
Sinus Tachycardia
Etiology: SA node is depolarizing faster than normal, impulse is

Sinus Arrest
Etiology: SA node fails to depolarize and no compensatory mechanisms
Sinus Arrest
Etiology: SA node fails to depolarize and no compensatory mechanisms

Premature Beats
Premature Atrial Contractions (PACs)
Premature Ventricular Contractions (PVCs)
Premature Beats
Premature Atrial Contractions (PACs)
Premature Ventricular Contractions (PVCs)
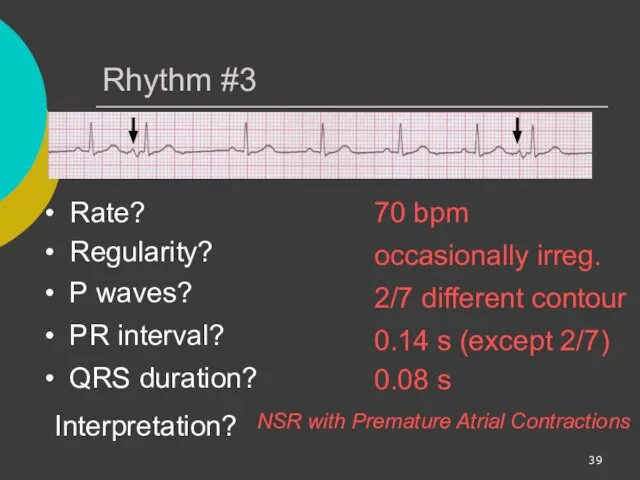
Rhythm #3
70 bpm
Rate?
Regularity?
occasionally irreg.
2/7 different contour
0.08 s
P waves?
Rhythm #3
70 bpm
Rate?
Regularity?
occasionally irreg.
2/7 different contour
0.08 s
P waves?

Premature Atrial Contractions
Deviation from NSR
These ectopic beats originate in the atria
Premature Atrial Contractions
Deviation from NSR
These ectopic beats originate in the atria
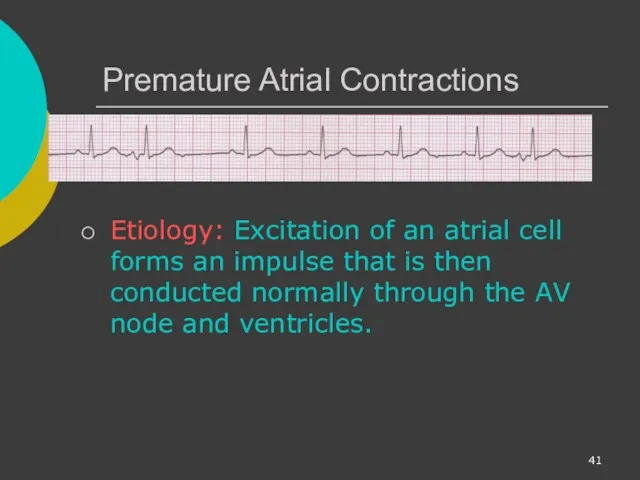
Premature Atrial Contractions
Etiology: Excitation of an atrial cell forms an impulse
Premature Atrial Contractions
Etiology: Excitation of an atrial cell forms an impulse
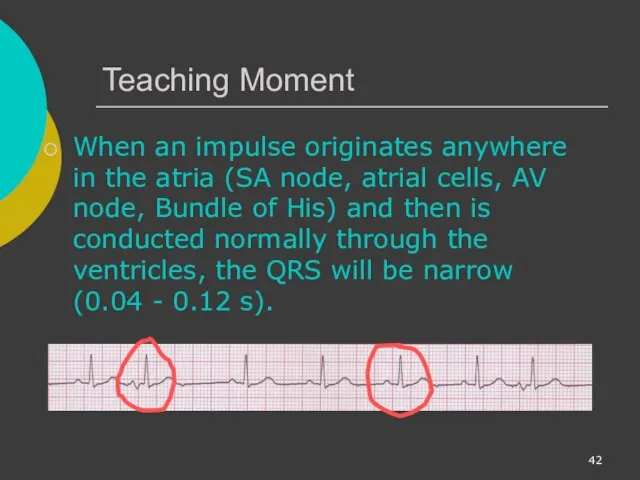
Teaching Moment
When an impulse originates anywhere in the atria (SA node,
Teaching Moment
When an impulse originates anywhere in the atria (SA node,
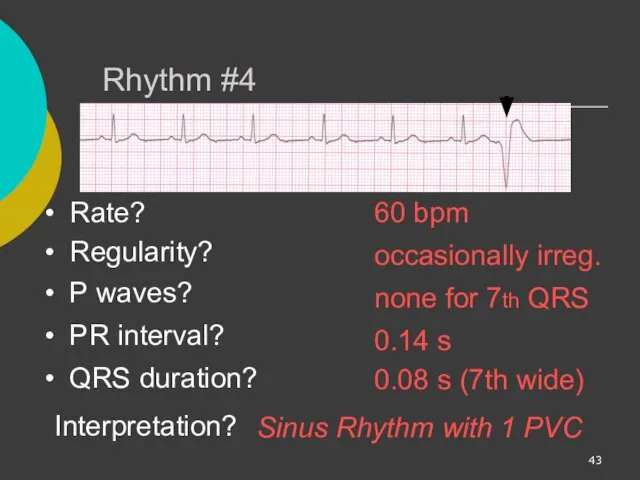
Rhythm #4
60 bpm
Rate?
Regularity?
occasionally irreg.
none for 7th QRS
0.08 s (7th
Rhythm #4
60 bpm
Rate?
Regularity?
occasionally irreg.
none for 7th QRS
0.08 s (7th
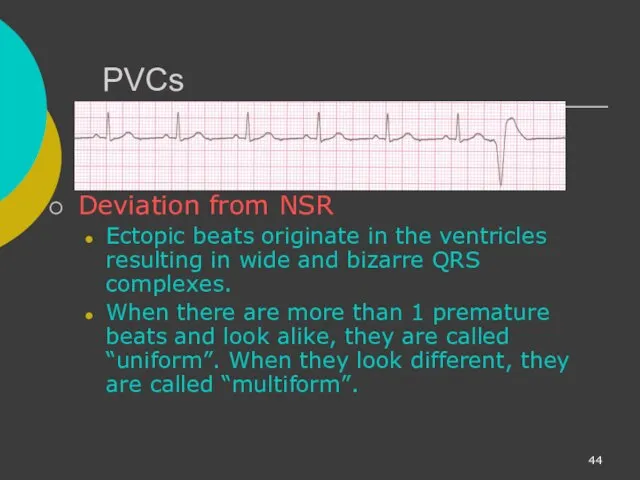
PVCs
Deviation from NSR
Ectopic beats originate in the ventricles resulting in wide
PVCs
Deviation from NSR
Ectopic beats originate in the ventricles resulting in wide

PVCs
Etiology: One or more ventricular cells are depolarizing and the impulses
PVCs
Etiology: One or more ventricular cells are depolarizing and the impulses
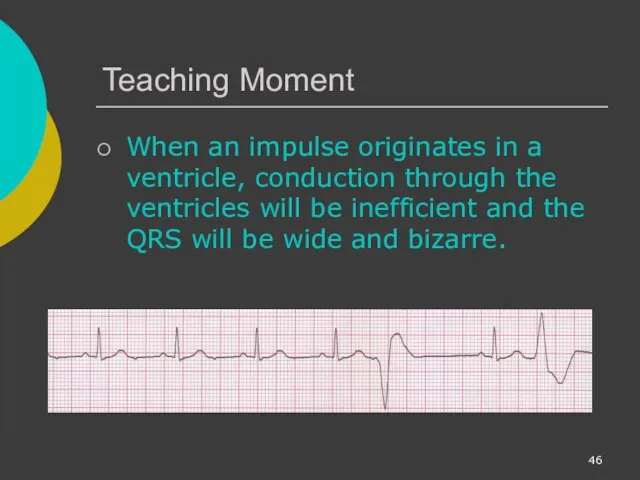
Teaching Moment
When an impulse originates in a ventricle, conduction through the
Teaching Moment
When an impulse originates in a ventricle, conduction through the
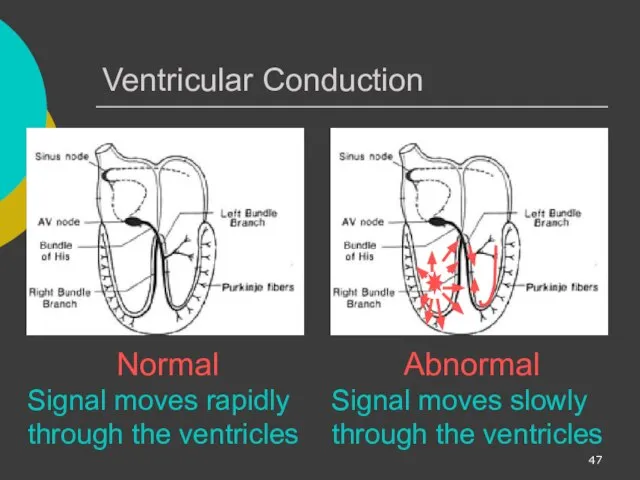
Ventricular Conduction
Normal
Signal moves rapidly through the ventricles
Abnormal
Signal moves slowly through the
Ventricular Conduction
Normal
Signal moves rapidly through the ventricles
Abnormal
Signal moves slowly through the
Supraventricular Arrhythmias
Atrial Fibrillation
Atrial Flutter
Paroxysmal Supra Ventricular Tachycardia (PSVT)
Supraventricular Arrhythmias
Atrial Fibrillation
Atrial Flutter
Paroxysmal Supra Ventricular Tachycardia (PSVT)
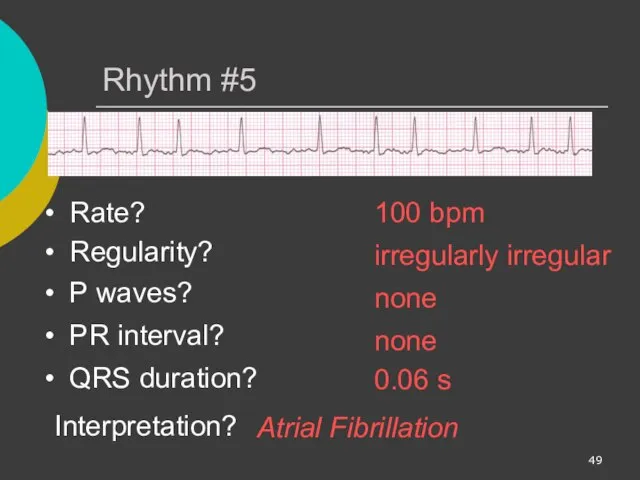
Rhythm #5
100 bpm
Rate?
Regularity?
irregularly irregular
none
0.06 s
P waves?
PR interval?
none
Rhythm #5
100 bpm
Rate?
Regularity?
irregularly irregular
none
0.06 s
P waves?
PR interval?
none

Atrial Fibrillation
Deviation from NSR
No organized atrial depolarization, so no normal P
Atrial Fibrillation
Deviation from NSR
No organized atrial depolarization, so no normal P
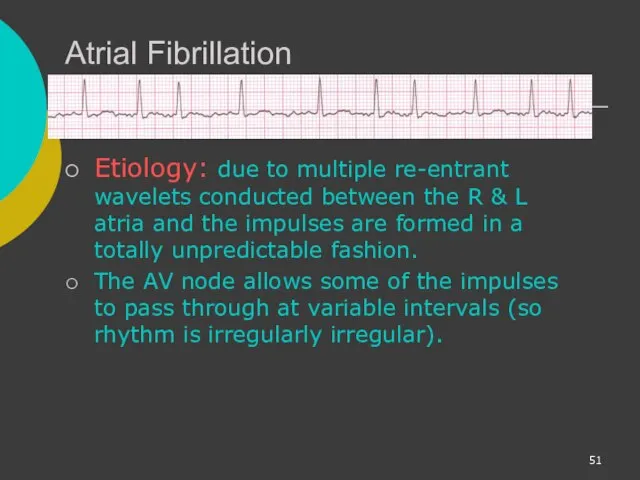
Atrial Fibrillation
Etiology: due to multiple re-entrant wavelets conducted between the R
Atrial Fibrillation
Etiology: due to multiple re-entrant wavelets conducted between the R
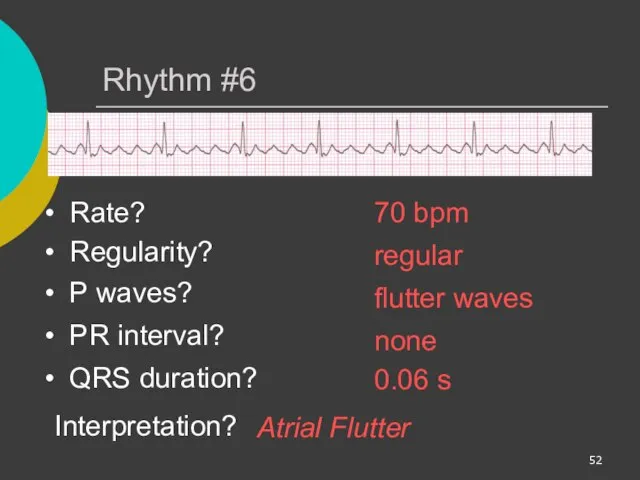
Rhythm #6
70 bpm
Rate?
Regularity?
regular
flutter waves
0.06 s
P waves?
PR interval?
none
Rhythm #6
70 bpm
Rate?
Regularity?
regular
flutter waves
0.06 s
P waves?
PR interval?
none
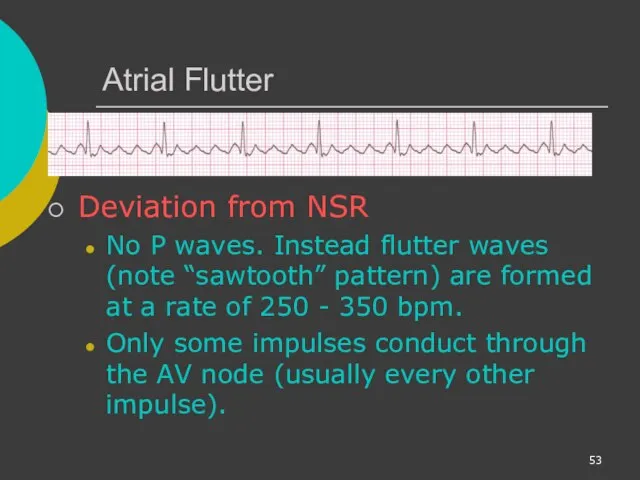
Atrial Flutter
Deviation from NSR
No P waves. Instead flutter waves (note “sawtooth”
Atrial Flutter
Deviation from NSR
No P waves. Instead flutter waves (note “sawtooth”
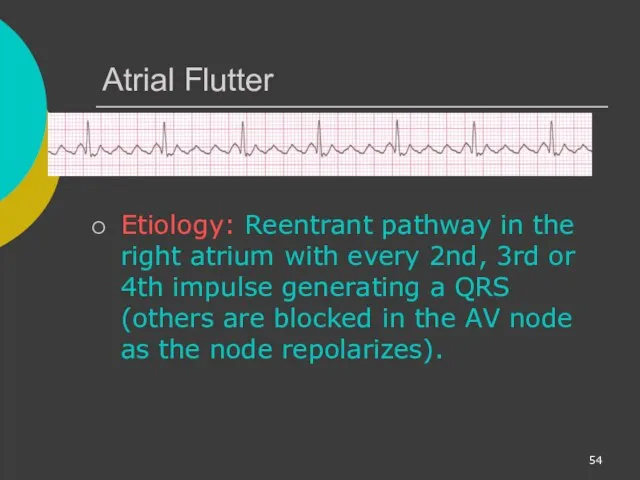
Atrial Flutter
Etiology: Reentrant pathway in the right atrium with every 2nd,
Atrial Flutter
Etiology: Reentrant pathway in the right atrium with every 2nd,
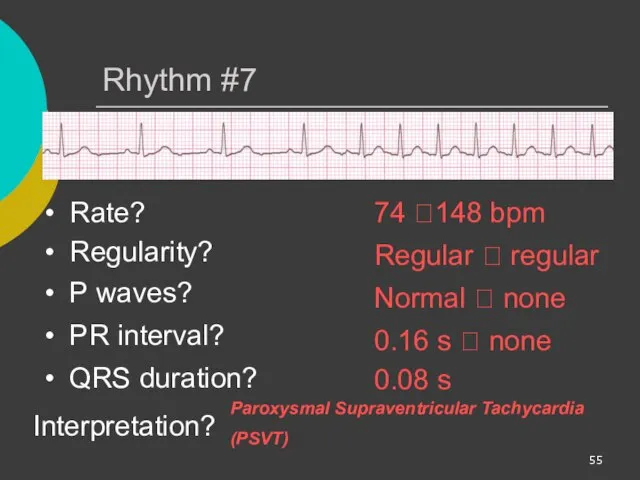
Rhythm #7
74 ?148 bpm
Rate?
Regularity?
Regular ? regular
Normal ? none
0.08 s
Rhythm #7
74 ?148 bpm
Rate?
Regularity?
Regular ? regular
Normal ? none
0.08 s
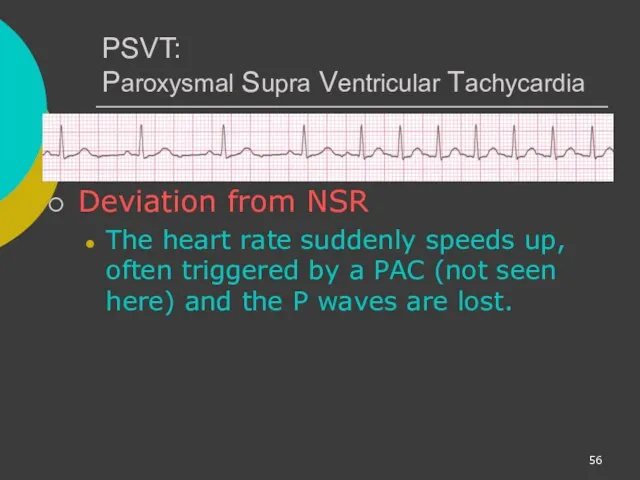
PSVT:
Paroxysmal Supra Ventricular Tachycardia
Deviation from NSR
The heart rate suddenly speeds up,
PSVT:
Paroxysmal Supra Ventricular Tachycardia
Deviation from NSR
The heart rate suddenly speeds up,

AV Nodal Blocks
1st Degree AV Block
2nd Degree AV Block, Type I
2nd
AV Nodal Blocks
1st Degree AV Block
2nd Degree AV Block, Type I
2nd

Rhythm #10
60 bpm
Rate?
Regularity?
regular
normal
0.08 s
P waves?
PR interval?
0.36 s
Rhythm #10
60 bpm
Rate?
Regularity?
regular
normal
0.08 s
P waves?
PR interval?
0.36 s

1st Degree AV Block
Deviation from NSR
PR Interval > 0.20 s
1st Degree AV Block
Deviation from NSR
PR Interval > 0.20 s
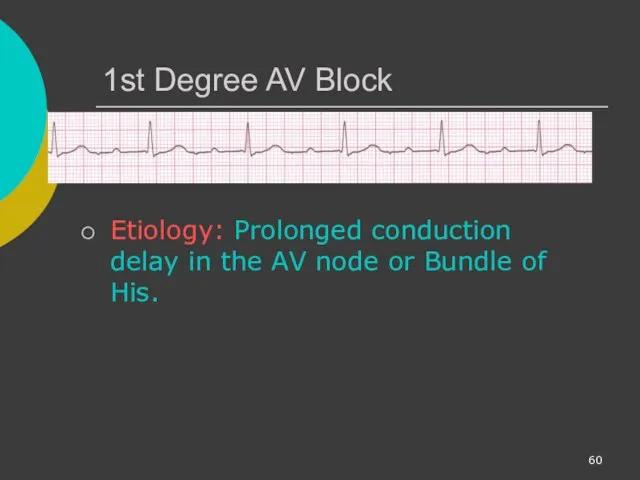
1st Degree AV Block
Etiology: Prolonged conduction delay in the AV node
1st Degree AV Block
Etiology: Prolonged conduction delay in the AV node

Rhythm #11
50 bpm
Rate?
Regularity?
regularly irregular
nl, but 4th no QRS
0.08 s
Rhythm #11
50 bpm
Rate?
Regularity?
regularly irregular
nl, but 4th no QRS
0.08 s
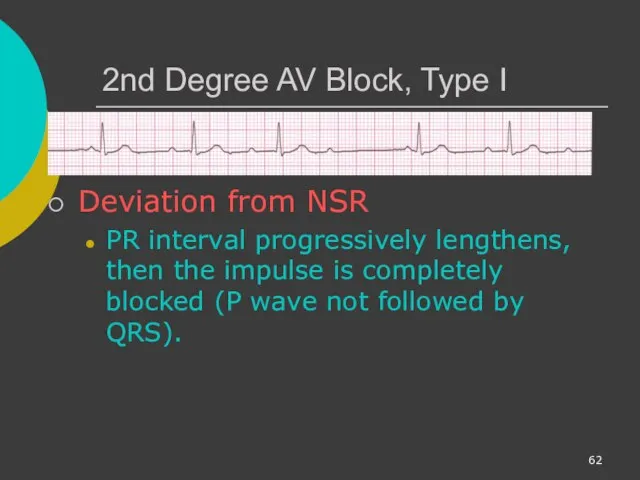
2nd Degree AV Block, Type I
Deviation from NSR
PR interval progressively lengthens,
2nd Degree AV Block, Type I
Deviation from NSR
PR interval progressively lengthens,

2nd Degree AV Block, Type I
Etiology: Each successive atrial impulse encounters
2nd Degree AV Block, Type I
Etiology: Each successive atrial impulse encounters
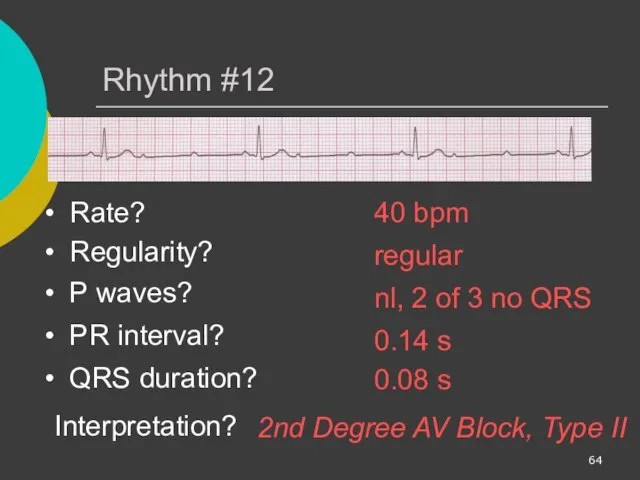
Rhythm #12
40 bpm
Rate?
Regularity?
regular
nl, 2 of 3 no QRS
0.08 s
Rhythm #12
40 bpm
Rate?
Regularity?
regular
nl, 2 of 3 no QRS
0.08 s

2nd Degree AV Block, Type II
Deviation from NSR
Occasional P waves are
2nd Degree AV Block, Type II
Deviation from NSR
Occasional P waves are

Rhythm #13
40 bpm
Rate?
Regularity?
regular
no relation to QRS
wide (> 0.12 s)
Rhythm #13
40 bpm
Rate?
Regularity?
regular
no relation to QRS
wide (> 0.12 s)

3rd Degree AV Block
Deviation from NSR
The P waves are completely blocked
3rd Degree AV Block
Deviation from NSR
The P waves are completely blocked
3rd Degree AV Block
Etiology: There is complete block of conduction in
3rd Degree AV Block
Etiology: There is complete block of conduction in
Remember
When an impulse originates in a ventricle, conduction through the ventricles
Remember
When an impulse originates in a ventricle, conduction through the ventricles

Ventricular Fibrillation
Rhythm: irregular-coarse or fine, wave form varies in size and
Ventricular Fibrillation
Rhythm: irregular-coarse or fine, wave form varies in size and
Ventricular Tachycardia
Ventricular cells fire continuously due to a looping re-entrant circuit
Ventricular Tachycardia
Ventricular cells fire continuously due to a looping re-entrant circuit

Asystole
Ventricular standstill, no electrical activity, no cardiac output – no pulse!
Cardiac
Asystole
Ventricular standstill, no electrical activity, no cardiac output – no pulse!
Cardiac

IdioVentricular Rhythm
Escape rhythm (safety mechanism) to prevent ventricular standstill
HIS/purkinje system takes
IdioVentricular Rhythm
Escape rhythm (safety mechanism) to prevent ventricular standstill
HIS/purkinje system takes

Diagnosing a MI
To diagnose a myocardial infarction you need to go
Diagnosing a MI
To diagnose a myocardial infarction you need to go
The 12-Lead ECG
The 12-Lead ECG sees the heart from 12 different
The 12-Lead ECG
The 12-Lead ECG sees the heart from 12 different
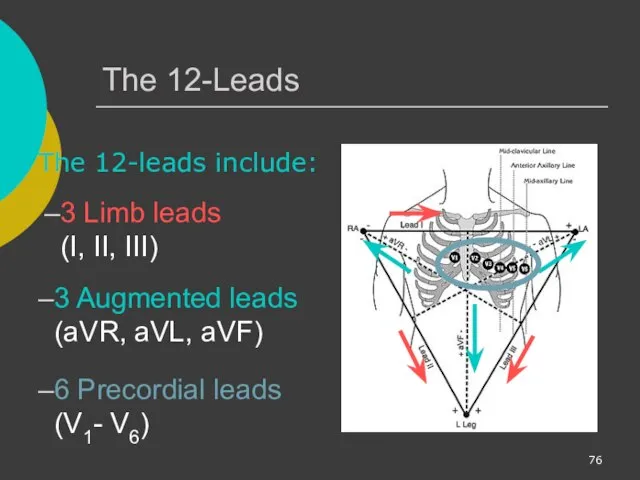
The 12-Leads
The 12-leads include:
3 Limb leads (I, II, III)
3 Augmented leads
The 12-Leads
The 12-leads include:
3 Limb leads (I, II, III)
3 Augmented leads
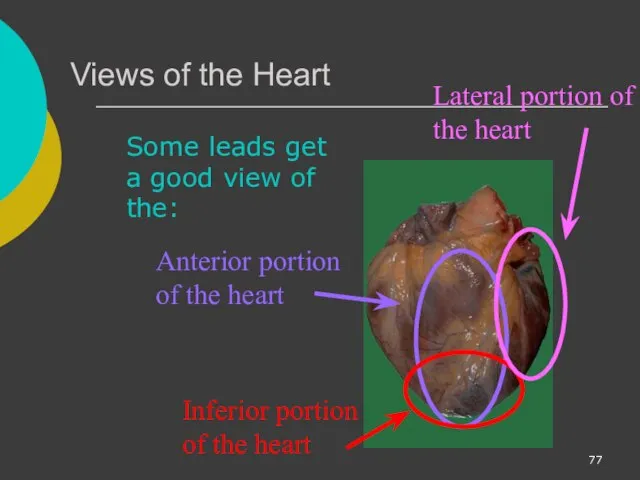
Views of the Heart
Some leads get a good view of the:
Anterior
Views of the Heart
Some leads get a good view of the:
Anterior

ST Elevation
One way to diagnose an acute MI is to look
ST Elevation
One way to diagnose an acute MI is to look

ST Elevation (cont)
Elevation of the ST segment (greater than 1 small
ST Elevation (cont)
Elevation of the ST segment (greater than 1 small
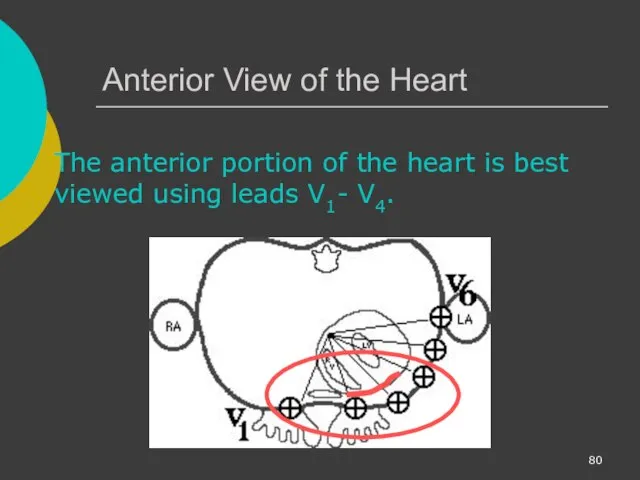
Anterior View of the Heart
The anterior portion of the heart is
Anterior View of the Heart
The anterior portion of the heart is
Anterior Myocardial Infarction
If you see changes in leads V1 - V4
Anterior Myocardial Infarction
If you see changes in leads V1 - V4
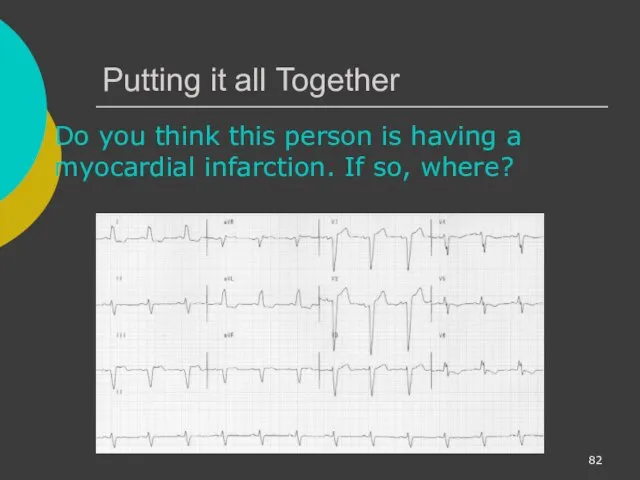
Putting it all Together
Do you think this person is having a
Putting it all Together
Do you think this person is having a
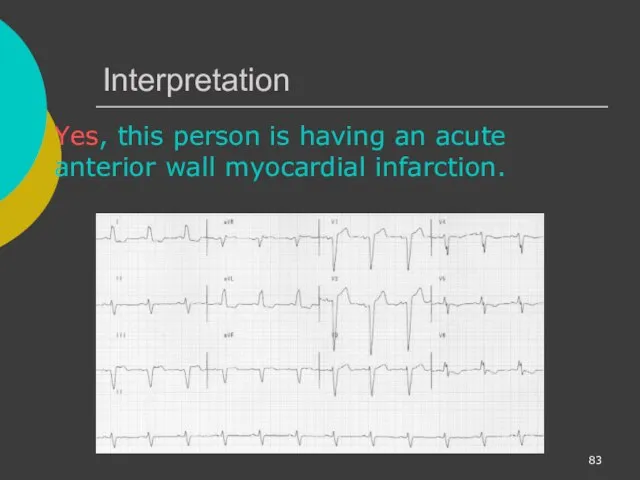
Interpretation
Yes, this person is having an acute anterior wall myocardial infarction.
Interpretation
Yes, this person is having an acute anterior wall myocardial infarction.
Other MI Locations
Now that you know where to look for an
Other MI Locations
Now that you know where to look for an
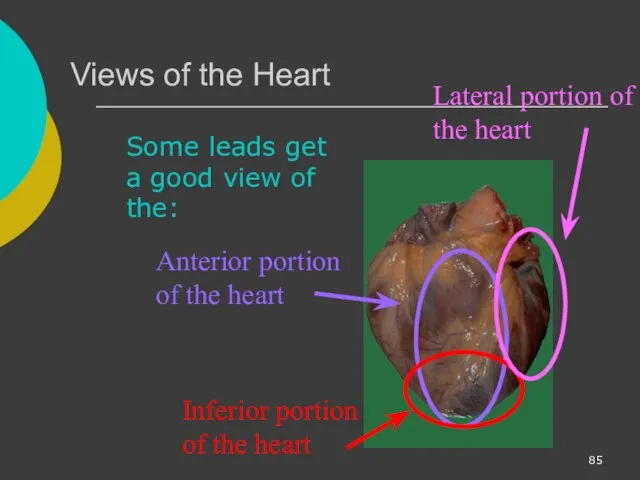
Views of the Heart
Some leads get a good view of the:
Anterior
Views of the Heart
Some leads get a good view of the:
Anterior

Other MI Locations
Second, remember that the 12-leads of the ECG look
Other MI Locations
Second, remember that the 12-leads of the ECG look
Other MI Locations
Now, using these 3 diagrams let’s figure where to
Other MI Locations
Now, using these 3 diagrams let’s figure where to

Anterior MI
Remember the anterior portion of the heart is best viewed
Anterior MI
Remember the anterior portion of the heart is best viewed
Lateral MI
So what leads do you think the lateral portion of
Lateral MI
So what leads do you think the lateral portion of
Inferior MI
Now how about the inferior portion of the heart?
Limb
Inferior MI
Now how about the inferior portion of the heart?
Limb
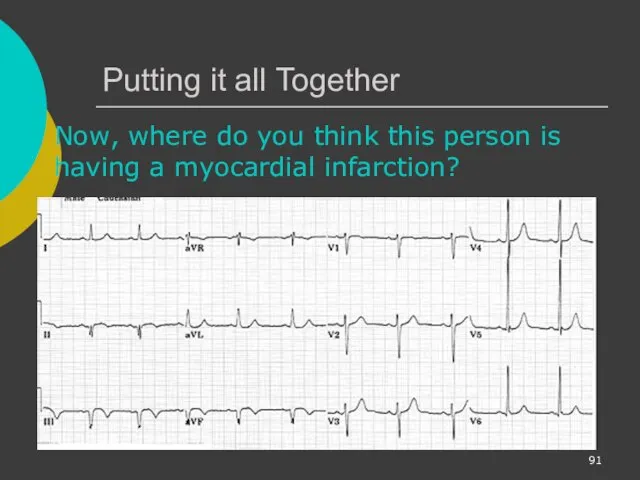
Putting it all Together
Now, where do you think this person is
Putting it all Together
Now, where do you think this person is

Inferior Wall MI
This is an inferior MI. Note the ST elevation
Inferior Wall MI
This is an inferior MI. Note the ST elevation

Putting it all Together
How about now?
Putting it all Together
How about now?
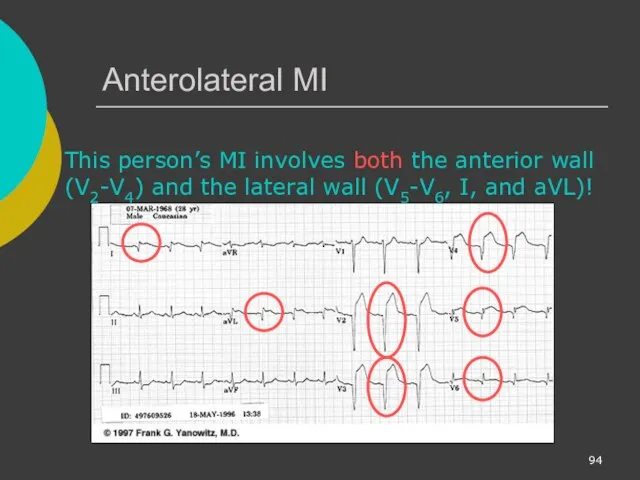
Anterolateral MI
This person’s MI involves both the anterior wall (V2-V4) and
Anterolateral MI
This person’s MI involves both the anterior wall (V2-V4) and
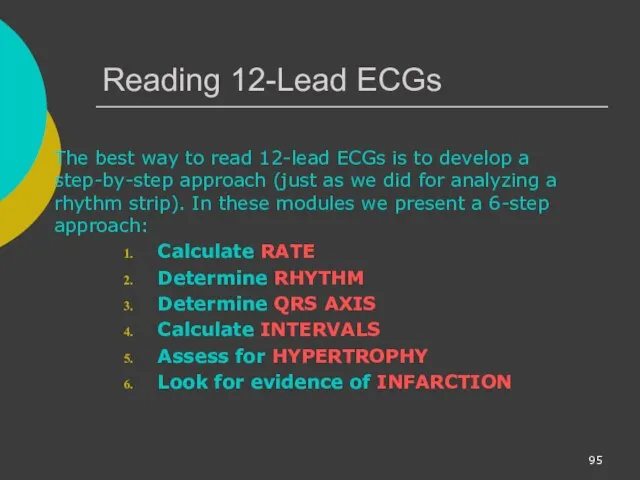
Reading 12-Lead ECGs
The best way to read 12-lead ECGs is to
Reading 12-Lead ECGs
The best way to read 12-lead ECGs is to

Rate Rhythm Axis Intervals Hypertrophy Infarct
In Module II you learned
Rate Rhythm Axis Intervals Hypertrophy Infarct
In Module II you learned
 Опухоли. Строение опухолей
 Колоректальный рак
 Органы нервной системы. Спинной и головной мозг. Рефлекторные дуги. Гистология
 Визначення типу складності випадку та особливості його ведення, залежно від наявних ризиків
 Типы старения кожи лица
 Лимфоаденопатии
 Важные этапы РОФ
 Сравнительная характеристика селективного ИДС по IgA и транзиторного ИДС
 Принципы и концепция доказательной медицины. Лекция 1
 Лекция №22. Общие вопросы хирургической инфекции
 Paediatric Anaesthesia
 Лечение периодонтитов молочных зубов
 Қоғамдық денсаулық сақтау мамандығы бойынша
 Алкоголизм и его последствия для здоровья
 ЛФК при заболеваниях, травмах и повреждениях опорно-двигательного аппарата и нервной системы. (Лекция 3)
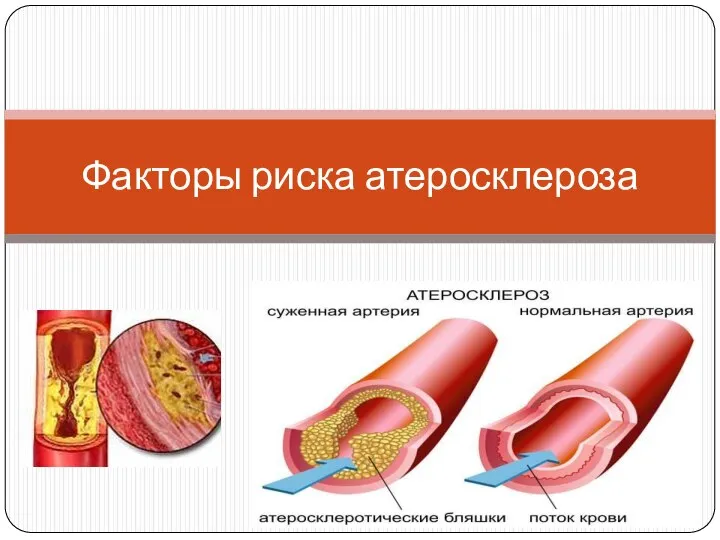 Факторы риска атеросклероза
 Синдром Кавасаки
 Качество медицинской помощи и его обеспечение
 Понятие дезинфекции
 Рентгенография
 Артикуляторы, окклюдаторы. Изготовление восковых базисов
 Лечение артериальной гипертензии
 Основы клинической онкологии
 Помощь в коррекции речевой функции заикающихся детей в школьном возрасте
 Телефон доверия. Технологии оказания экстренной психологической помощи
 Острое инфекционное заболевание - дифтерия
 Ботулизм - тағамдық токсикоздың ауыр түріне жатады
 Шок. Классификация, диагностика, лечение