- Principles of Corporate Finance

Содержание
- 2. Topics Covered Sensitivity Analysis Break Even Analysis Monte Carlo Simulation Decision Trees
- 3. How To Handle Uncertainty Sensitivity Analysis - Analysis of the effects of changes in sales, costs,
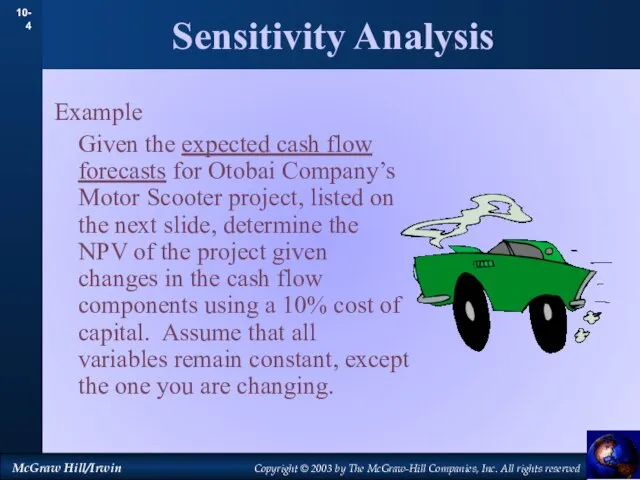
- 4. Sensitivity Analysis Example Given the expected cash flow forecasts for Otobai Company’s Motor Scooter project, listed
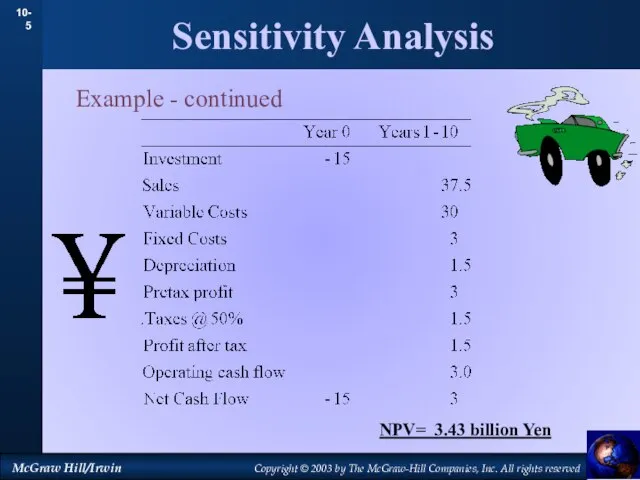
- 5. Sensitivity Analysis Example - continued NPV= 3.43 billion Yen
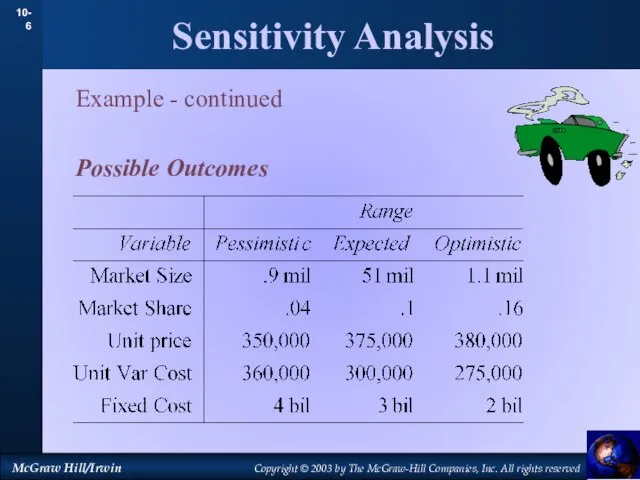
- 6. Sensitivity Analysis Example - continued Possible Outcomes
- 7. Sensitivity Analysis Example - continued NPV Calculations for Optimistic Market Size Scenario NPV= +5.7 bil yen
- 8. Sensitivity Analysis Example - continued NPV Possibilities (Billions Yen)
- 9. Break Even Analysis Point at which the NPV=0 is the break even point Otobai Motors has
- 10. Monte Carlo Simulation Step 1: Modeling the Project Step 2: Specifying Probabilities Step 3: Simulate the
- 11. Decision Trees 960 (.8) 220(.2) 930(.4) 140(.6) 800(.8) 100(.2) 410(.8) 180(.2) 220(.4) 100(.6) +150(.6) +30(.4) +100(.6)
- 12. Decision Trees 960 (.8) 220(.2) 930(.4) 140(.6) 800(.8) 100(.2) 410(.8) 180(.2) 220(.4) 100(.6) +150(.6) +30(.4) +100(.6)
- 13. Decision Trees 960 (.8) 220(.2) 930(.4) 140(.6) 800(.8) 100(.2) 410(.8) 180(.2) 220(.4) 100(.6) +150(.6) +30(.4) +100(.6)
- 14. Decision Trees 960 (.8) 220(.2) 930(.4) 140(.6) 800(.8) 100(.2) 410(.8) 180(.2) 220(.4) 100(.6) -550 NPV= ?
- 15. Decision Trees 960 (.8) 220(.2) 930(.4) 140(.6) 800(.8) 100(.2) 410(.8) 180(.2) 220(.4) 100(.6) -550 NPV= ?
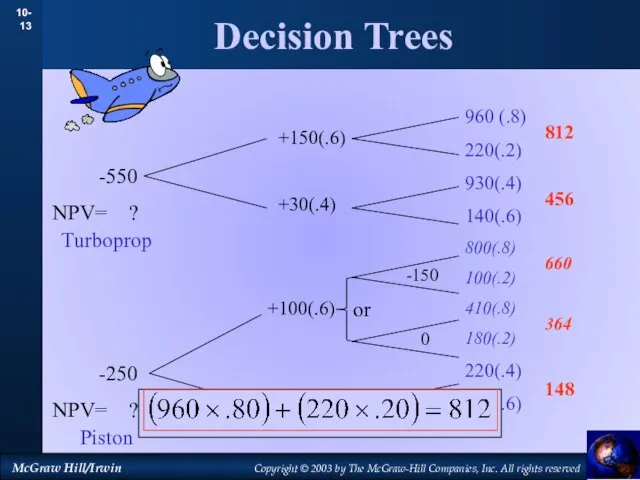
- 16. Decision Trees 960 (.8) 220(.2) 930(.4) 140(.6) 800(.8) 100(.2) 410(.8) 180(.2) 220(.4) 100(.6) 812 456 660
- 17. Decision Trees 960 (.8) 220(.2) 930(.4) 140(.6) 800(.8) 100(.2) 410(.8) 180(.2) 220(.4) 100(.6) 812 456 660
- 19. Скачать презентацию

Topics Covered
Sensitivity Analysis
Break Even Analysis
Monte Carlo Simulation
Decision Trees
Topics Covered
Sensitivity Analysis
Break Even Analysis
Monte Carlo Simulation
Decision Trees
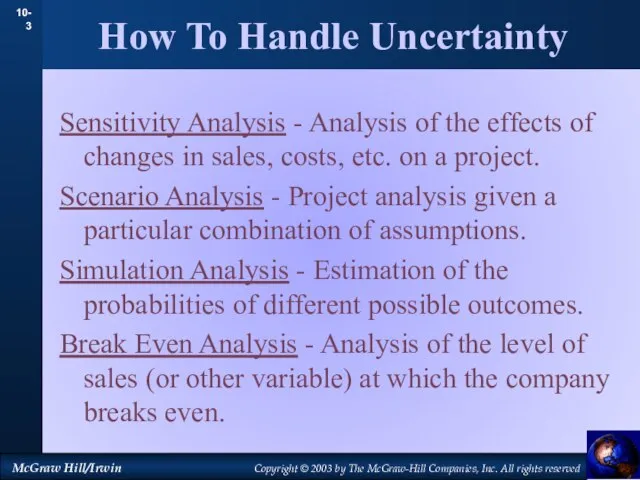
How To Handle Uncertainty
Sensitivity Analysis - Analysis of the effects of
How To Handle Uncertainty
Sensitivity Analysis - Analysis of the effects of
Sensitivity Analysis
Example
Given the expected cash flow forecasts for Otobai Company’s Motor
Sensitivity Analysis
Example
Given the expected cash flow forecasts for Otobai Company’s Motor
Sensitivity Analysis
Example - continued
NPV= 3.43 billion Yen
Sensitivity Analysis
Example - continued
NPV= 3.43 billion Yen
Sensitivity Analysis
Example - continued
Possible Outcomes
Sensitivity Analysis
Example - continued
Possible Outcomes
Sensitivity Analysis
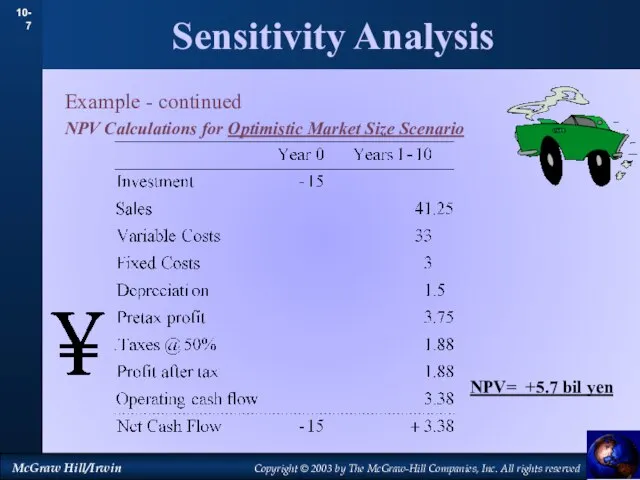
Example - continued
NPV Calculations for Optimistic Market Size Scenario
NPV= +5.7
Sensitivity Analysis
Example - continued
NPV Calculations for Optimistic Market Size Scenario
NPV= +5.7

Sensitivity Analysis
Example - continued
NPV Possibilities (Billions Yen)
Sensitivity Analysis
Example - continued
NPV Possibilities (Billions Yen)
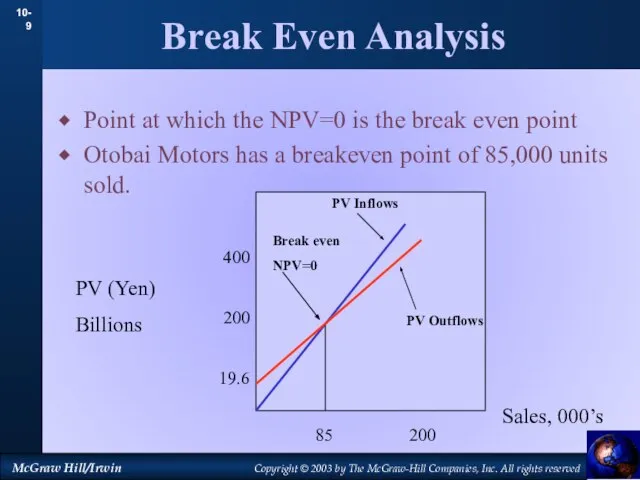
Break Even Analysis
Point at which the NPV=0 is the break even
Break Even Analysis
Point at which the NPV=0 is the break even

Monte Carlo Simulation
Step 1: Modeling the Project
Step 2: Specifying Probabilities
Step 3:
Monte Carlo Simulation
Step 1: Modeling the Project
Step 2: Specifying Probabilities
Step 3:
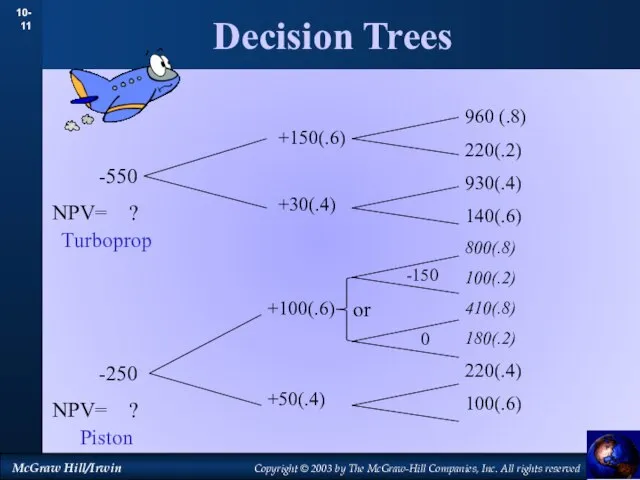
Decision Trees
960 (.8)
220(.2)
930(.4)
140(.6)
800(.8)
100(.2)
410(.8)
180(.2)
220(.4)
100(.6)
+150(.6)
+30(.4)
+100(.6)
+50(.4)
-550
NPV= ?
-250
NPV= ?
-150
0
or
Turboprop
Piston
Decision Trees
960 (.8)
220(.2)
930(.4)
140(.6)
800(.8)
100(.2)
410(.8)
180(.2)
220(.4)
100(.6)
+150(.6)
+30(.4)
+100(.6)
+50(.4)
-550
NPV= ?
-250
NPV= ?
-150
0
or
Turboprop
Piston

Decision Trees
960 (.8)
220(.2)
930(.4)
140(.6)
800(.8)
100(.2)
410(.8)
180(.2)
220(.4)
100(.6)
+150(.6)
+30(.4)
+100(.6)
+50(.4)
-550
NPV= ?
-250
NPV= ?
-150
0
or
812
456
660
364
148
Turboprop
Piston
Decision Trees
960 (.8)
220(.2)
930(.4)
140(.6)
800(.8)
100(.2)
410(.8)
180(.2)
220(.4)
100(.6)
+150(.6)
+30(.4)
+100(.6)
+50(.4)
-550
NPV= ?
-250
NPV= ?
-150
0
or
812
456
660
364
148
Turboprop
Piston
Decision Trees
960 (.8)
220(.2)
930(.4)
140(.6)
800(.8)
100(.2)
410(.8)
180(.2)
220(.4)
100(.6)
+150(.6)
+30(.4)
+100(.6)
+50(.4)
-550
NPV= ?
-250
NPV= ?
-150
0
or
812
456
660
364
148
Turboprop
Piston
Decision Trees
960 (.8)
220(.2)
930(.4)
140(.6)
800(.8)
100(.2)
410(.8)
180(.2)
220(.4)
100(.6)
+150(.6)
+30(.4)
+100(.6)
+50(.4)
-550
NPV= ?
-250
NPV= ?
-150
0
or
812
456
660
364
148
Turboprop
Piston
Decision Trees
960 (.8)
220(.2)
930(.4)
140(.6)
800(.8)
100(.2)
410(.8)
180(.2)
220(.4)
100(.6)
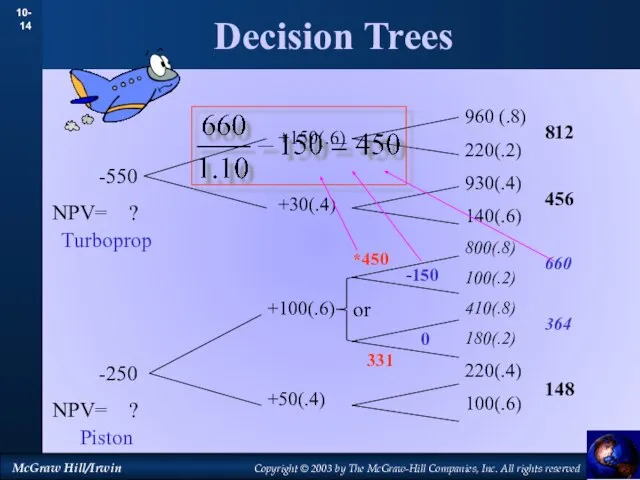
-550
NPV= ?
-250
NPV= ?
-150
0
or
812
456
660
364
148
+150(.6)
+30(.4)
+100(.6)
+50(.4)
*450
331
Turboprop
Piston
Decision Trees
960 (.8)
220(.2)
930(.4)
140(.6)
800(.8)
100(.2)
410(.8)
180(.2)
220(.4)
100(.6)
-550
NPV= ?
-250
NPV= ?
-150
0
or
812
456
660
364
148
+150(.6)
+30(.4)
+100(.6)
+50(.4)
*450
331
Turboprop
Piston
Decision Trees
960 (.8)
220(.2)
930(.4)
140(.6)
800(.8)
100(.2)
410(.8)
180(.2)
220(.4)
100(.6)
-550
NPV= ?
-250
NPV= ?
-150
0
or
812
456
660
364
148
+150(.6)
+30(.4)
+100(.6)
+50(.4)
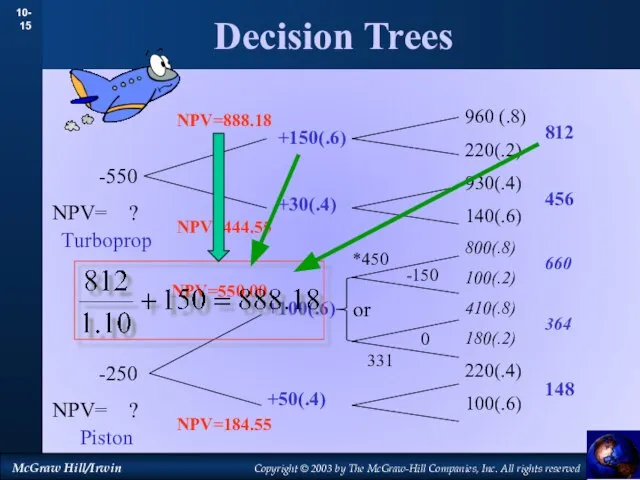
NPV=444.55
NPV=888.18
NPV=550.00
NPV=184.55
*450
331
Turboprop
Piston
Decision Trees
960 (.8)
220(.2)
930(.4)
140(.6)
800(.8)
100(.2)
410(.8)
180(.2)
220(.4)
100(.6)
-550
NPV= ?
-250
NPV= ?
-150
0
or
812
456
660
364
148
+150(.6)
+30(.4)
+100(.6)
+50(.4)
NPV=444.55
NPV=888.18
NPV=550.00
NPV=184.55
*450
331
Turboprop
Piston
Decision Trees
960 (.8)
220(.2)
930(.4)
140(.6)
800(.8)
100(.2)
410(.8)
180(.2)
220(.4)
100(.6)
812
456
660
364
148
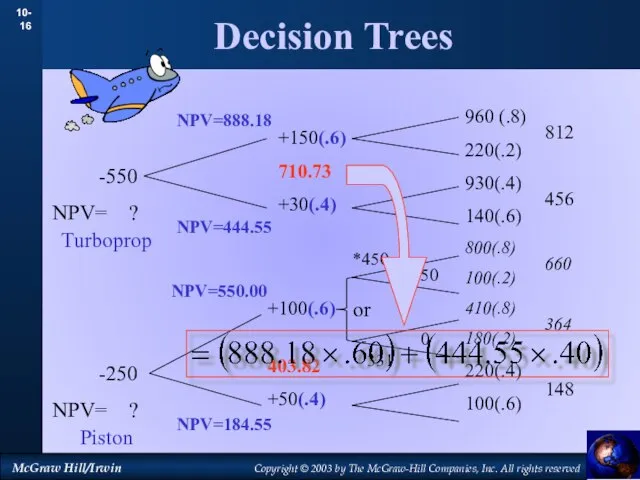
+150(.6)
710.73
+30(.4)
+100(.6)
403.82
+50(.4)
-150
0
*450
331
or
NPV=444.55
NPV=888.18
NPV=550.00
NPV=184.55
-550
NPV= ?
-250
NPV= ?
Turboprop
Piston
Decision Trees
960 (.8)
220(.2)
930(.4)
140(.6)
800(.8)
100(.2)
410(.8)
180(.2)
220(.4)
100(.6)
812
456
660
364
148
+150(.6)
710.73
+30(.4)
+100(.6)
403.82
+50(.4)
-150
0
*450
331
or
NPV=444.55
NPV=888.18
NPV=550.00
NPV=184.55
-550
NPV= ?
-250
NPV= ?
Turboprop
Piston
Decision Trees
960 (.8)
220(.2)
930(.4)
140(.6)
800(.8)
100(.2)
410(.8)
180(.2)
220(.4)
100(.6)
812
456
660
364
148
+150(.6)
710.73
+30(.4)
+100(.6)
403.82
+50(.4)
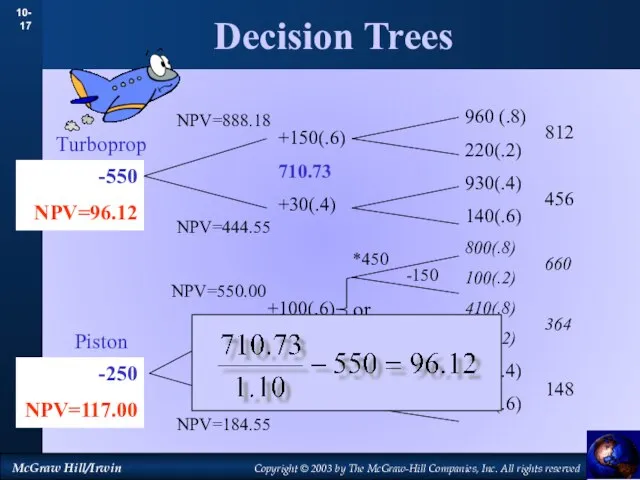
-550
NPV=96.12
-250
NPV=117.00
-150
0
*450
331
or
NPV=444.55
NPV=888.18
NPV=550.00
NPV=184.55
Turboprop
Piston
Decision Trees
960 (.8)
220(.2)
930(.4)
140(.6)
800(.8)
100(.2)
410(.8)
180(.2)
220(.4)
100(.6)
812
456
660
364
148
+150(.6)
710.73
+30(.4)
+100(.6)
403.82
+50(.4)
-550
NPV=96.12
-250
NPV=117.00
-150
0
*450
331
or
NPV=444.55
NPV=888.18
NPV=550.00
NPV=184.55
Turboprop
Piston
 Методические рекомендации по вопросам представления сведений и заполнения соответствующейформы справки о доходах
 Основы безопасности при использовании банковских карт
 МСФО 19 Вознаграждения работникам
 Налог на прибыль организаций
 Слаиды 1 день
 Сравнительный подход
 Особенности инфляционных процессов в РФ на современном этапе
 Формы и системы оплаты труда
 Роль и место бизнес-плана
 Спонсорский пакет. Первый официальный чемпионат по киберспорту в дисциплине DOTA 2
 Основные показатели деятельности компании ПАО МТС
 Что такое финансы
 Ценные бумаги в финансовом менеджменте
 Формирование транспортно-распорядительной логистической инфраструктуры. Терминальнологистические центры (ТРЦ). (Лекция 3)
 Меры финансовой поддержки субъектов малого предпринимательства в РФ
 Инвестиционное предложение по освоению земельного участка площадью 5,4 Га
 Двойная запись
 Основные параметры исполнения бюджета
 Оценка рисков инвестиционной деятельности российских нефтегазовых компаний на зарубежных рынках
 Пособие Дом по Почте
 Изменение порядка применения КОСГУ в 2019 году
 Основні заходи щодо раціонального та економного використання коштів місцевих бюджетів на 2018 рік у галузі освіта
 Финансовая отчетность хозяйствующего субъекта, как источник информации для оценки его финансовой устойчивости
 Социальное страхование
 Страхование. Закон РФ
 Повышение эффективности и удобства работы при переходе на 1С: Зарплата и Управление Персоналом 8
 Деньги
 Формы и система оплаты труда