- Introductory statistics

Содержание
- 2. Fractiles Numbers that partition or divide an ordered data set into equal parts. The median of
- 3. Quartiles Approximately divide a data set into 4 equal parts There are 3 quartiles: First, Second,
- 4. 2nd Quartile, Q2 The Median of the entire data set Half the data entries lie on
- 5. 1st Quartile, Q1 The Median of the Lower half of the data set (below Q2) It
- 6. 3rd Quartile, Q3 The Median of the Upper half of the data set (above Q2) It
- 7. 7 8 10 13 13 16 17 19 22 24 25 Q2 Q1 Q3 Lower Half
- 8. The Quartiles approximately divide the data into 4 equal parts, therefore 25% of the data is
- 9. Example 1: the test scores of 15 employees enrolled in a CPR training course are listed.
- 10. Example 2: The tuition costs (in thousands of dollars) for 11 universities are listed. Find the
- 11. Interquartile Range (IQR) The difference between the third and first quartiles IQR = Q3 – Q1
- 12. Find the Interquartile range from Example 1 Q1 = 10 and Q3 = 18 18 –
- 13. Find the Interquartile range from Example 2 Q1 = 17 and Q3 = 31 31 –
- 14. IQR – Interquartile Range (Q3 – Q1) Gives an idea of how much the middle 50%
- 15. Take a look at Example 1 ? The IQR is 8 5 7 9 10 11
- 16. http://www.mathsisfun.com/data/images/box-whisker-plot.gif Box and Whisker Plot Example:
- 17. Box and Whisker Plot A graph that shows the Median (Q2), Quartile 1, Quartile 3, the
- 18. Steps for creating a box and whisker plot Find the Median (Q2) of all the numbers
- 19. Examples: Create a Box and Whisker Plot for each. 1. Years of service of a sample
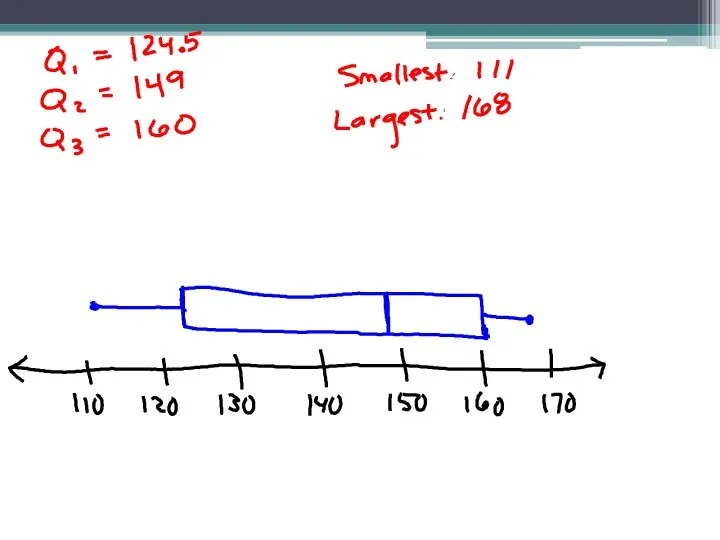
- 21. 2. 111 115 122 127 127 147 151 159 160 160 163 168
- 23. Distribution Shape Based on Box and Whisker Plot If the median is near the center of
- 25. Скачать презентацию
Fractiles
Numbers that partition or divide an ordered data set into equal
Fractiles
Numbers that partition or divide an ordered data set into equal
Quartiles
Approximately divide a data set into 4 equal parts
There are 3
Quartiles
Approximately divide a data set into 4 equal parts
There are 3
2nd Quartile, Q2
The Median of the entire data set
Half the data
2nd Quartile, Q2
The Median of the entire data set
Half the data
1st Quartile, Q1
The Median of the Lower half of the data
1st Quartile, Q1
The Median of the Lower half of the data
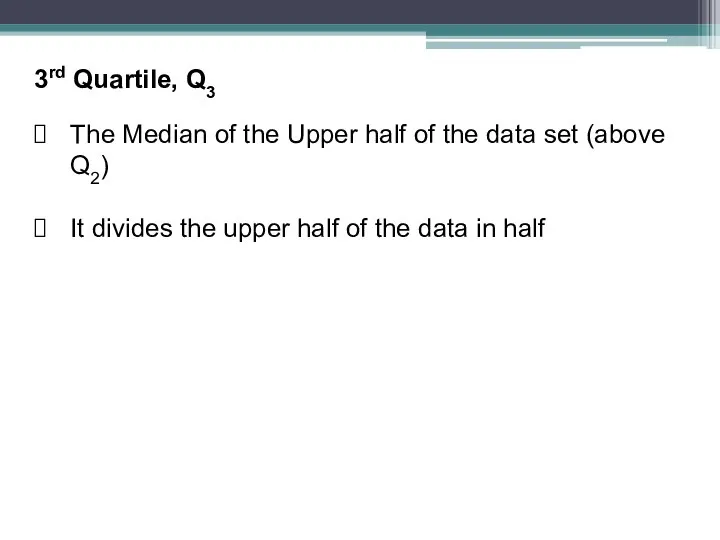
3rd Quartile, Q3
The Median of the Upper half of the data
3rd Quartile, Q3
The Median of the Upper half of the data
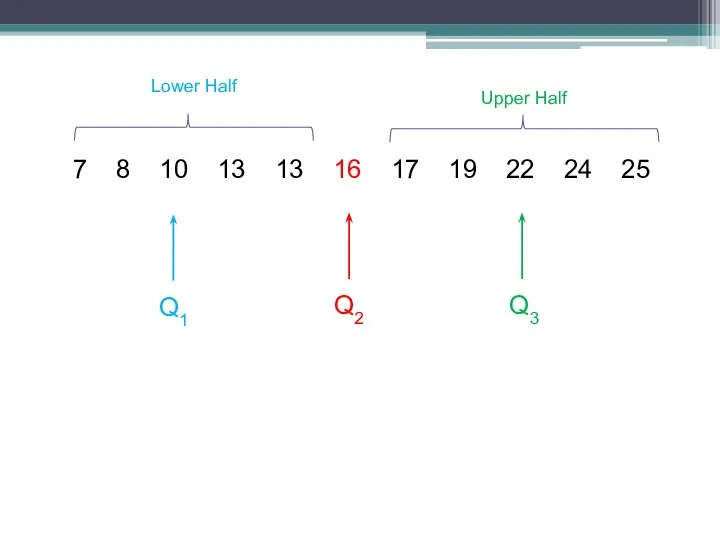
7 8 10 13 13 16 17 19 22 24 25
7 8 10 13 13 16 17 19 22 24 25
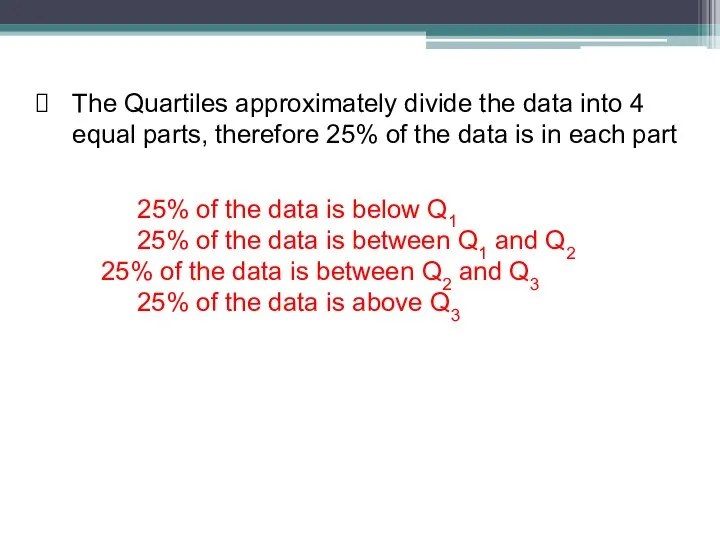
The Quartiles approximately divide the data into 4 equal parts, therefore
The Quartiles approximately divide the data into 4 equal parts, therefore
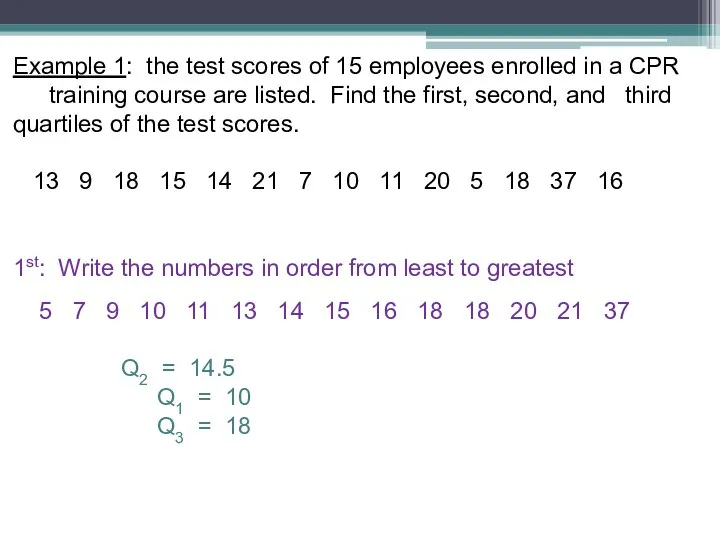
Example 1: the test scores of 15 employees enrolled in a
Example 1: the test scores of 15 employees enrolled in a
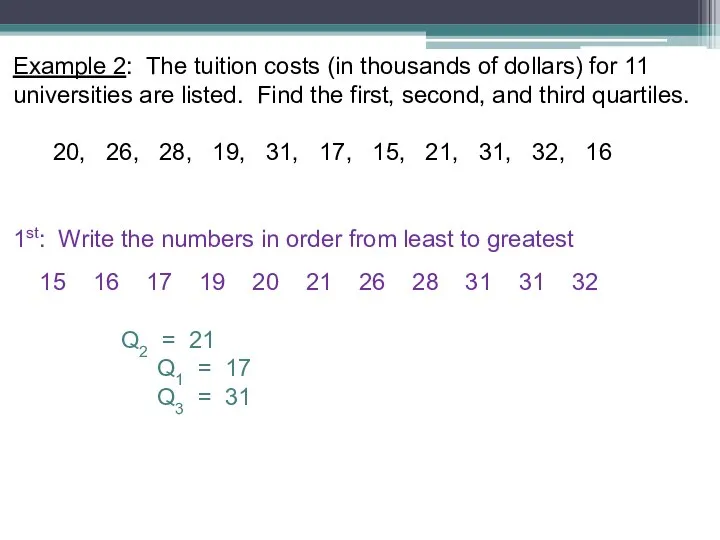
Example 2: The tuition costs (in thousands of dollars) for 11
Example 2: The tuition costs (in thousands of dollars) for 11
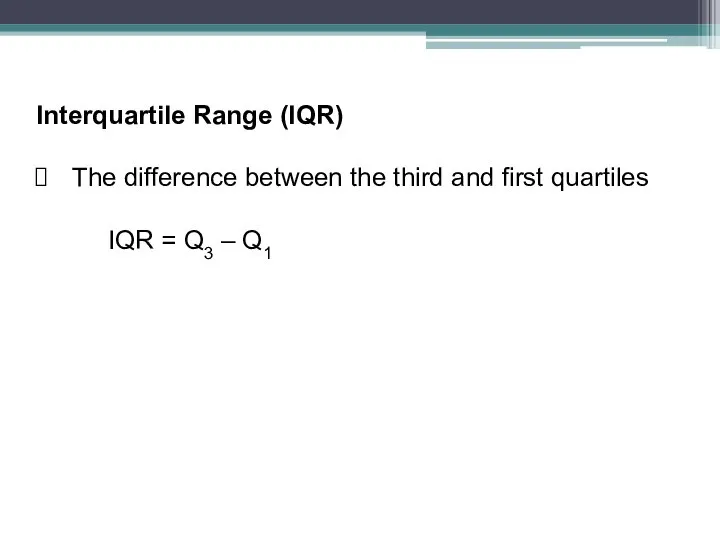
Interquartile Range (IQR)
The difference between the third and first quartiles
IQR =
Interquartile Range (IQR)
The difference between the third and first quartiles
IQR =
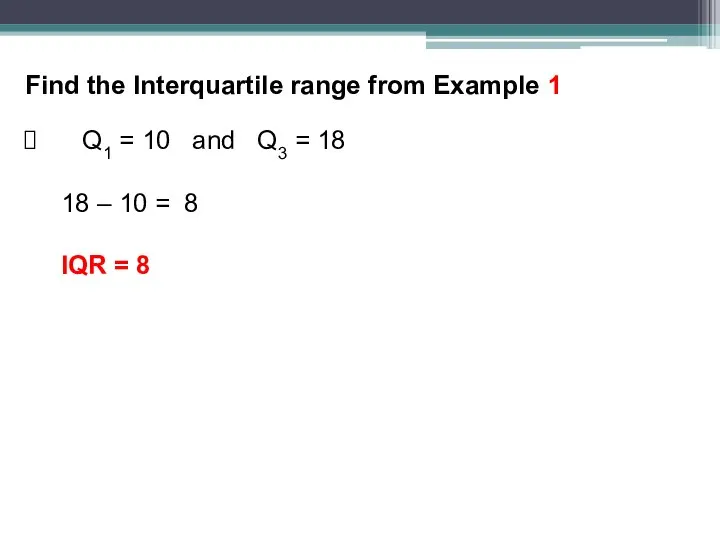
Find the Interquartile range from Example 1
Q1 = 10 and
Find the Interquartile range from Example 1
Q1 = 10 and
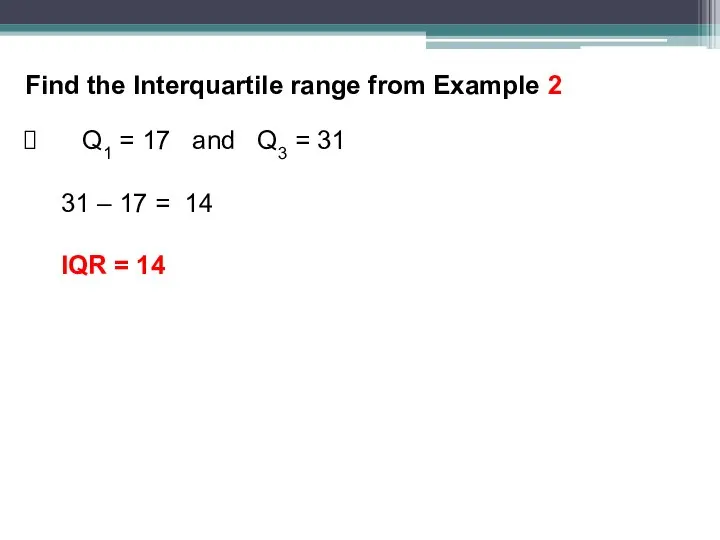
Find the Interquartile range from Example 2
Q1 = 17 and
Find the Interquartile range from Example 2
Q1 = 17 and
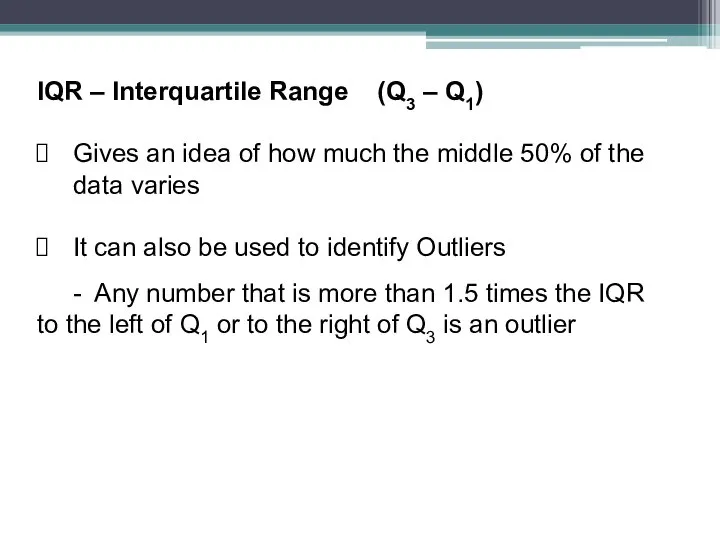
IQR – Interquartile Range (Q3 – Q1)
Gives an idea of
IQR – Interquartile Range (Q3 – Q1)
Gives an idea of
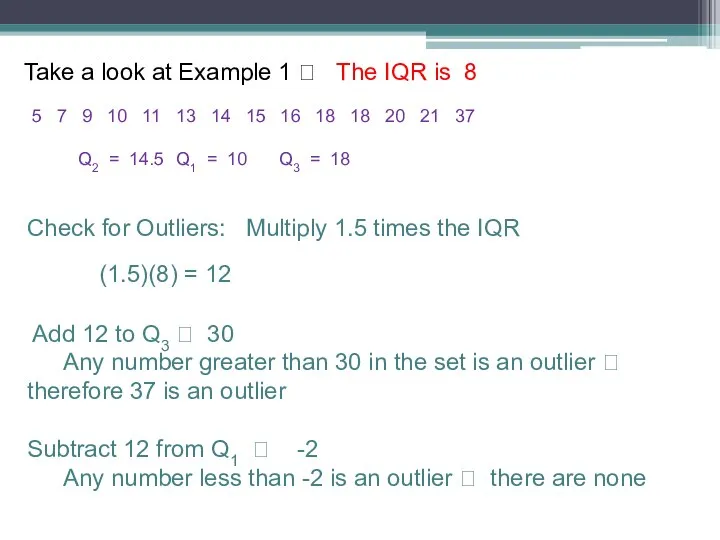
Take a look at Example 1 ? The IQR is 8
Take a look at Example 1 ? The IQR is 8
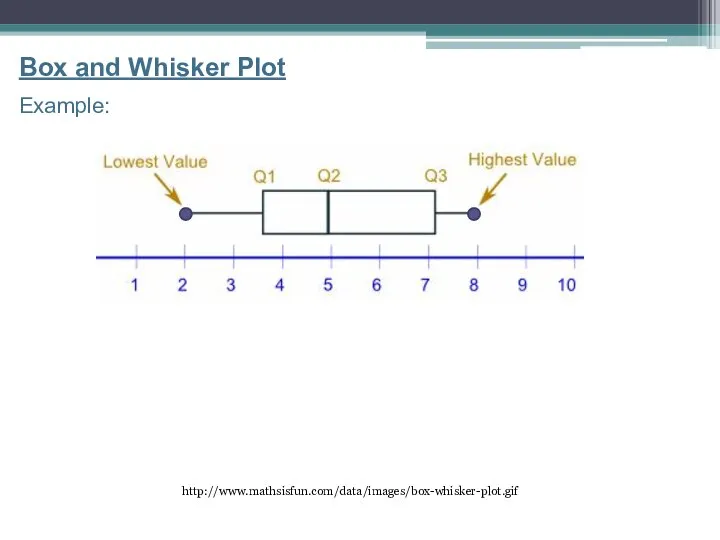
http://www.mathsisfun.com/data/images/box-whisker-plot.gif
Box and Whisker Plot
Example:
http://www.mathsisfun.com/data/images/box-whisker-plot.gif
Box and Whisker Plot
Example:
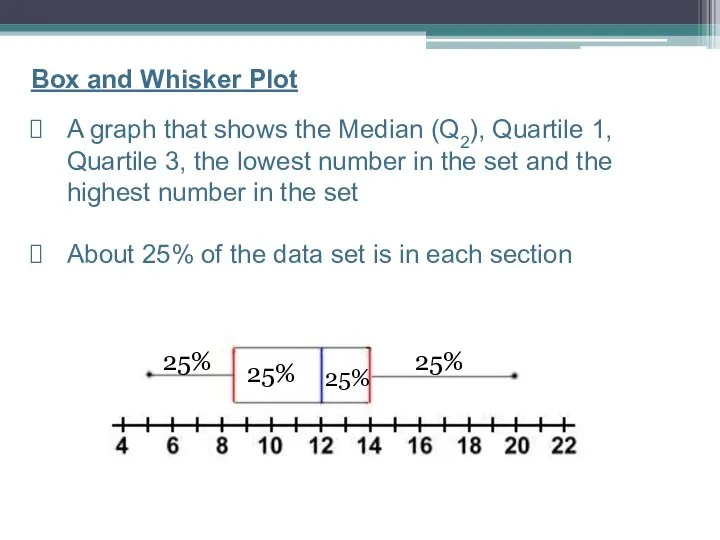
Box and Whisker Plot
A graph that shows the Median (Q2), Quartile
Box and Whisker Plot
A graph that shows the Median (Q2), Quartile
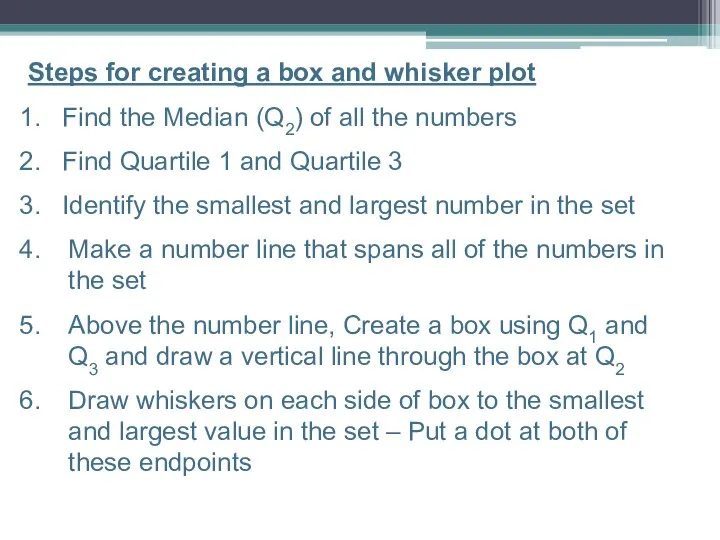
Steps for creating a box and whisker plot
Find the Median
Steps for creating a box and whisker plot
Find the Median
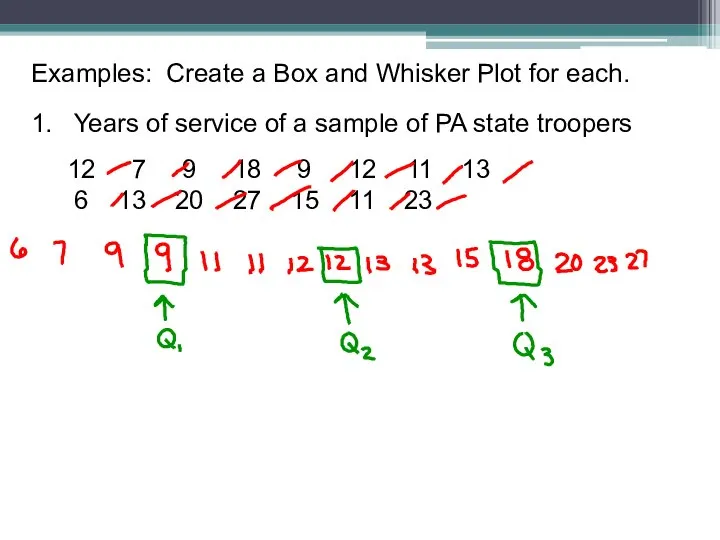
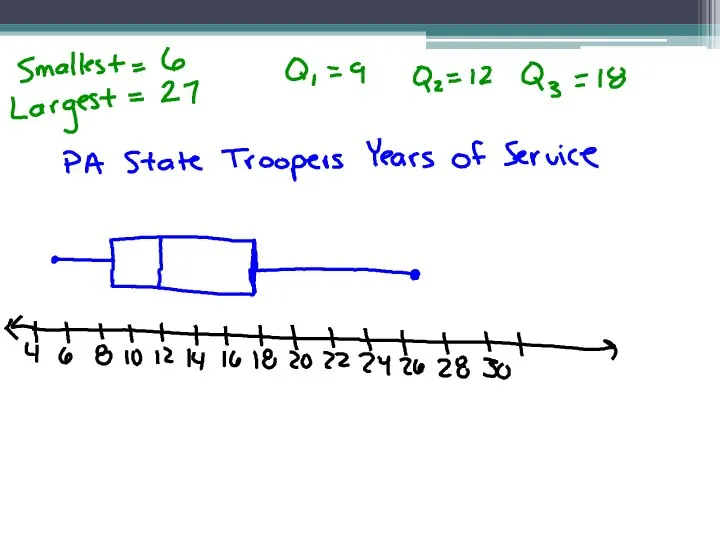
Examples: Create a Box and Whisker Plot for each.
1. Years
Examples: Create a Box and Whisker Plot for each.
1. Years
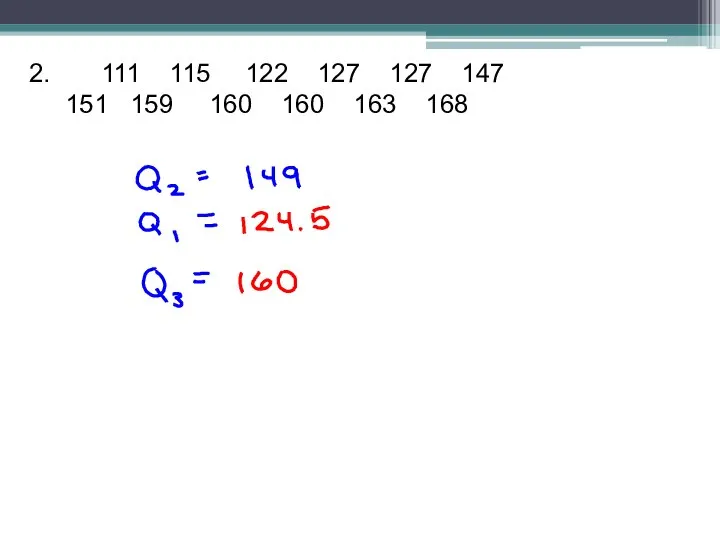
2. 111 115 122 127 127 147
151 159 160 160 163 168
2. 111 115 122 127 127 147
151 159 160 160 163 168
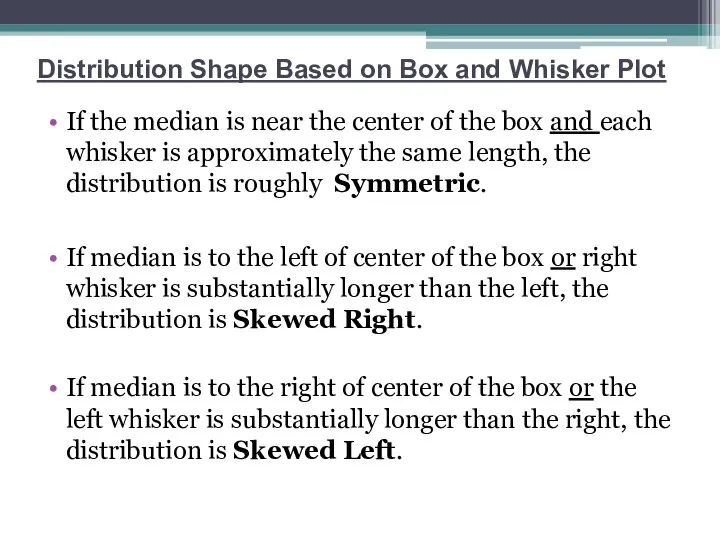
Distribution Shape Based on Box and Whisker Plot
If the median is
Distribution Shape Based on Box and Whisker Plot
If the median is
 Признак перпендикулярности плоскостей
 ЕГЭ по математике - 2012. Решаем B13
 Свойства логарифмов
 Статистическое изучение взаимосвязи социальноэкономических явлений
 Презентация по математике "Счёт в 1 классе" - скачать бесплатно
 Линейная функция и её график
 Презентация на тему Единицы измерения Сантиметр
  Абсолютные и относительные величины в статистике
 Вид статистической таблицы
 приложение определенного интеграла в геометрии (12 класс)
 Model Parameterization in tomography problems. Lecture 4
 Логарифмические неравенства
 Вписанная окружность в заданиях ЕГЭ
 Геометрические фигуры вокруг нас
 Четырехугольники и их свойства
 Математическое кафе Функция
 Формула корней квадратного уравнения
 Векторы в пространстве
 Бой смекалистых
 Методы многоскоростной обработки сигналов. Полифазные структуры многоскоростных систем
 Составление уравнения по условию задачи
 Возведение двучлена в любую натуральную степень
 Подготовка к ГИА. Изучение поведения функций и построение их графиков. Решение систем уравнений
 Нахождения дроби от числа, числа по его дроби ( 6 класс)
 Десятичные дроби и действия над ними
 Векторная алгебра
  Численные методы решения систем нелинейных алгебраических уравнений
 Статистические методы обработки информации