- Facility Level Reporting Training Presentations_UNICEF HMIS

Содержание
- 2. Day 1 Understanding your role in HMIS, key indicators, understanding your data collection tools, and pivot
- 3. Introductions, Expectations, and ground rules
- 4. Please state: Your name Facility and role One expectation for the workshop The best thing about
- 5. Training Objectives, Design, and Agenda
- 6. Training Objectives To assist participants in understanding their data collection tools better To enable participants to
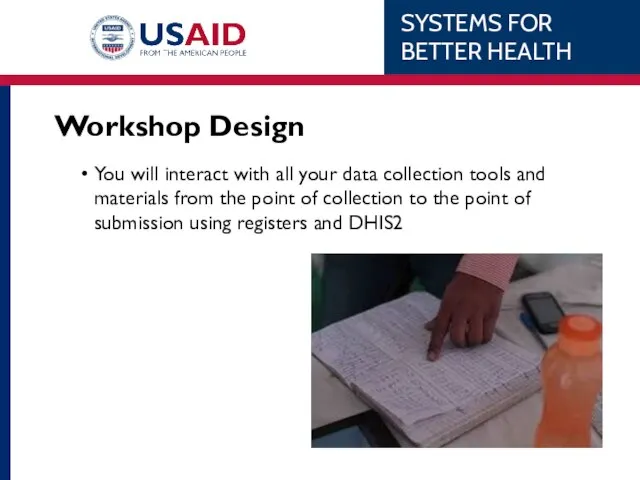
- 7. Workshop Design You will interact with all your data collection tools and materials from the point
- 8. Agenda Day 1: Understanding your role in HMIS, key indicators, understanding your data collection tools, and
- 9. HMIS Overview and Your Place In It Understanding the system
- 10. Understanding the System To understand data collection you have to first understand the health system. A
- 11. Patient Level The goal of the health system is to ensure that patients receive access to
- 12. Needs at each Level What does each level need to have to provide this patient health
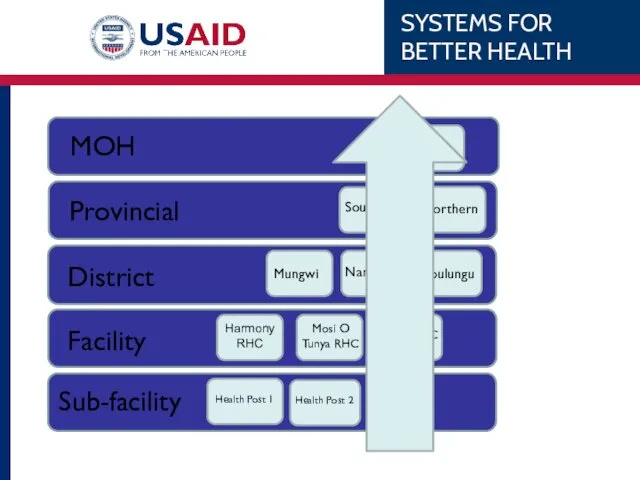
- 13. Putting it together National: Results Policy Finance Goals District: Results Finance Training Protocols Management Protocols Facility:
- 14. Understanding the Connectedness Every critical item in the patient cycle does not stand alone. Every item
- 15. ? We are now going to connect dependent items between levels National: Results Policy Etc. District:
- 16. Where do information systems come in? These information systems allow people who can make decisions to
- 17. Where do information systems come in? National: Results Policy Etc. District: Finance Training Protocols Results Facility:
- 18. Where does the HMIS come in? National: Results Policy District: Finance Training Protocols Results. Facility: Facilities
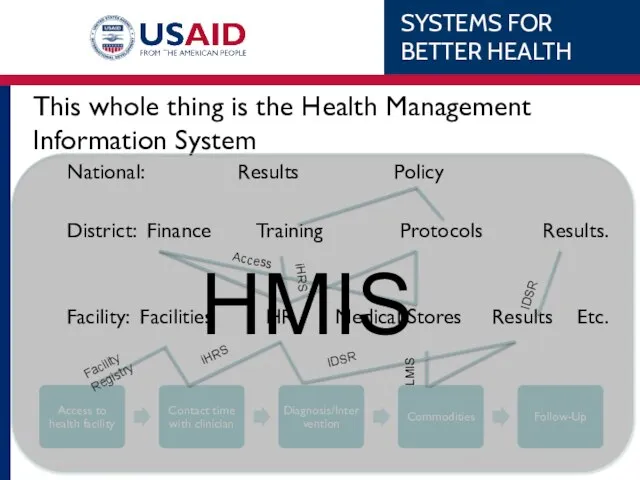
- 19. This whole thing is the Health Management Information System National: Results Policy District: Finance Training Protocols
- 20. …..and this is where you fit in data-wise National: Results Policy District: Finance Training Protocols Results.
- 21. Current reporting challenges Discussion
- 22. Facility Level Reporting
- 23. How will it work? HMIS Currently: Facility Level Reporting:
- 24. Theory of Change By having you (facility staff) directly enter data into the HMIS (DHIS2), we
- 25. Key HMIS indicators Understanding YOUR data
- 26. Maternal and Child Health Fully immunized children Underweight children 1st ANC visit Institutional Deliveries Family planning
- 27. HIV/AIDS PMTCT Virology/Serology General counselling and Testing Current in ART ART retention VMMC
- 28. Tuberculosis Notifications for TB Percentage of Retreatment cases Cure Rate Mortality Rate Commenced on ARVs Commenced
- 29. Sexually Transmitted Infections STI cases STI+ tested for HIV
- 30. Adolescent/Reproductive Health 1st ANC HIV positive adolescents Adolescents on family planning
- 31. Malaria Incidence/1000 Cases under 5 Cases over 5
- 32. Your data collection tools Understanding Facility Registers (DHIO to present)
- 33. Facility Registers These are used to collect raw data Individual data elements are counted against each
- 34. Tally Sheets These “tally” up totals from registers Consolidate register data into a smaller, more digestible
- 35. HIA1 and HIA2 Filled in at the end of the month Sent to district for entry
- 36. HIA4 (Where applicable) Filled in at the end of the month Sent to facility for entry
- 37. Exercise Think about registers you have problems with. Depending on what the group comes up with,
- 38. Tips for making the collection and troubleshooting process easier Fill in data as you see patients
- 39. Data Quality
- 40. Generating Quality Data Before submitting reports, data collectors must: Spot-check a small percentage of the data
- 41. What is wrong with this data?
- 42. Exercise Use the registers and tally sheets you brought with you to identify errors in the
- 43. Day 2 Into DHIS2 -- creating charts and pivot tables, saving favorites, and practicing data entry
- 44. What is DHIS2? District Health Information System Open source software Born out of HISP Zambia’s adopted
- 45. What does it do?
- 46. The DHIS2 Model
- 47. Pivot Tables Module:
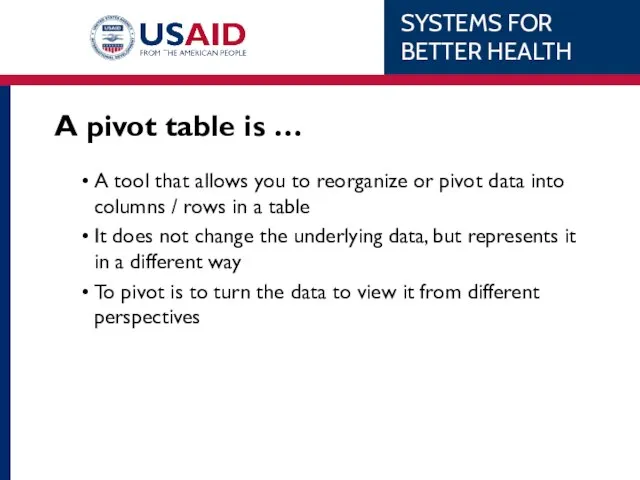
- 48. A pivot table is … A tool that allows you to reorganize or pivot data into
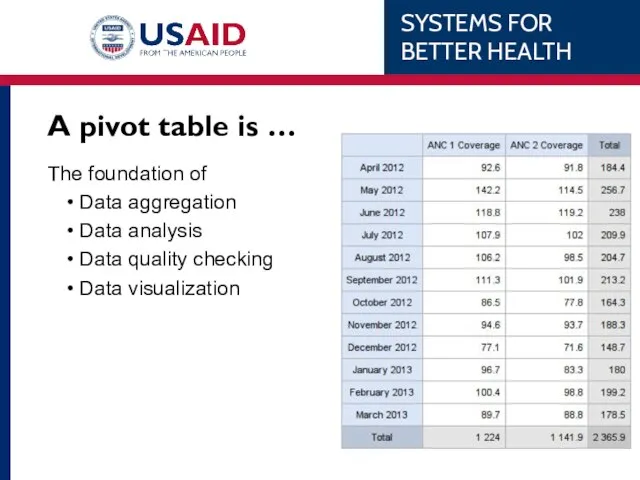
- 49. A pivot table is … The foundation of Data aggregation Data analysis Data quality checking Data
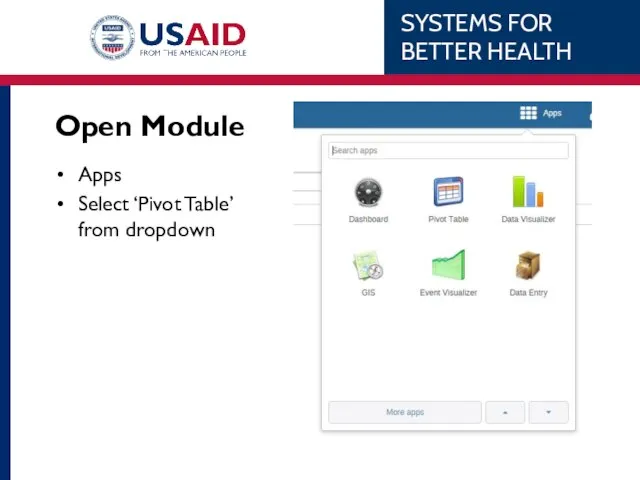
- 50. Open Module Apps Select ‘Pivot Table’ from dropdown
- 51. Default Pivot Table
- 52. Data Selection Define DE / Indicator / Reporting rates (WHAT) Period (WHEN) Orgunit (WHERE) Update
- 53. WHAT Indicator Data Elements Reporting Rates WHEN Relative e.g. last 12 months Fixed e.g. Feb 2014
- 54. Pivot Table Parameters: When Relative Months Years Quarters Fixed Days Weeks Months Quarters Years
- 55. Pivot Table Parameters: Where Organization Unit + to show subunits Ctrl to select multiple Right click
- 56. Harmony RHC
- 57. WHEN: Monthly→ September 2015 WHERE: All subunits (i.e. Districts) under Luapula Province WHAT: ANC 1st visit
- 58. Result Data Element: ANC 1st visit Org Unit: All Luapula Districts Default pivot table can be
- 59. Pivoting / Changing layout Select ‘Layout’ Drag-n-drop orgunits to rows
- 60. Pivoting / Changing layout Select ‘Layout’ Drag-n-drop orgunits to column
- 61. Options Small modifications in formatting Show totals Show sub-totals
- 62. Worked Example…
- 63. Not very intuitive to read. PIVOT!!! Maternal health: ANC and PNC Data elements 1st ANC PNC
- 64. Move Orgunits to Column (below Data) Move Orgunits to Column (above Data) Pivoted
- 65. Pivoted Move Orgunits to Row (above Period) Move Orgunits to Row (below Period)
- 66. Download Click download Excel (XLS) Can then do other calculations / incorporate into other data etc.
- 67. Manage Favourites Add New Open saved chart Rename Overwrite Share Delete
- 68. Exercise Sheet Work through each example on the worksheet Don’t skip any sections Ask for help
- 69. Charts Module:
- 70. Overview Charts, graphs, and tables provide a great deal of visual appeal. They allow users to
- 71. Overview cont’d In educational settings, charts, graphs, and tables can be used to represent data. Illustrate
- 72. Six things conveyed by charts & graphs Comparisons Relationships Distribution Trends Composition Flow/process, or location
- 73. Reasons for creating charts and graphs Make important trends easily recognizable Allow users to perceive information
- 74. Charting considerations Type of data Purpose of the data Nature of the data or relationship being
- 75. Open Module Apps Select ‘Data Visualizer’ from dropdown
- 76. Default Data Visualizer
- 77. Chart type Select from Column Stacked column Bar Stacked bar Line Area Pie Spider charts Never
- 78. Chart parameters Data: Indicators Date Elements Reporting Rates Period: Relative e.g. Last quarter Fixed e.g. Feb
- 79. Example Chipata District’s 1st ANC coverage over the last 6 months. WHAT WHEN WHERE Indicator –
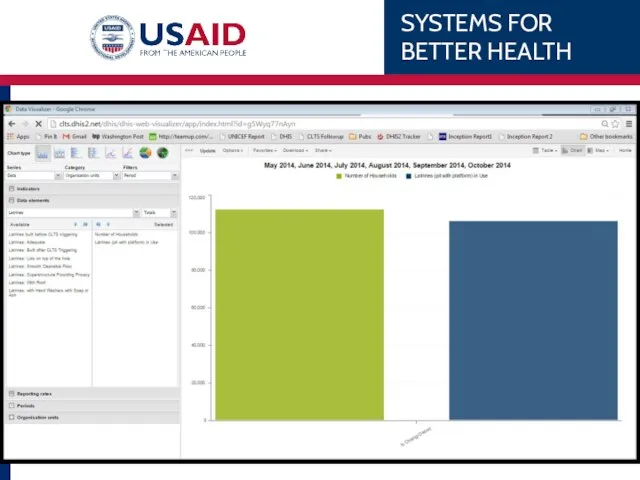
- 81. Example Chipata’s 1st ANC coverage over the last 6 months SERIES CATEGORY FILTERS DATA X-axis What
- 86. Chipata’s 1 ANC WHAT WHEN WHERE Data Element – 1st ANC Monthly, last 6 months Eastern
- 90. Options Small modifications in formatting Change Title Show trendlines
- 91. Worked example …
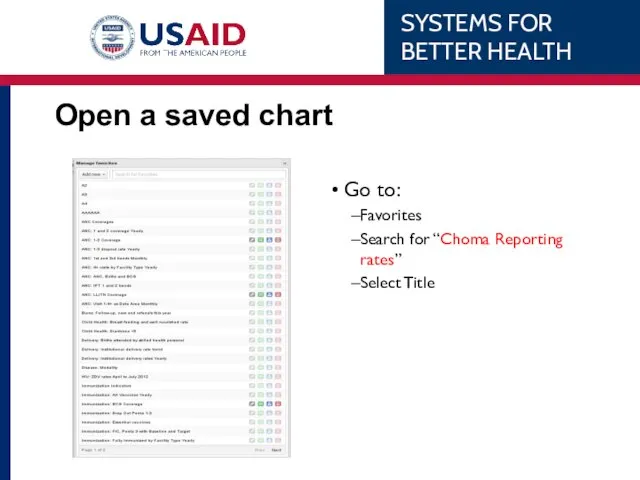
- 92. Open a saved chart Go to: Favorites Search for “Choma Reporting rates” Select Title
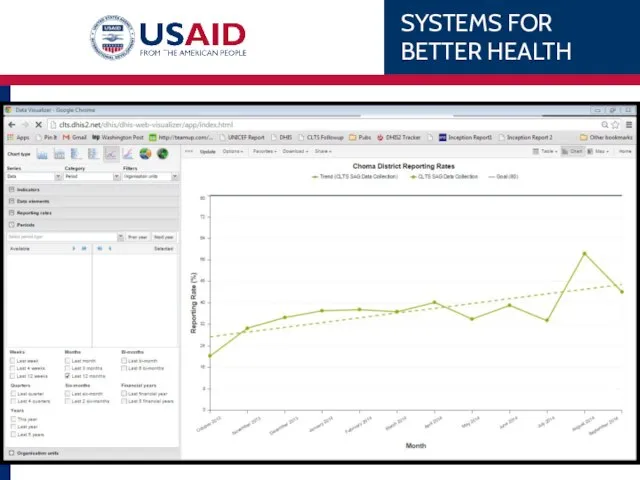
- 93. Choma Reporting Rates Line Chart Series (Data), Category (Period), Filter (Organisation unit) What: Reporting Rates: HIA2
- 95. Download charts Two options available Standard image (PNG) PDF PDF is higher quality if this is
- 96. Manage favorites Rename Overwrite Share Delete
- 97. Exercise Sheet Work through each example on the work sheet Don’t skip any sections Ask for
- 98. Data Entry Module
- 99. When to do data entry Entering HIA 1 and 2 forms Suggested 1 week before reporting
- 100. WARNING! Data entry is live No undo button I error in population data impacts reports on
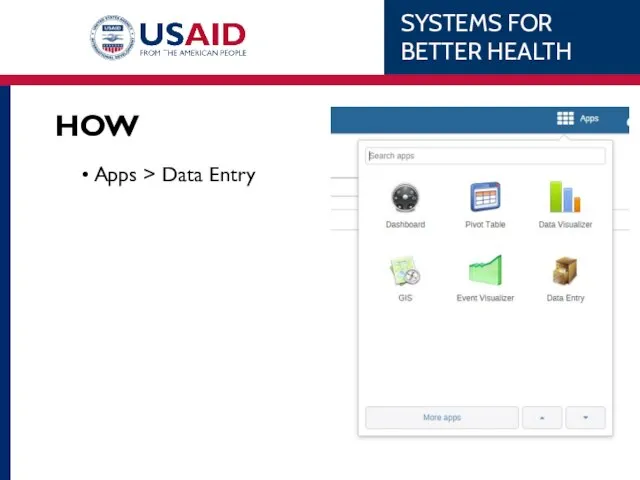
- 101. HOW Apps > Data Entry
- 102. HOW Select facility Select Form Select Period Enter Data
- 103. Worked Examples Use the tally sheets you brought from your facility to enter the data for
- 104. Group Discussion Feedback Closing
- 106. Скачать презентацию
Day 1
Understanding your role in HMIS, key indicators, understanding your data
Day 1
Understanding your role in HMIS, key indicators, understanding your data
Introductions, Expectations, and ground rules
Introductions, Expectations, and ground rules
Please state:
Your name
Facility and role
One expectation
Please state:
Your name
Facility and role
One expectation

Training Objectives, Design, and Agenda
Training Objectives, Design, and Agenda
Training Objectives
To assist participants in understanding their data collection tools better
To
Training Objectives
To assist participants in understanding their data collection tools better
To
Workshop Design
You will interact with all your data collection tools and
Workshop Design
You will interact with all your data collection tools and
Agenda
Day 1: Understanding your role in HMIS, key indicators, understanding your
Agenda
Day 1: Understanding your role in HMIS, key indicators, understanding your
HMIS Overview and Your Place In It
Understanding the system
HMIS Overview and Your Place In It
Understanding the system
Understanding the System
To understand data collection you have to first understand
Understanding the System
To understand data collection you have to first understand
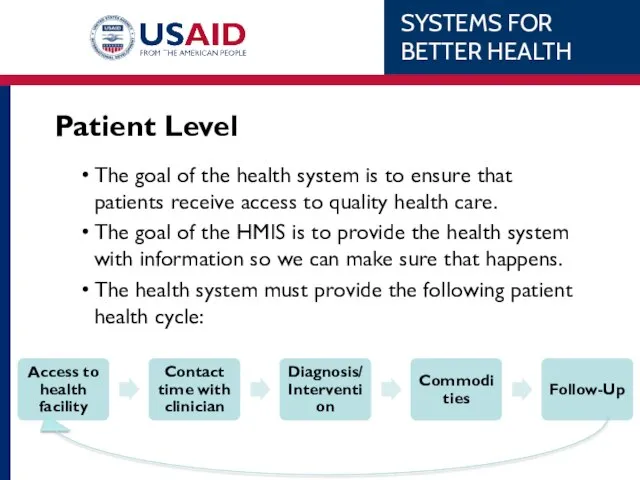
Patient Level
The goal of the health system is to ensure that
Patient Level
The goal of the health system is to ensure that
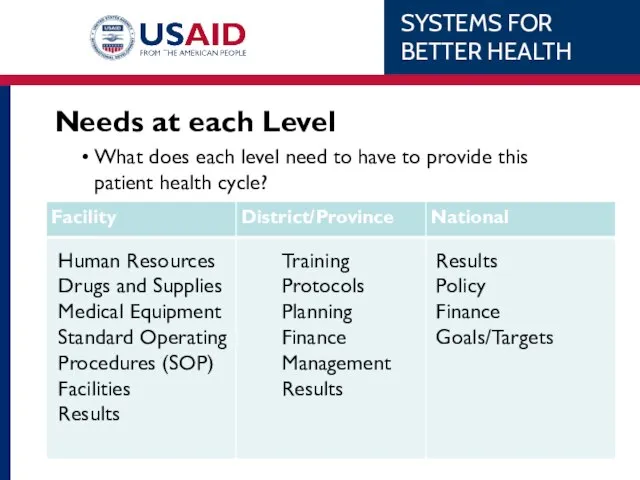
Needs at each Level
What does each level need to have to
Needs at each Level
What does each level need to have to
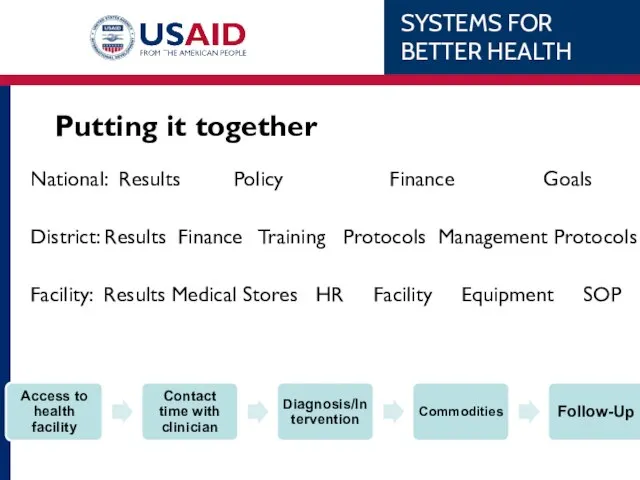
Putting it together
National: Results Policy Finance Goals
District: Results Finance Training Protocols
Putting it together
National: Results Policy Finance Goals
District: Results Finance Training Protocols
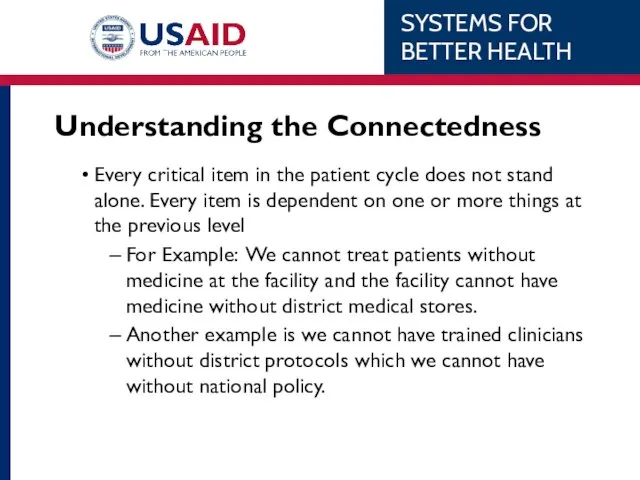
Understanding the Connectedness
Every critical item in the patient cycle does not
Understanding the Connectedness
Every critical item in the patient cycle does not
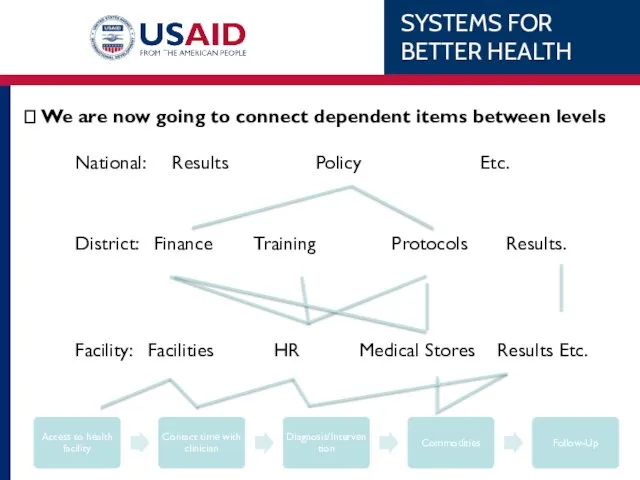
? We are now going to connect dependent items between levels
? We are now going to connect dependent items between levels
Where do information systems come in?
These information systems allow people who
Where do information systems come in?
These information systems allow people who
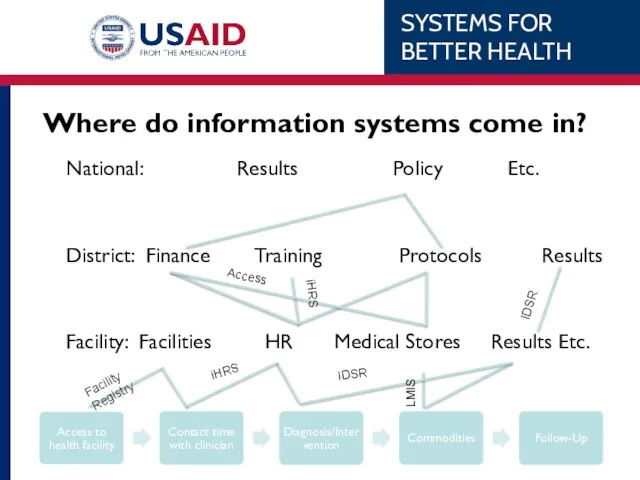
Where do information systems come in?
National: Results Policy Etc.
District: Finance Training
Where do information systems come in?
National: Results Policy Etc.
District: Finance Training
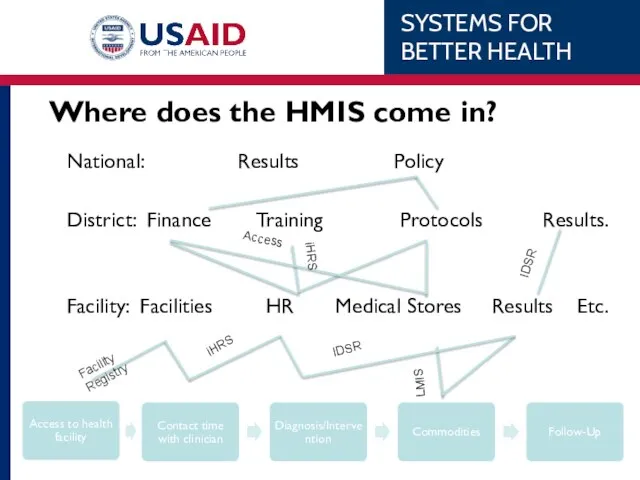
Where does the HMIS come in?
National: Results Policy
District: Finance Training Protocols
Where does the HMIS come in?
National: Results Policy
District: Finance Training Protocols
This whole thing is the Health Management Information System
National: Results Policy
District:
This whole thing is the Health Management Information System
National: Results Policy
District:
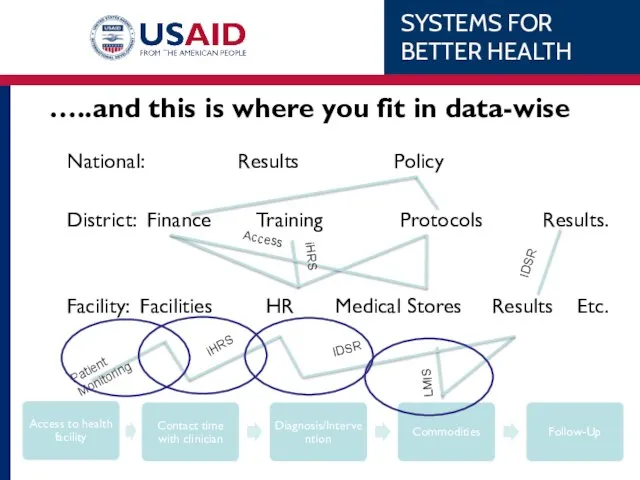
…..and this is where you fit in data-wise
National: Results Policy
District: Finance
…..and this is where you fit in data-wise
National: Results Policy
District: Finance
Current reporting challenges
Discussion
Current reporting challenges
Discussion
Facility Level Reporting
Facility Level Reporting
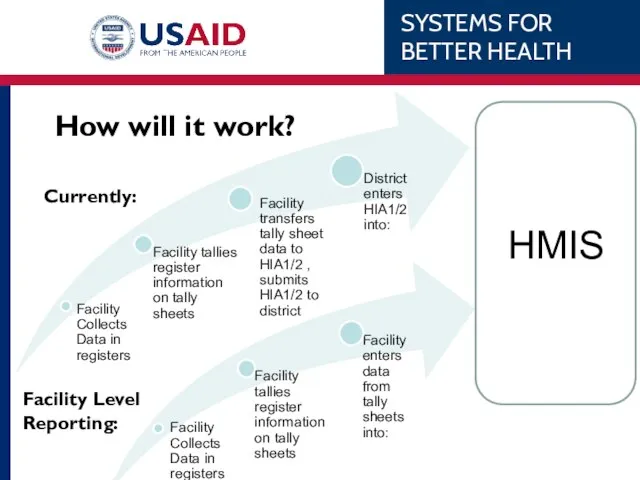
How will it work?
HMIS
Currently:
Facility Level Reporting:
How will it work?
HMIS
Currently:
Facility Level Reporting:
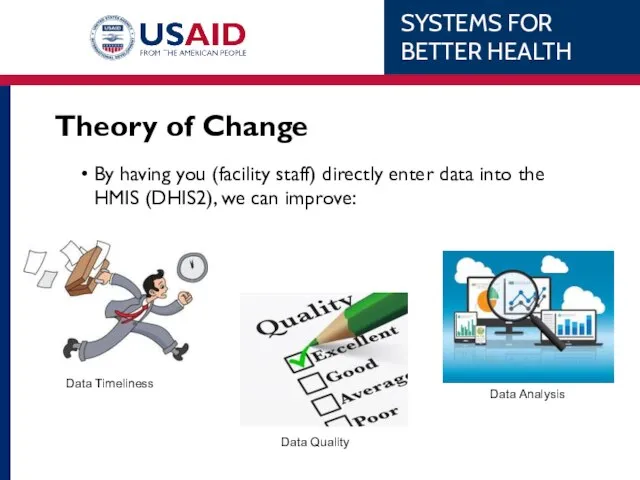
Theory of Change
By having you (facility staff) directly enter data into
Theory of Change
By having you (facility staff) directly enter data into
Key HMIS indicators
Understanding YOUR data
Key HMIS indicators
Understanding YOUR data
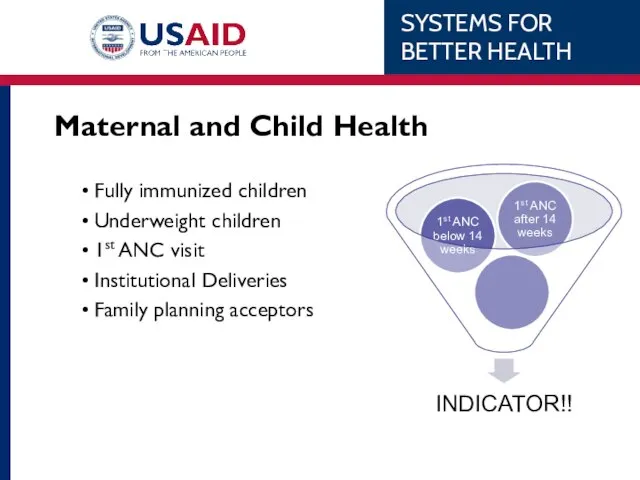
Maternal and Child Health
Fully immunized children
Underweight children
1st ANC visit
Institutional Deliveries
Family planning
Maternal and Child Health
Fully immunized children
Underweight children
1st ANC visit
Institutional Deliveries
Family planning
HIV/AIDS
PMTCT
Virology/Serology
General counselling and Testing
Current in ART
ART retention
VMMC
HIV/AIDS
PMTCT
Virology/Serology
General counselling and Testing
Current in ART
ART retention
VMMC
Tuberculosis
Notifications for TB
Percentage of Retreatment cases
Cure Rate
Mortality Rate
Commenced on ARVs
Commenced
Tuberculosis
Notifications for TB
Percentage of Retreatment cases
Cure Rate
Mortality Rate
Commenced on ARVs
Commenced
Sexually Transmitted Infections
STI cases
STI+ tested for HIV
Sexually Transmitted Infections
STI cases
STI+ tested for HIV
Adolescent/Reproductive Health
1st ANC <18yrs old (measures teen pregnancies)
HIV positive adolescents
Adolescents on
Adolescent/Reproductive Health
1st ANC <18yrs old (measures teen pregnancies)
HIV positive adolescents
Adolescents on
Malaria
Incidence/1000
Cases under 5
Cases over 5
Malaria
Incidence/1000
Cases under 5
Cases over 5
Your data collection tools
Understanding Facility Registers (DHIO to present)
Your data collection tools
Understanding Facility Registers (DHIO to present)
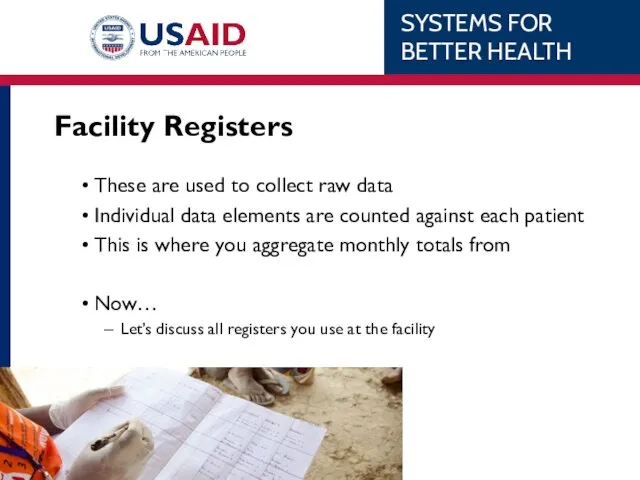
Facility Registers
These are used to collect raw data
Individual data elements are
Facility Registers
These are used to collect raw data
Individual data elements are
Tally Sheets
These “tally” up totals from registers
Consolidate register data into a
Tally Sheets
These “tally” up totals from registers
Consolidate register data into a
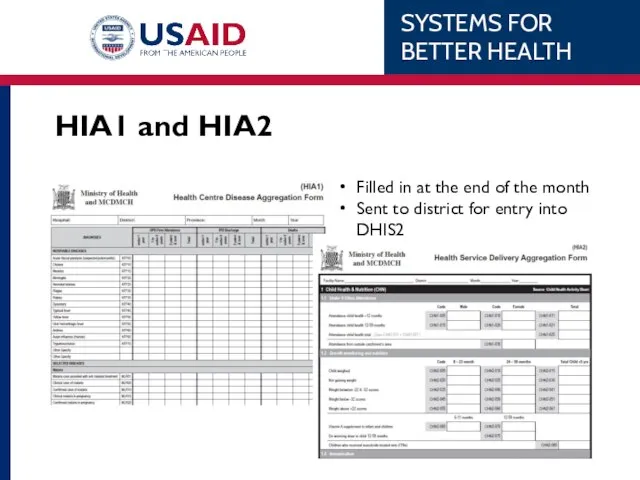
HIA1 and HIA2
Filled in at the end of the month
Sent to
HIA1 and HIA2
Filled in at the end of the month
Sent to
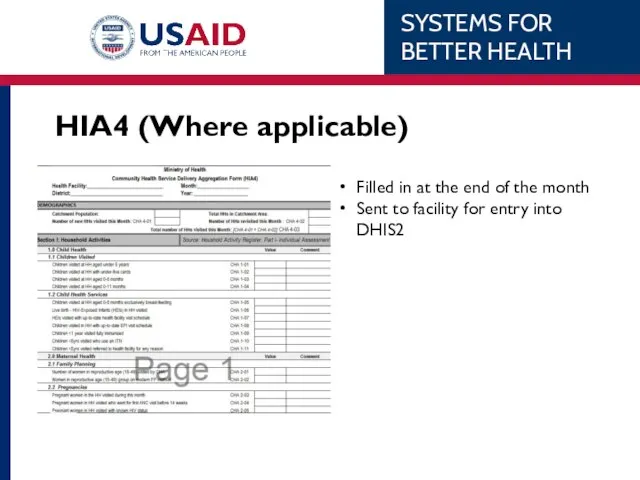
HIA4 (Where applicable)
Filled in at the end of the month
Sent to
HIA4 (Where applicable)
Filled in at the end of the month
Sent to
Exercise
Think about registers you have problems with. Depending on what the
Exercise
Think about registers you have problems with. Depending on what the
Tips for making the collection and troubleshooting process easier
Fill in data
Tips for making the collection and troubleshooting process easier
Fill in data
Data Quality
Data Quality
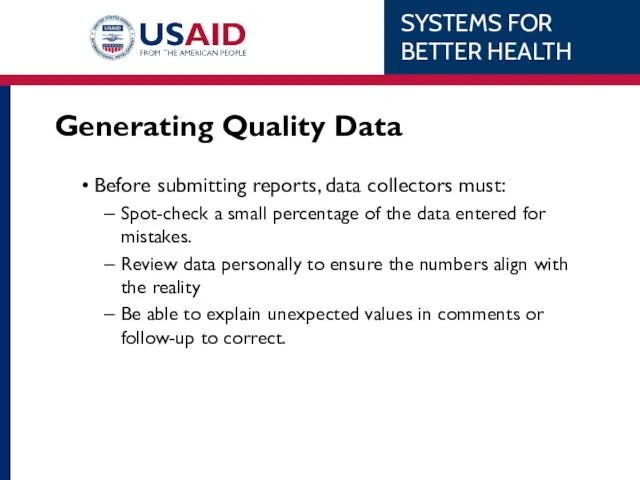
Generating Quality Data
Before submitting reports, data collectors must:
Spot-check a small percentage
Generating Quality Data
Before submitting reports, data collectors must:
Spot-check a small percentage
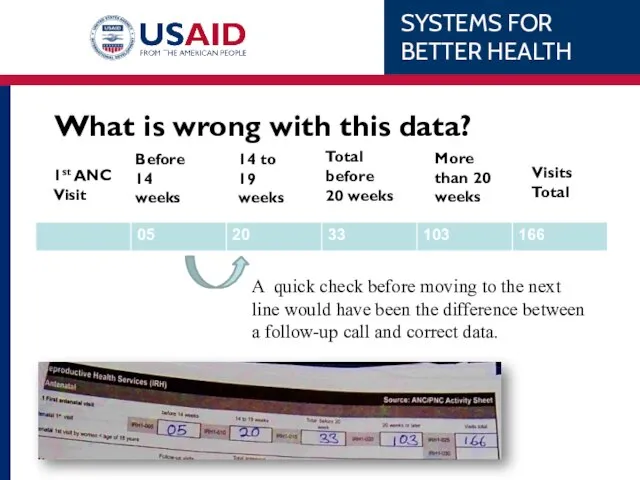
What is wrong with this data?
What is wrong with this data?
Exercise
Use the registers and tally sheets you brought with you to
Exercise
Use the registers and tally sheets you brought with you to
Day 2
Into DHIS2 -- creating charts and pivot tables, saving favorites,
Day 2
Into DHIS2 -- creating charts and pivot tables, saving favorites,
What is DHIS2?
District Health Information System
Open source software
Born out of HISP
Zambia’s
What is DHIS2?
District Health Information System
Open source software
Born out of HISP
Zambia’s
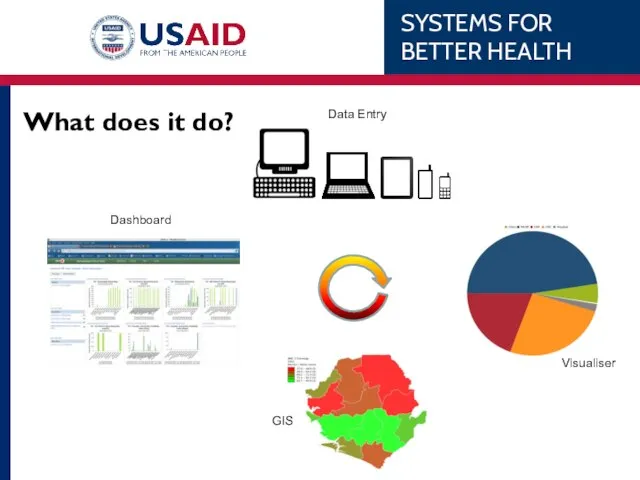
What does it do?
What does it do?
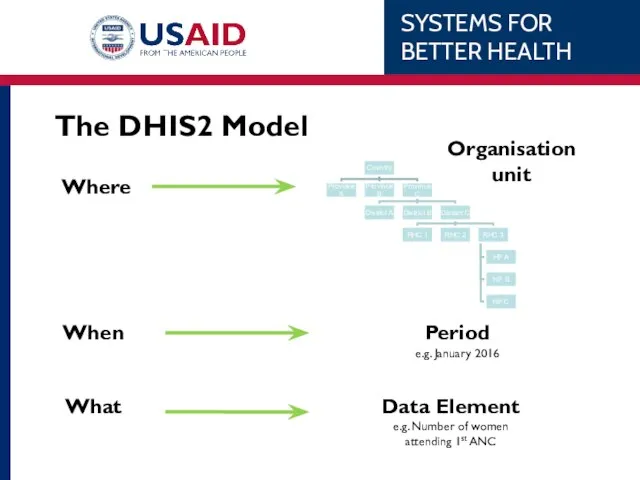
The DHIS2 Model
The DHIS2 Model
Pivot Tables
Module:
Pivot Tables
Module:
A pivot table is …
A tool that allows you to reorganize
A pivot table is …
A tool that allows you to reorganize
A pivot table is …
The foundation of
Data aggregation
Data analysis
Data
A pivot table is …
The foundation of
Data aggregation
Data analysis
Data
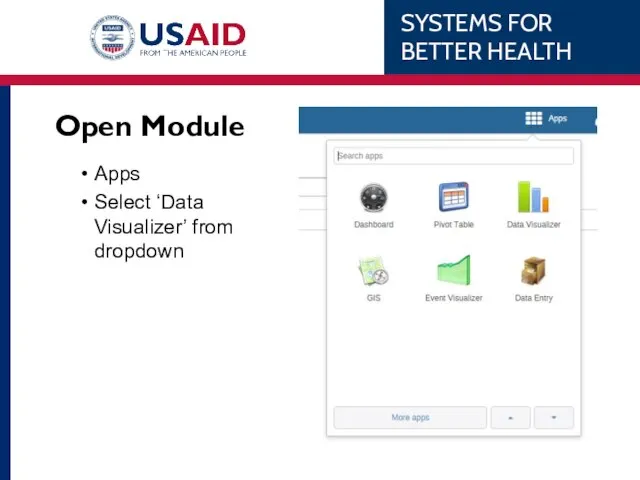
Open Module
Apps
Select ‘Pivot Table’ from dropdown
Open Module
Apps
Select ‘Pivot Table’ from dropdown
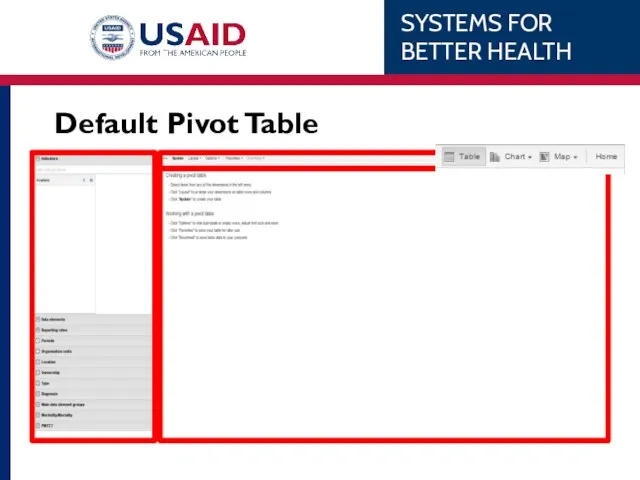
Default Pivot Table
Default Pivot Table
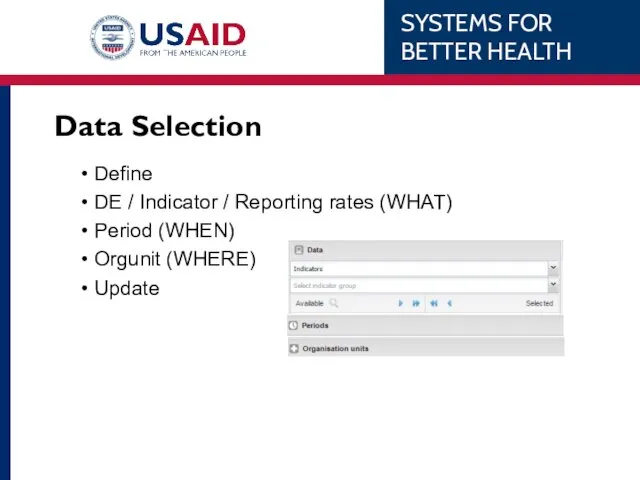
Data Selection
Define
DE / Indicator / Reporting rates (WHAT)
Period (WHEN)
Orgunit (WHERE)
Update
Data Selection
Define
DE / Indicator / Reporting rates (WHAT)
Period (WHEN)
Orgunit (WHERE)
Update
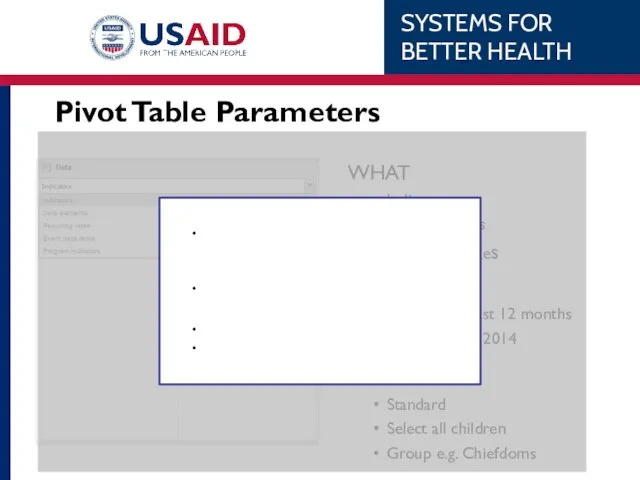
WHAT
Indicator
Data Elements
Reporting Rates
WHEN
Relative e.g. last 12 months
Fixed e.g. Feb 2014
WHERE
Standard
Select
WHAT
Indicator
Data Elements
Reporting Rates
WHEN
Relative e.g. last 12 months
Fixed e.g. Feb 2014
WHERE
Standard
Select
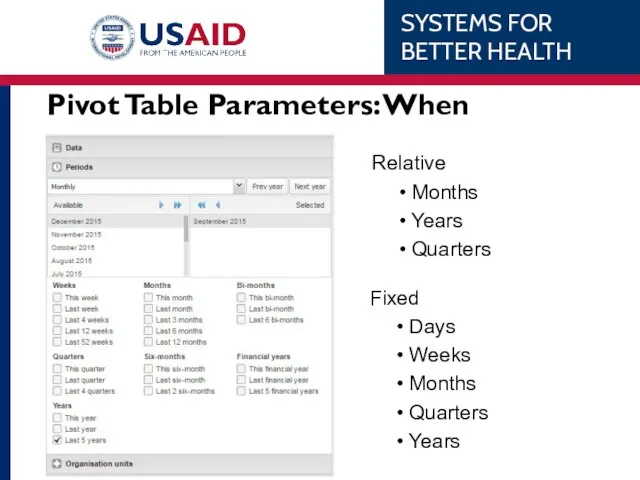
Pivot Table Parameters: When
Relative
Months
Years
Quarters
Fixed
Days
Weeks
Months
Quarters
Years
Pivot Table Parameters: When
Relative
Months
Years
Quarters
Fixed
Days
Weeks
Months
Quarters
Years
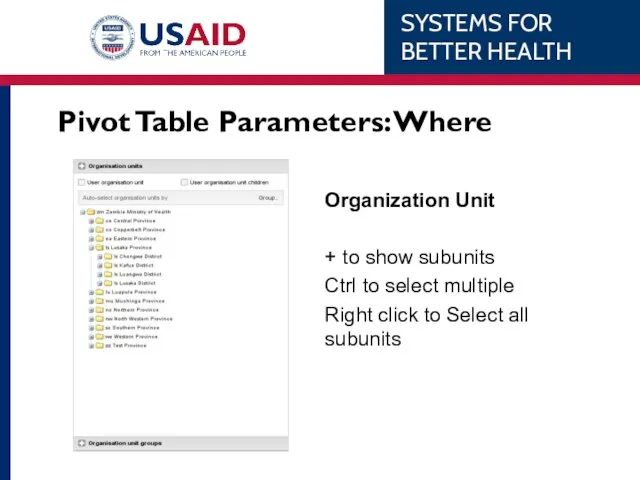
Pivot Table Parameters: Where
Organization Unit
+ to show subunits
Ctrl to select multiple
Right
Pivot Table Parameters: Where
Organization Unit
+ to show subunits
Ctrl to select multiple
Right
Harmony RHC
Harmony RHC
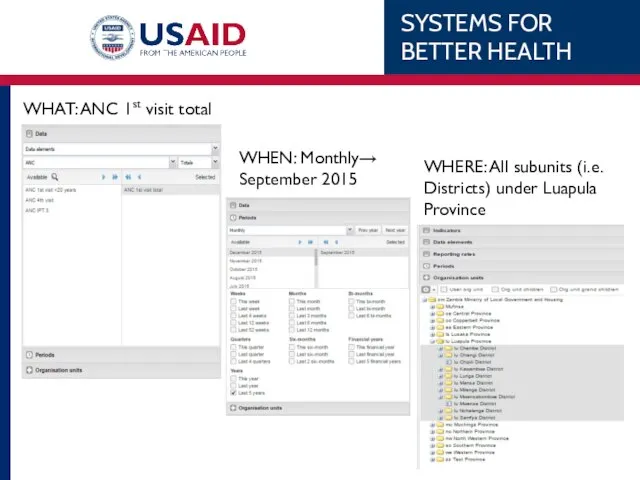
WHEN: Monthly→ September 2015
WHERE: All subunits (i.e. Districts) under Luapula Province
WHAT:
WHEN: Monthly→ September 2015
WHERE: All subunits (i.e. Districts) under Luapula Province
WHAT:
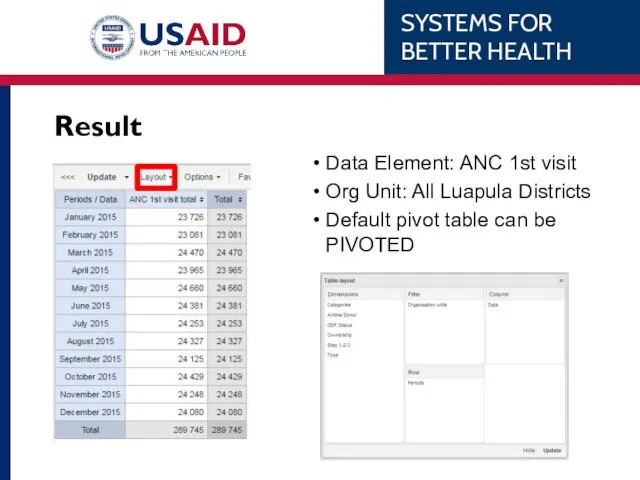
Result
Data Element: ANC 1st visit
Org Unit: All Luapula Districts
Default pivot table
Result
Data Element: ANC 1st visit
Org Unit: All Luapula Districts
Default pivot table
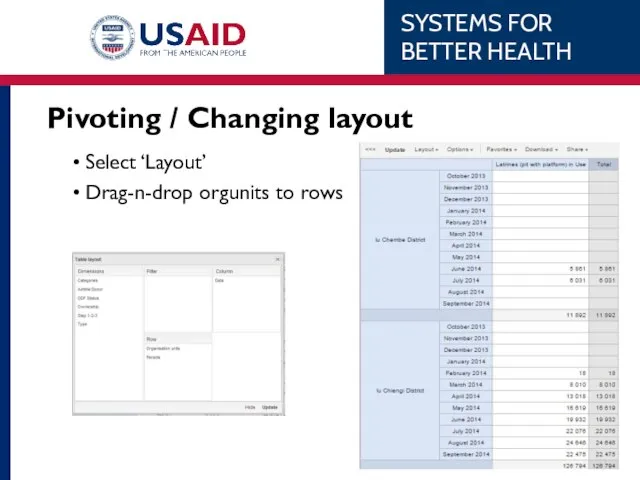
Pivoting / Changing layout
Select ‘Layout’
Drag-n-drop orgunits to rows
Pivoting / Changing layout
Select ‘Layout’
Drag-n-drop orgunits to rows
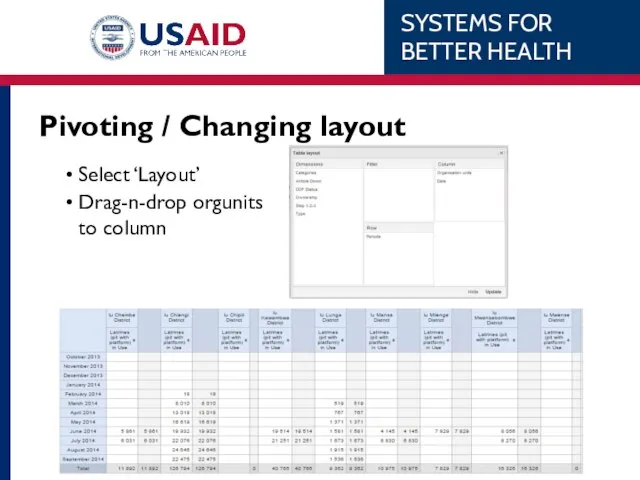
Pivoting / Changing layout
Select ‘Layout’
Drag-n-drop orgunits to column
Pivoting / Changing layout
Select ‘Layout’
Drag-n-drop orgunits to column
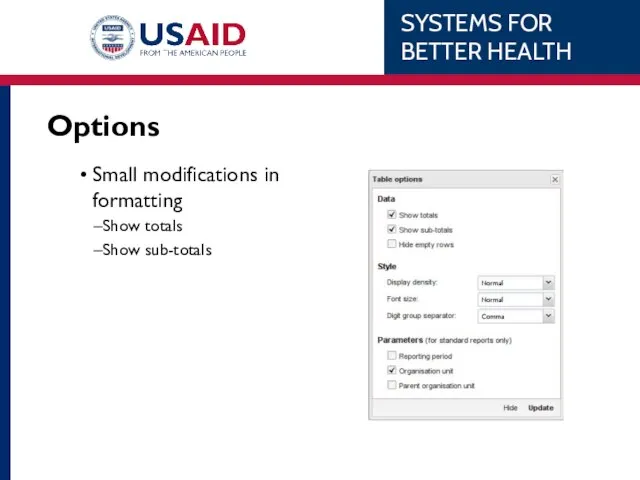
Options
Small modifications in formatting
Show totals
Show sub-totals
Options
Small modifications in formatting
Show totals
Show sub-totals
Worked Example…
Worked Example…
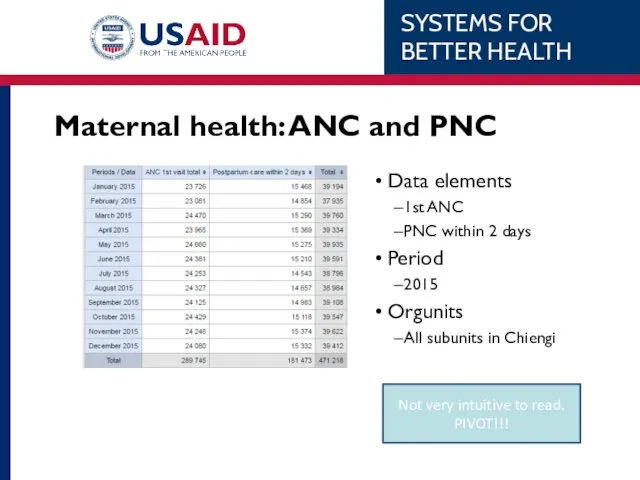
Not very intuitive to read. PIVOT!!!
Maternal health: ANC and PNC
Data elements
1st
Not very intuitive to read. PIVOT!!!
Maternal health: ANC and PNC
Data elements
1st
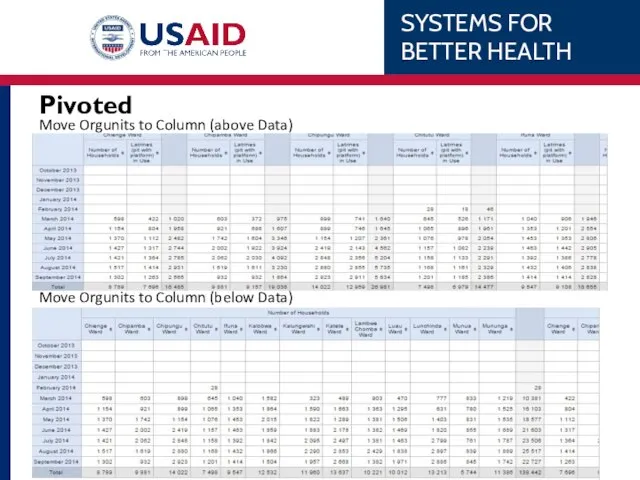
Move Orgunits to Column (below Data)
Move Orgunits to Column (above Data)
Pivoted
Move Orgunits to Column (below Data)
Move Orgunits to Column (above Data)
Pivoted
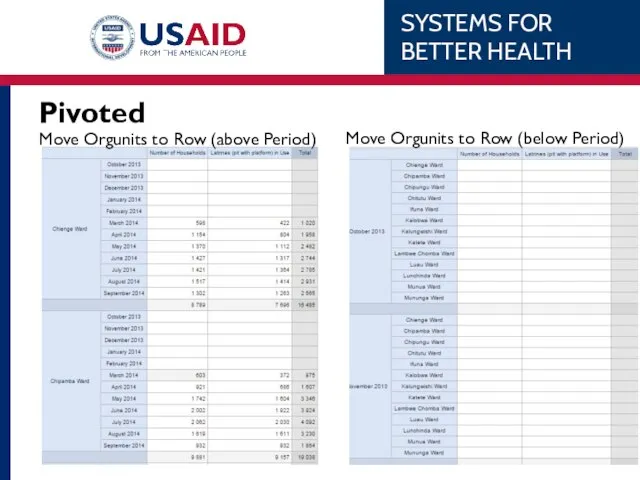
Pivoted
Move Orgunits to Row (above Period)
Move Orgunits to Row (below Period)
Pivoted
Move Orgunits to Row (above Period)
Move Orgunits to Row (below Period)
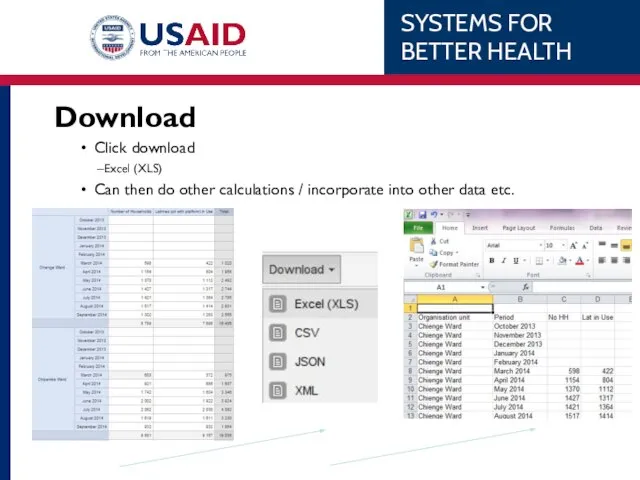
Download
Click download
Excel (XLS)
Can then do other calculations / incorporate into other
Download
Click download
Excel (XLS)
Can then do other calculations / incorporate into other
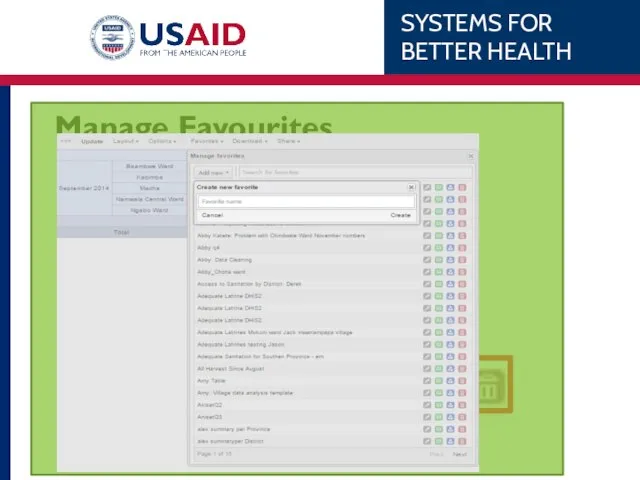
Manage Favourites
Add New
Open saved chart
Rename
Overwrite
Share
Delete
Manage Favourites
Add New
Open saved chart
Rename
Overwrite
Share
Delete
Exercise Sheet
Work through each example on the worksheet
Don’t skip any sections
Ask
Exercise Sheet
Work through each example on the worksheet
Don’t skip any sections
Ask
Charts
Module:
Charts
Module:
Overview
Charts, graphs, and tables provide a great deal of visual
Overview
Charts, graphs, and tables provide a great deal of visual
Overview cont’d
In educational settings, charts, graphs, and tables can be
Overview cont’d
In educational settings, charts, graphs, and tables can be
Six things conveyed by charts & graphs
Comparisons
Relationships
Distribution
Trends
Composition
Flow/process, or
Six things conveyed by charts & graphs
Comparisons
Relationships
Distribution
Trends
Composition
Flow/process, or
Reasons for creating charts and graphs
Make important trends easily recognizable
Allow users
Reasons for creating charts and graphs
Make important trends easily recognizable
Allow users
Charting considerations
Type of data
Purpose of the data
Nature of the data or
Charting considerations
Type of data
Purpose of the data
Nature of the data or
Open Module
Apps
Select ‘Data Visualizer’ from dropdown
Open Module
Apps
Select ‘Data Visualizer’ from dropdown
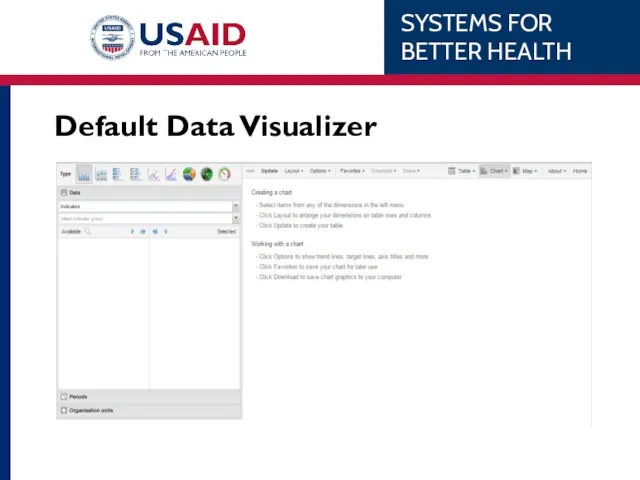
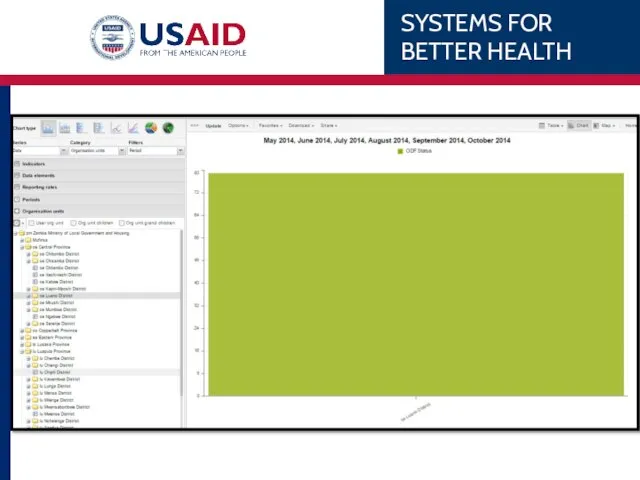
Default Data Visualizer
Default Data Visualizer
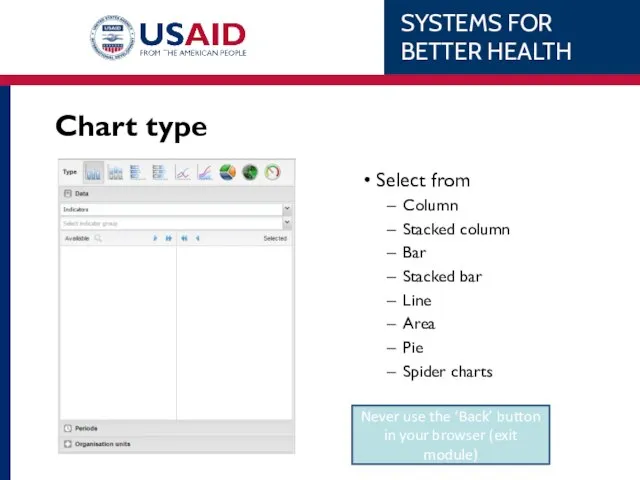
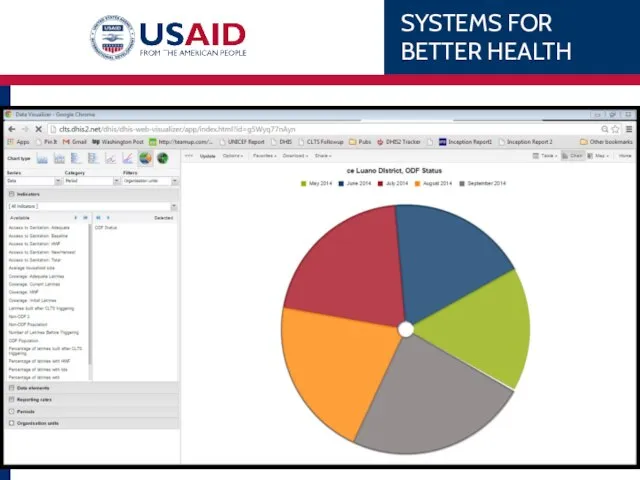
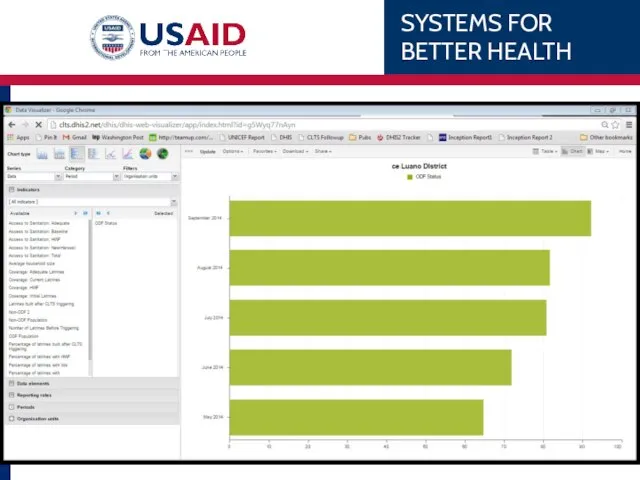
Chart type
Select from
Column
Stacked column
Bar
Stacked bar
Line
Area
Pie
Spider charts
Never use the ‘Back’ button
Chart type
Select from
Column
Stacked column
Bar
Stacked bar
Line
Area
Pie
Spider charts
Never use the ‘Back’ button
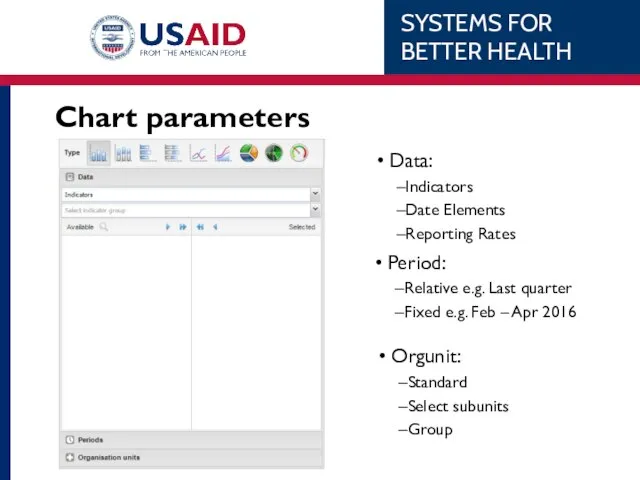
Chart parameters
Data:
Indicators
Date Elements
Reporting Rates
Period:
Relative e.g. Last quarter
Fixed e.g.
Chart parameters
Data:
Indicators
Date Elements
Reporting Rates
Period:
Relative e.g. Last quarter
Fixed e.g.
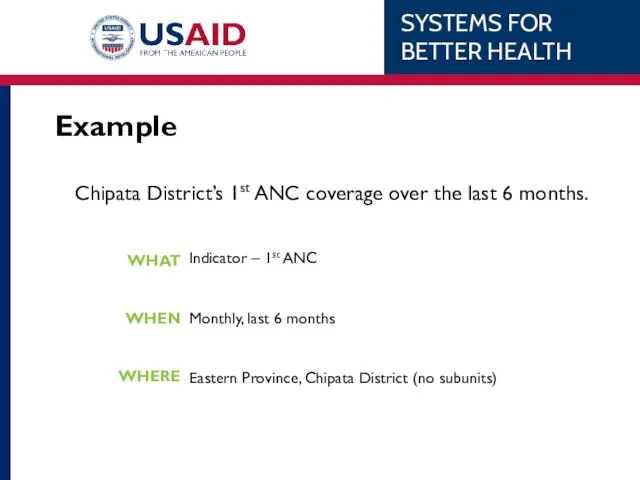
Example
Chipata District’s 1st ANC coverage over the last 6 months.
WHAT
WHEN
WHERE
Indicator –
Example
Chipata District’s 1st ANC coverage over the last 6 months.
WHAT
WHEN
WHERE
Indicator –
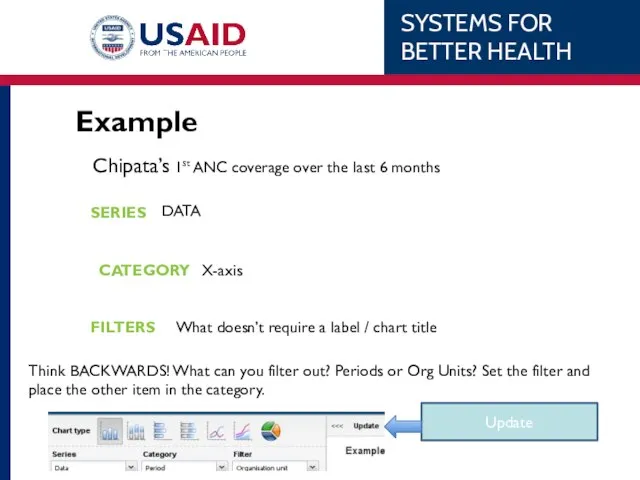
Example
Chipata’s 1st ANC coverage over the last 6 months
SERIES
CATEGORY
FILTERS
DATA
X-axis
What
Example
Chipata’s 1st ANC coverage over the last 6 months
SERIES
CATEGORY
FILTERS
DATA
X-axis
What
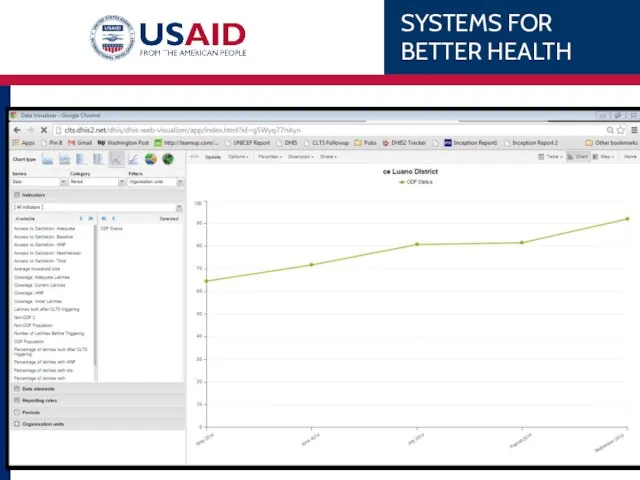
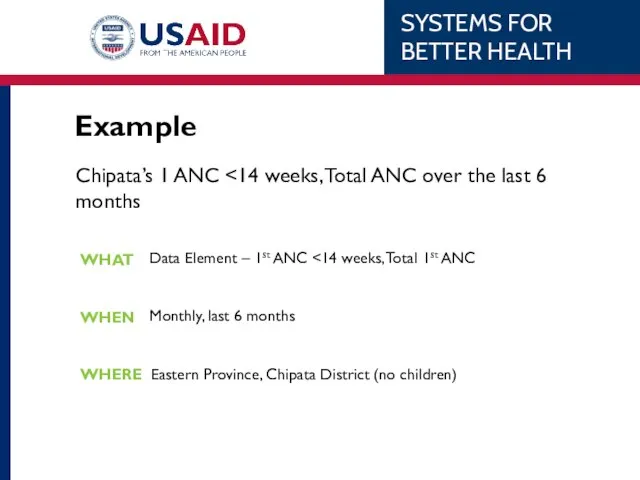
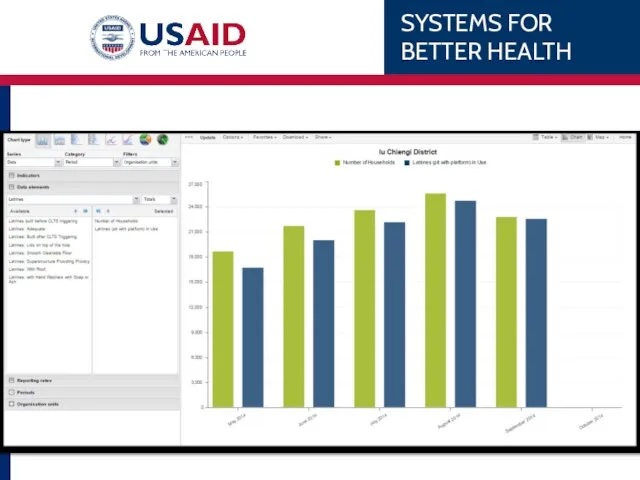
Chipata’s 1 ANC <14 weeks, Total ANC over the last 6
Chipata’s 1 ANC <14 weeks, Total ANC over the last 6
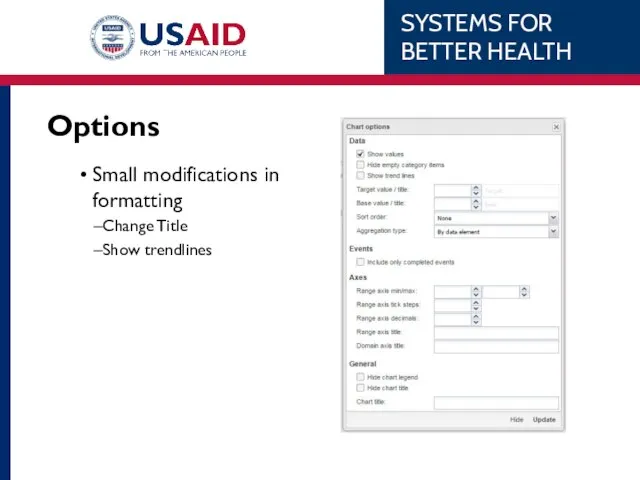
Options
Small modifications in formatting
Change Title
Show trendlines
Options
Small modifications in formatting
Change Title
Show trendlines
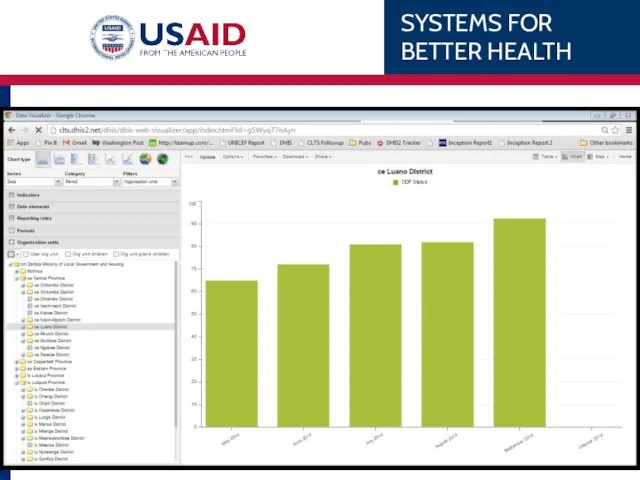
Worked example …
Worked example …
Open a saved chart
Go to:
Favorites
Search for “Choma Reporting rates”
Select Title
Open a saved chart
Go to:
Favorites
Search for “Choma Reporting rates”
Select Title
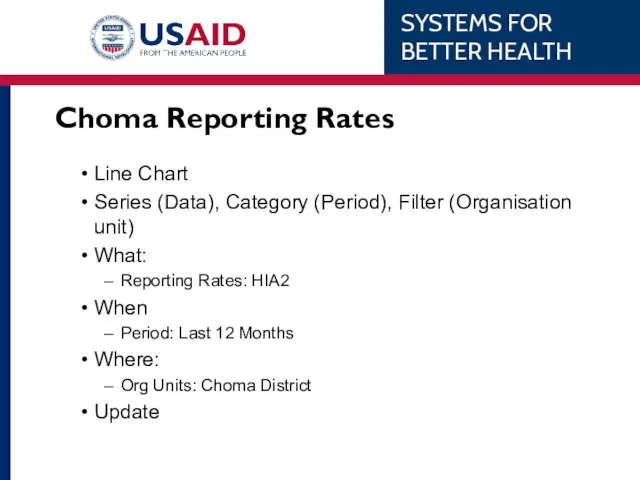
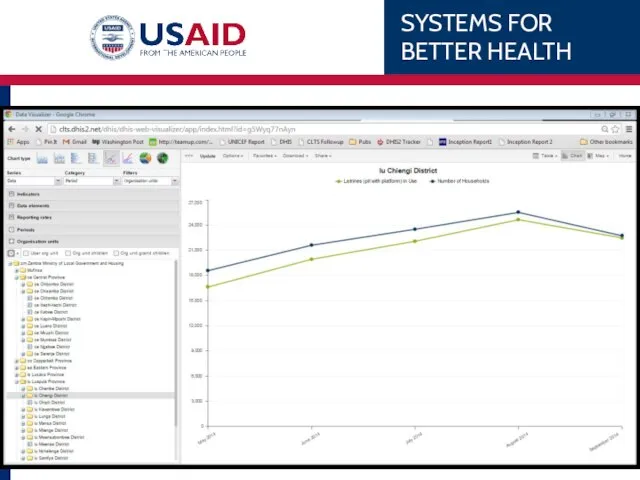
Choma Reporting Rates
Line Chart
Series (Data), Category (Period), Filter (Organisation unit)
What:
Reporting
Choma Reporting Rates
Line Chart
Series (Data), Category (Period), Filter (Organisation unit)
What:
Reporting
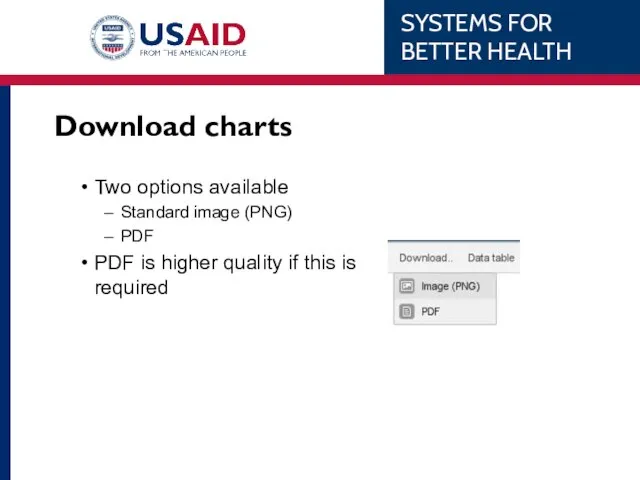
Download charts
Two options available
Standard image (PNG)
PDF
PDF is higher quality if this
Download charts
Two options available
Standard image (PNG)
PDF
PDF is higher quality if this
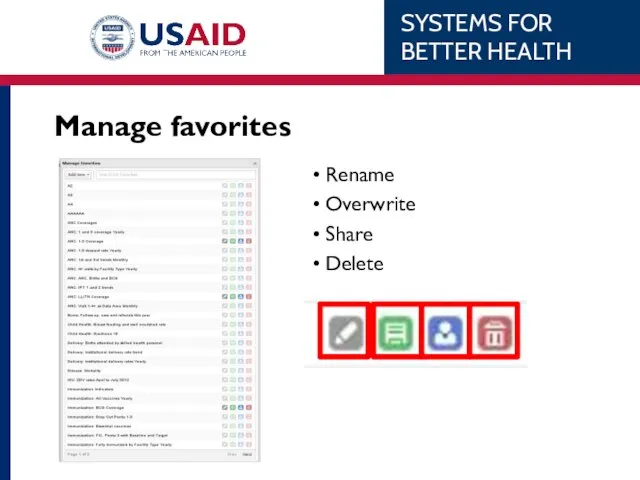
Manage favorites
Rename
Overwrite
Share
Delete
Manage favorites
Rename
Overwrite
Share
Delete
Exercise Sheet
Work through each example on the work sheet
Don’t skip any
Exercise Sheet
Work through each example on the work sheet
Don’t skip any
Data Entry
Module
Data Entry
Module
When to do data entry
Entering HIA 1 and 2 forms
Suggested 1
When to do data entry
Entering HIA 1 and 2 forms
Suggested 1
WARNING!
Data entry is live
No undo button
I error in population data impacts
WARNING!
Data entry is live
No undo button
I error in population data impacts
HOW
Apps > Data Entry
HOW
Apps > Data Entry

HOW
Select facility
Select Form
Select Period
Enter Data
HOW
Select facility
Select Form
Select Period
Enter Data
Worked Examples
Use the tally sheets you brought from your facility to
Worked Examples
Use the tally sheets you brought from your facility to
Group Discussion
Feedback
Closing
Group Discussion
Feedback
Closing
 Распространение и методика профилактики зооантропозонозов в Яковлевском городском округе (на примере бешенства)
 Патобиохимия печени
 Семейная амавротическая идиотия
 Стероидный остеопороз при эндогенном гиперкортицизме
 Влияние пива на организм человека
 Тілдік қатынас негіздері. Ғылыми негіздер
 Участие медицинских сестер в организации и проведении вакцинопрофилактики детскому населению
 Классификация ВОЗ инфекционных болезней, передающихся половым путём. Первичный период сифилиса
 Внелегочный туберкулез. 2
 Острый холецистит
 Об этом должен знать каждый
 Клинико-лабораторная характеристика энтеровирусных менингитов у детей
 Познай себя в своих друзьях (игровой тренинг)
 Деменція
 Канцерогенездің иммунды генетикалық аспектілері. Онкологиялық науқастардың иммунды статусының ерекшеліктері
 Ткани зуба
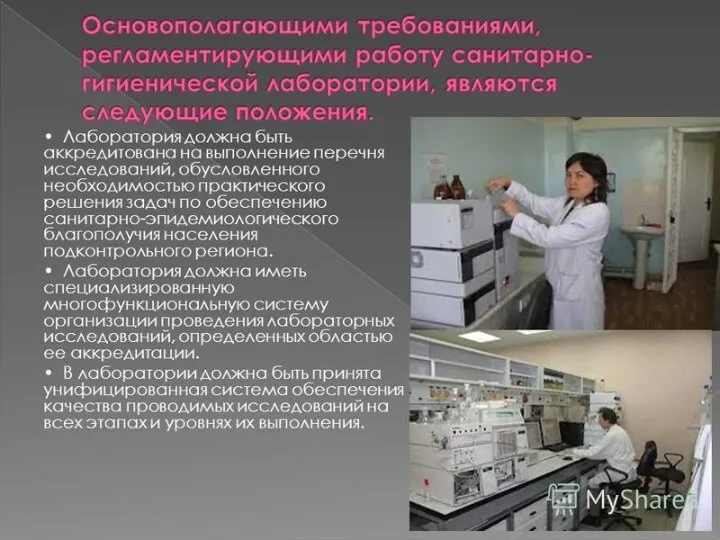 Основополагающие требования, регламентирующие работу санитарно-гигиенической лаборатории
 Изменения, вносимые в действующие формы федерального изменения в медицине
 Психическое развития детей с нарушениями интеллекта. (Лекция 4)
 Первинна, вторинна і третинна профілактика в стоматології
 Хирургическая анатомия грудной стенки и молочной железы. Оперативная хирургия грудной клетки и молочной железы
 Политравма. Периоды травматической болезни
 Лекарственная аллергия. (Лекция №1)
 Болезнь Фабри-Андерсона: клиническая картина, диагностика, клинические наблюдения
 Формирование конструктивных моделей взаимодействия в детско-родительских отношениях
 Структуры желчевыводящих путей
 Клинический случай меланомы
 Биотрансформация ксенобиотиков, ядов в организме