- Overview of Working Capital Management

Содержание
- 2. After studying Chapter 8, you should be able to: Explain how the definition of "working capital"
- 3. Overview of Working Capital Management Working Capital Concepts Working Capital Issues Financing Current Assets: Short-Term and
- 4. Working Capital Concepts Net Working Capital Current Assets - Current Liabilities. Gross Working Capital The firm’s
- 5. Significance of Working Capital Management In a typical manufacturing firm, current assets exceed one-half of total
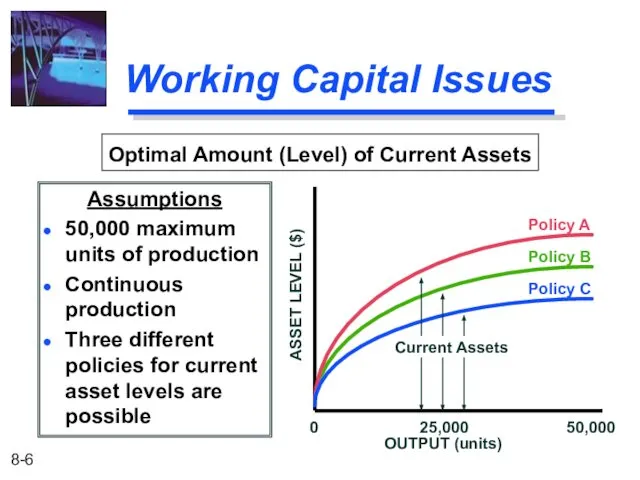
- 6. Working Capital Issues Assumptions 50,000 maximum units of production Continuous production Three different policies for current
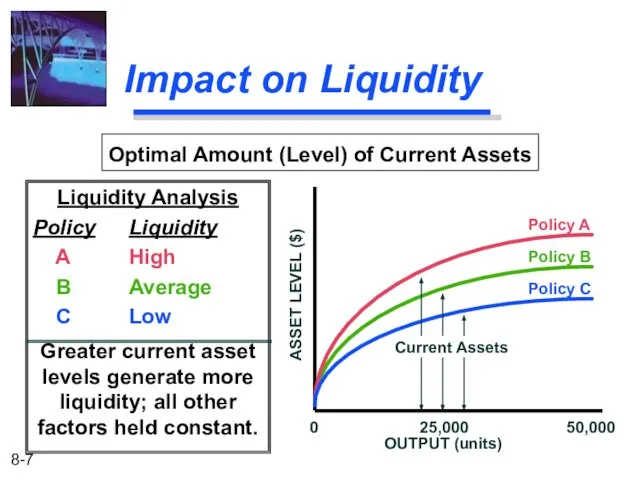
- 7. Impact on Liquidity Liquidity Analysis Policy Liquidity A High B Average C Low Greater current asset
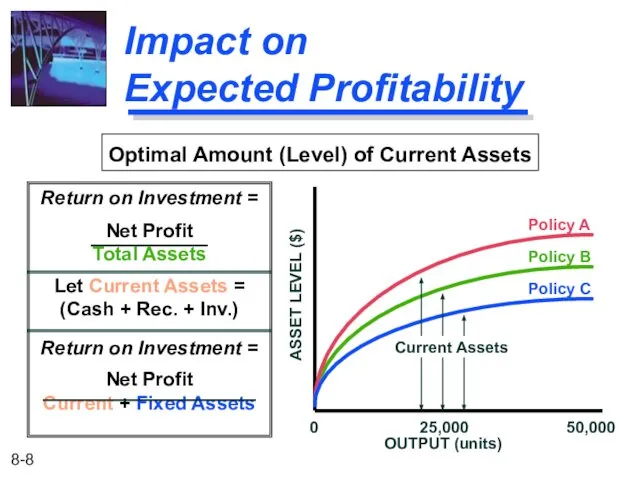
- 8. Impact on Expected Profitability Return on Investment = Net Profit Total Assets Let Current Assets =
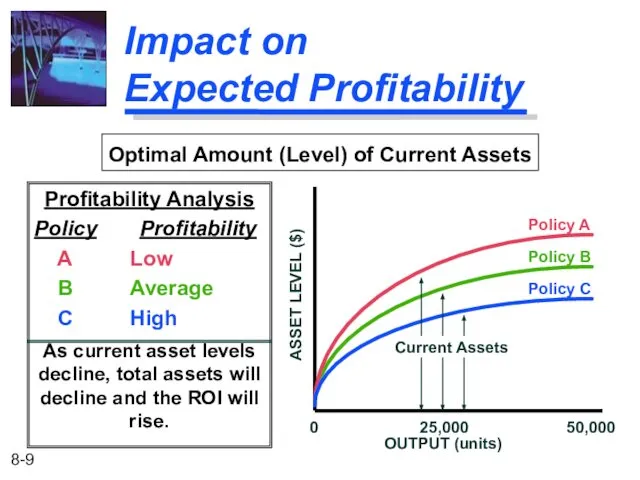
- 9. Impact on Expected Profitability Profitability Analysis Policy Profitability A Low B Average C High As current
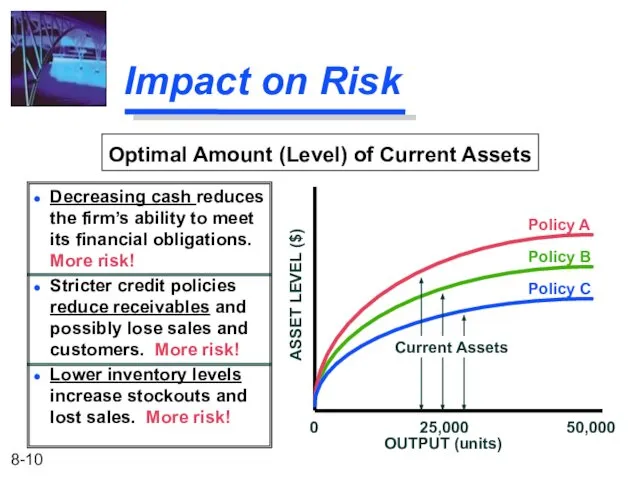
- 10. Impact on Risk Decreasing cash reduces the firm’s ability to meet its financial obligations. More risk!
- 11. Impact on Risk Risk Analysis Policy Risk A Low B Average C High Risk increases as
- 12. Summary of the Optimal Amount of Current Assets SUMMARY OF OPTIMAL CURRENT ASSET ANALYSIS Policy Liquidity
- 13. Classifications of Working Capital Time Permanent Temporary Components Cash, marketable securities, receivables, and inventory
- 14. Permanent Working Capital The amount of current assets required to meet a firm’s long-term minimum needs.
- 15. Temporary Working Capital The amount of current assets that varies with seasonal requirements. Permanent current assets
- 16. Financing Current Assets: Short-Term and Long-Term Mix Spontaneous Financing: Trade credit, and other payables and accruals,
- 17. Hedging (or Maturity Matching) Approach A method of financing where each asset would be offset with
- 18. Hedging (or Maturity Matching) Approach * Less amount financed spontaneously by payables and accruals. ** In
- 19. Financing Needs and the Hedging Approach Fixed assets and the non-seasonal portion of current assets are
- 20. Self-Liquidating Nature of Short-Term Loans Seasonal orders require the purchase of inventory beyond current levels. Increased
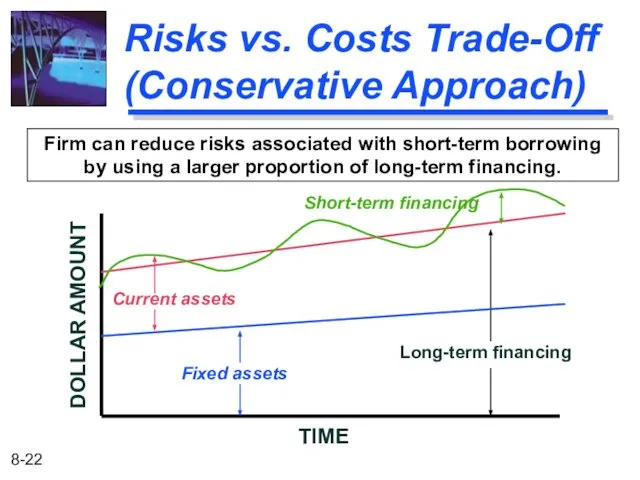
- 21. Risks vs. Costs Trade-Off (Conservative Approach) Long-Term Financing Benefits Less worry in refinancing short-term obligations Less
- 22. Risks vs. Costs Trade-Off (Conservative Approach) Firm can reduce risks associated with short-term borrowing by using
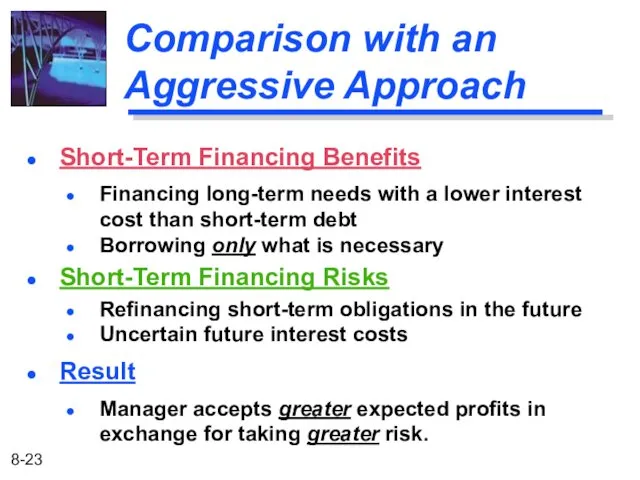
- 23. Comparison with an Aggressive Approach Short-Term Financing Benefits Financing long-term needs with a lower interest cost
- 24. Firm increases risks associated with short-term borrowing by using a larger proportion of short-term financing. TIME
- 25. Summary of Short- vs. Long-Term Financing Financing Maturity Asset Maturity SHORT-TERM LONG-TERM Low Risk-Profitability Moderate Risk-Profitability
- 27. Скачать презентацию
After studying Chapter 8, you should be able to:
Explain how the
After studying Chapter 8, you should be able to:
Explain how the
Overview of Working Capital Management
Working Capital Concepts
Working Capital Issues
Financing Current Assets:
Overview of Working Capital Management
Working Capital Concepts
Working Capital Issues
Financing Current Assets:
Working Capital Concepts
Net Working Capital
Current Assets - Current Liabilities.
Gross Working Capital
The
Working Capital Concepts
Net Working Capital
Current Assets - Current Liabilities.
Gross Working Capital
The
Significance of Working Capital Management
In a typical manufacturing firm, current assets
Significance of Working Capital Management
In a typical manufacturing firm, current assets
Working Capital Issues
Assumptions
50,000 maximum units of production
Continuous production
Three different policies for
Working Capital Issues
Assumptions
50,000 maximum units of production
Continuous production
Three different policies for
Impact on Liquidity
Liquidity Analysis
Policy Liquidity
A High
B Average
C Low
Greater current asset levels generate
Impact on Liquidity
Liquidity Analysis
Policy Liquidity
A High
B Average
C Low
Greater current asset levels generate
Impact on
Expected Profitability
Return on Investment =
Net Profit
Total Assets
Let Current Assets
Impact on
Expected Profitability
Return on Investment =
Net Profit
Total Assets
Let Current Assets
Impact on
Expected Profitability
Profitability Analysis
Policy Profitability
A Low
B Average
C High
As current asset
Impact on
Expected Profitability
Profitability Analysis
Policy Profitability
A Low
B Average
C High
As current asset
Impact on Risk
Decreasing cash reduces the firm’s ability to meet its
Impact on Risk
Decreasing cash reduces the firm’s ability to meet its
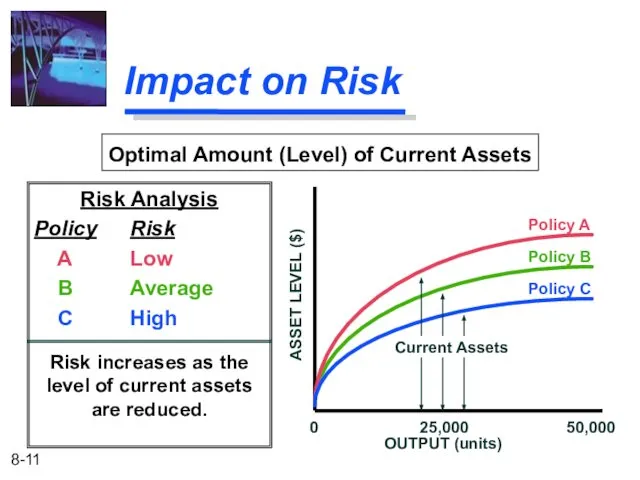
Impact on Risk
Risk Analysis
Policy Risk
A Low
B Average
C High
Risk increases as the level
Impact on Risk
Risk Analysis
Policy Risk
A Low
B Average
C High
Risk increases as the level
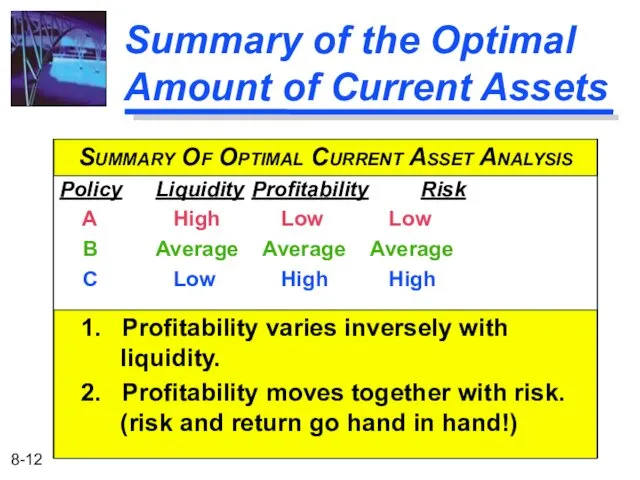
Summary of the Optimal Amount of Current Assets
SUMMARY OF OPTIMAL CURRENT
Summary of the Optimal Amount of Current Assets
SUMMARY OF OPTIMAL CURRENT
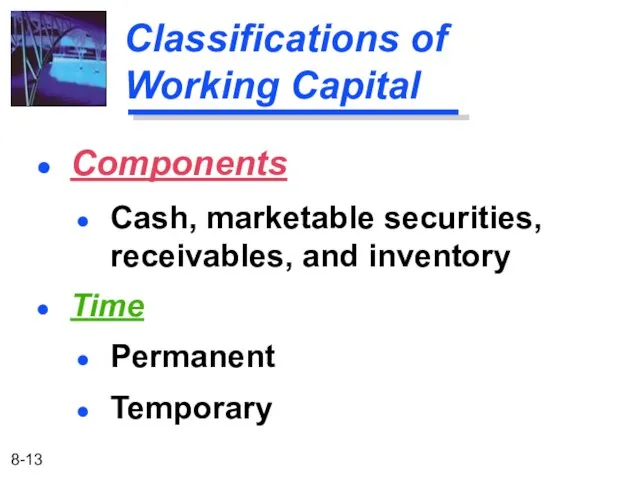
Classifications of Working Capital
Time
Permanent
Temporary
Components
Cash, marketable securities, receivables, and inventory
Classifications of Working Capital
Time
Permanent
Temporary
Components
Cash, marketable securities, receivables, and inventory
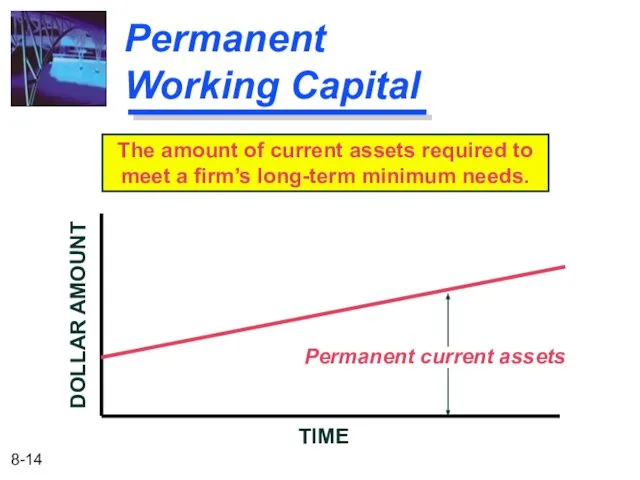
Permanent Working Capital
The amount of current assets required to meet a
Permanent Working Capital
The amount of current assets required to meet a
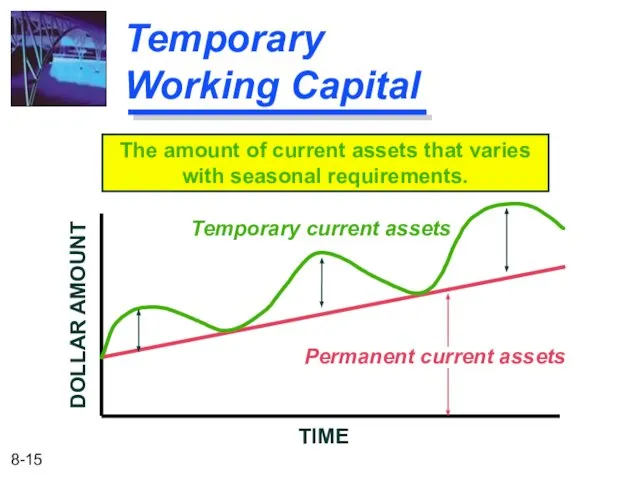
Temporary Working Capital
The amount of current assets that varies with seasonal
Temporary Working Capital
The amount of current assets that varies with seasonal
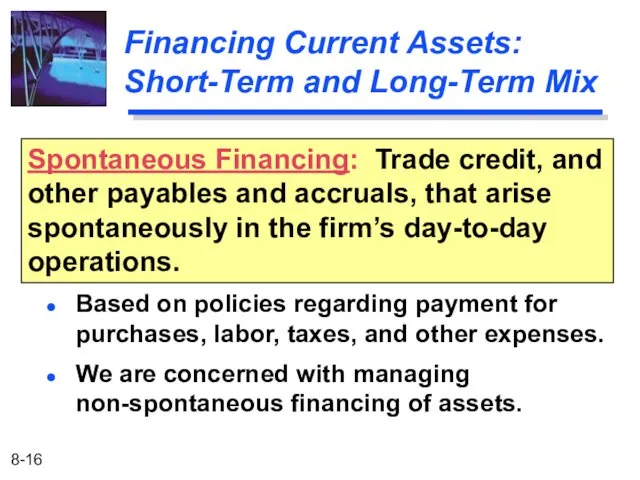
Financing Current Assets: Short-Term and Long-Term Mix
Spontaneous Financing: Trade credit, and
Financing Current Assets: Short-Term and Long-Term Mix
Spontaneous Financing: Trade credit, and
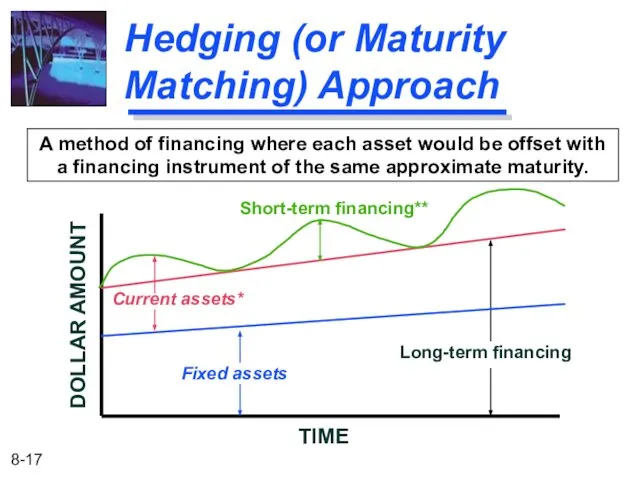
Hedging (or Maturity Matching) Approach
A method of financing where each asset
Hedging (or Maturity Matching) Approach
A method of financing where each asset
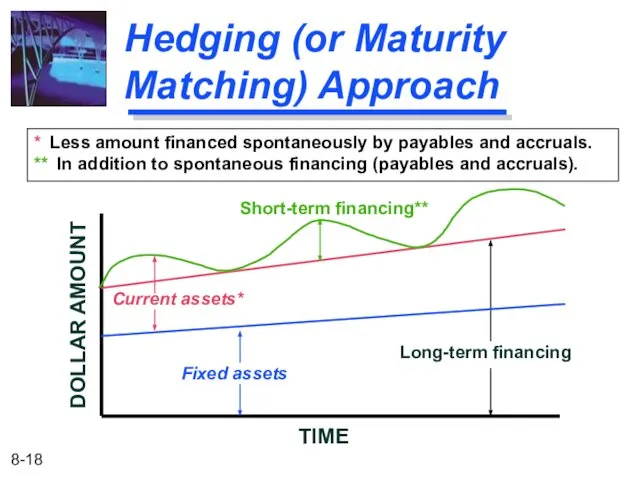
Hedging (or Maturity Matching) Approach
* Less amount financed spontaneously by payables
Hedging (or Maturity Matching) Approach
* Less amount financed spontaneously by payables
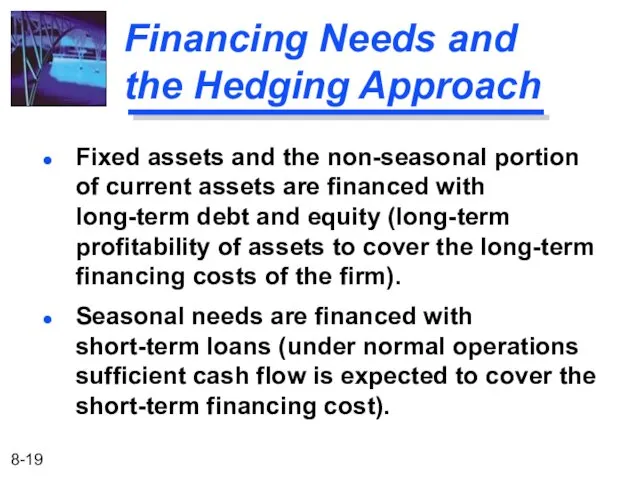
Financing Needs and
the Hedging Approach
Fixed assets and the non-seasonal portion
Financing Needs and
the Hedging Approach
Fixed assets and the non-seasonal portion
Self-Liquidating Nature of Short-Term Loans
Seasonal orders require the purchase of inventory
Self-Liquidating Nature of Short-Term Loans
Seasonal orders require the purchase of inventory
Risks vs. Costs Trade-Off (Conservative Approach)
Long-Term Financing Benefits
Less worry in refinancing
Risks vs. Costs Trade-Off (Conservative Approach)
Long-Term Financing Benefits
Less worry in refinancing
Risks vs. Costs Trade-Off (Conservative Approach)
Firm can reduce risks associated with
Risks vs. Costs Trade-Off (Conservative Approach)
Firm can reduce risks associated with
Comparison with an Aggressive Approach
Short-Term Financing Benefits
Financing long-term needs with a
Comparison with an Aggressive Approach
Short-Term Financing Benefits
Financing long-term needs with a
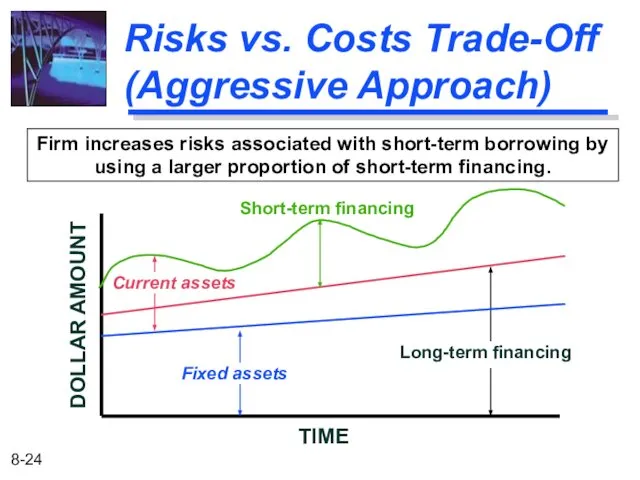
Firm increases risks associated with short-term borrowing by using a larger
Firm increases risks associated with short-term borrowing by using a larger
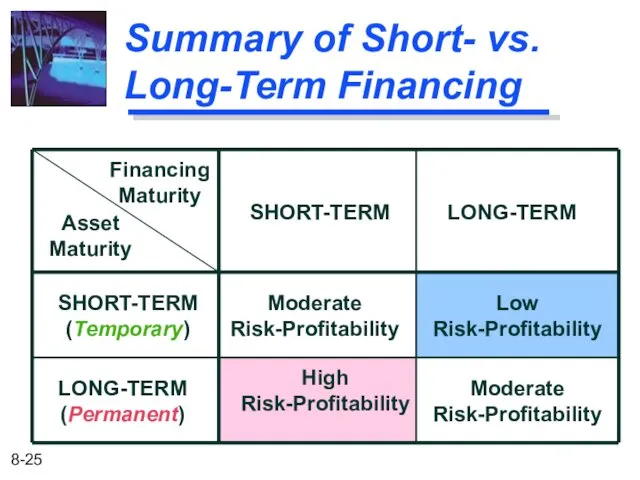
Summary of Short- vs. Long-Term Financing
Financing
Maturity
Asset
Maturity
SHORT-TERM
LONG-TERM
Low
Risk-Profitability
Moderate
Risk-Profitability
Moderate
Risk-Profitability
High
Risk-Profitability
SHORT-TERM
(Temporary)
LONG-TERM
(Permanent)
Summary of Short- vs. Long-Term Financing
Financing
Maturity
Asset
Maturity
SHORT-TERM
LONG-TERM
Low
Risk-Profitability
Moderate
Risk-Profitability
Moderate
Risk-Profitability
High
Risk-Profitability
SHORT-TERM
(Temporary)
LONG-TERM
(Permanent)
 Проектная деятельность в образовании. Управление проектами
 Второй этап работы над проектом: организация групп, роли в команде
 Реструктуризация управления компанией
 Трудовая адаптация персонала
 Глобальные системы резервирования как эффективные рекламные технологии
 Организационная культура
 Мотивация СМЗ 2.0
 Manager`s proffesional skils and personality traids
 Тәуекел менеджментінің базалық тұжырымдамалыры және көрсеткіштері
 Мотивация как функция управления
 Форматы мероприятий
 Сутність туристичних формальностей
 Мотивация
 Внедрение автоматизированной подсистемы управления персоналом
 Работа менеджера в организации
 Сущность управленческих отношений в организации
 Гостиница Базилика
 Бизнес процессы. Отдел продаж. Производство
 Стратегический подход к управлению изменениями
 Понятие и характеристика затрат в логистической деятельности
 Административная (классическая) школа менеджмента
 Использование информационных технологий на предприятии оптовой торговли
 Задача принятия управленческого решения
 Оценка сложных систем в условиях стохастической неопределенности. (Лекция 10)
 Метрологическое обеспечение АЗС
 Стили работы лидера
 Финансовый менеджмент
 2. Международная Ассоциация Управления Проектами